🕑 5 min read
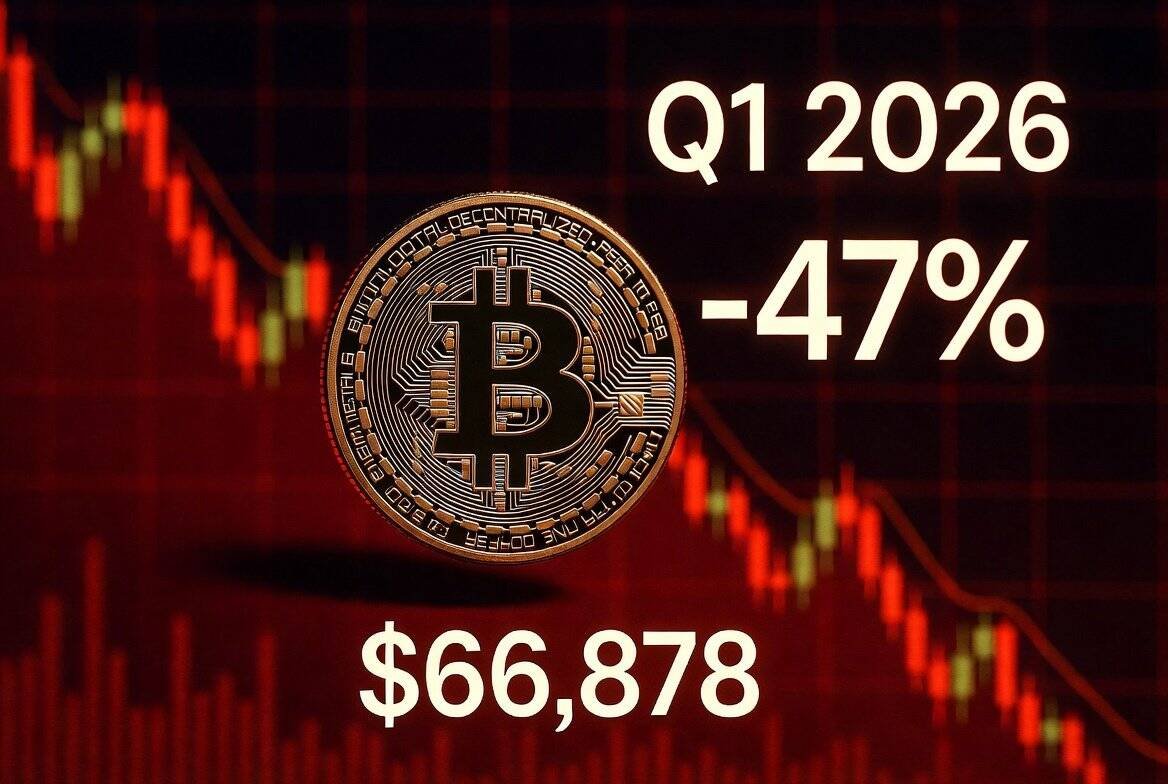
Bitcoin ends Q1 2026 nearly half its value from the October high – and the on-chain damage runs deeper than the price chart shows.
Q1 is over. And it’s ugly.
Bitcoin trades at $66,878 as of Monday morning, down 1.2% in the past 24 hours and 6.2% on the week. That puts BTC roughly 47% below its all-time high of $126,080, set back in October 2025. For context – the last time a single quarter wiped this much value off Bitcoin was the three months following the FTX implosion in late 2022.
But the price only tells half the story in today’s bitcoin price analysis. Underneath the surface, long-term holders are dumping coins at their deepest losses since this entire selloff began. Exchange inflows just hit a six-day streak. And the one potential silver lining? Leverage is finally – finally – unwinding.
The Holders Who Never Sell Just Sold at a 32% Loss
Long-term holder SOPR, a metric tracking whether veteran holders sell at profit or loss, crashed to 0.681 on March 30.
That number needs context. A reading of 1.0 means break-even. Anything below means selling at a loss. At 0.681, long-term holders – wallets that haven’t moved coins in over 155 days – are realizing a roughly 32% loss on every coin they spend.
And this isn’t the first wave. LTH-SOPR already plunged to 0.723 on March 28, which we covered when veteran holders capitulated for the first time. It briefly recovered to 0.866 on March 29. Then it broke lower.
The so-called diamond hands cracked twice in 10 days. The second crack cut deeper.
“Bitcoin has entered a phase where even long-duration holders are de-risking aggressively,” said Ki Young Ju, CEO of CryptoQuant. “This is textbook capitulation behavior.”
Six Straight Days of BTC Exchange Inflows – and Accelerating
Exchange netflow flipped positive on March 26 and hasn’t looked back. Over the past six days, a net 8,648 BTC moved onto exchanges – coins positioned for potential selling.
The breakdown day by day: March 26 saw +1,693 BTC, followed by a quieter +213 on March 27. Then the pace picked up – +885 BTC on March 28, +1,319 on March 29, and a massive +3,615 BTC on March 30. That’s the largest single-day inflow since the initial March 22 selloff. March 31 has already logged +923 BTC by midday.
That March 30 spike stands out. Over $241 million worth of BTC hitting exchange wallets in a single day, right as the quarter closes. Total exchange reserves climbed to 2,710,145 BTC – up from a local low of 2,701,496 on March 25.
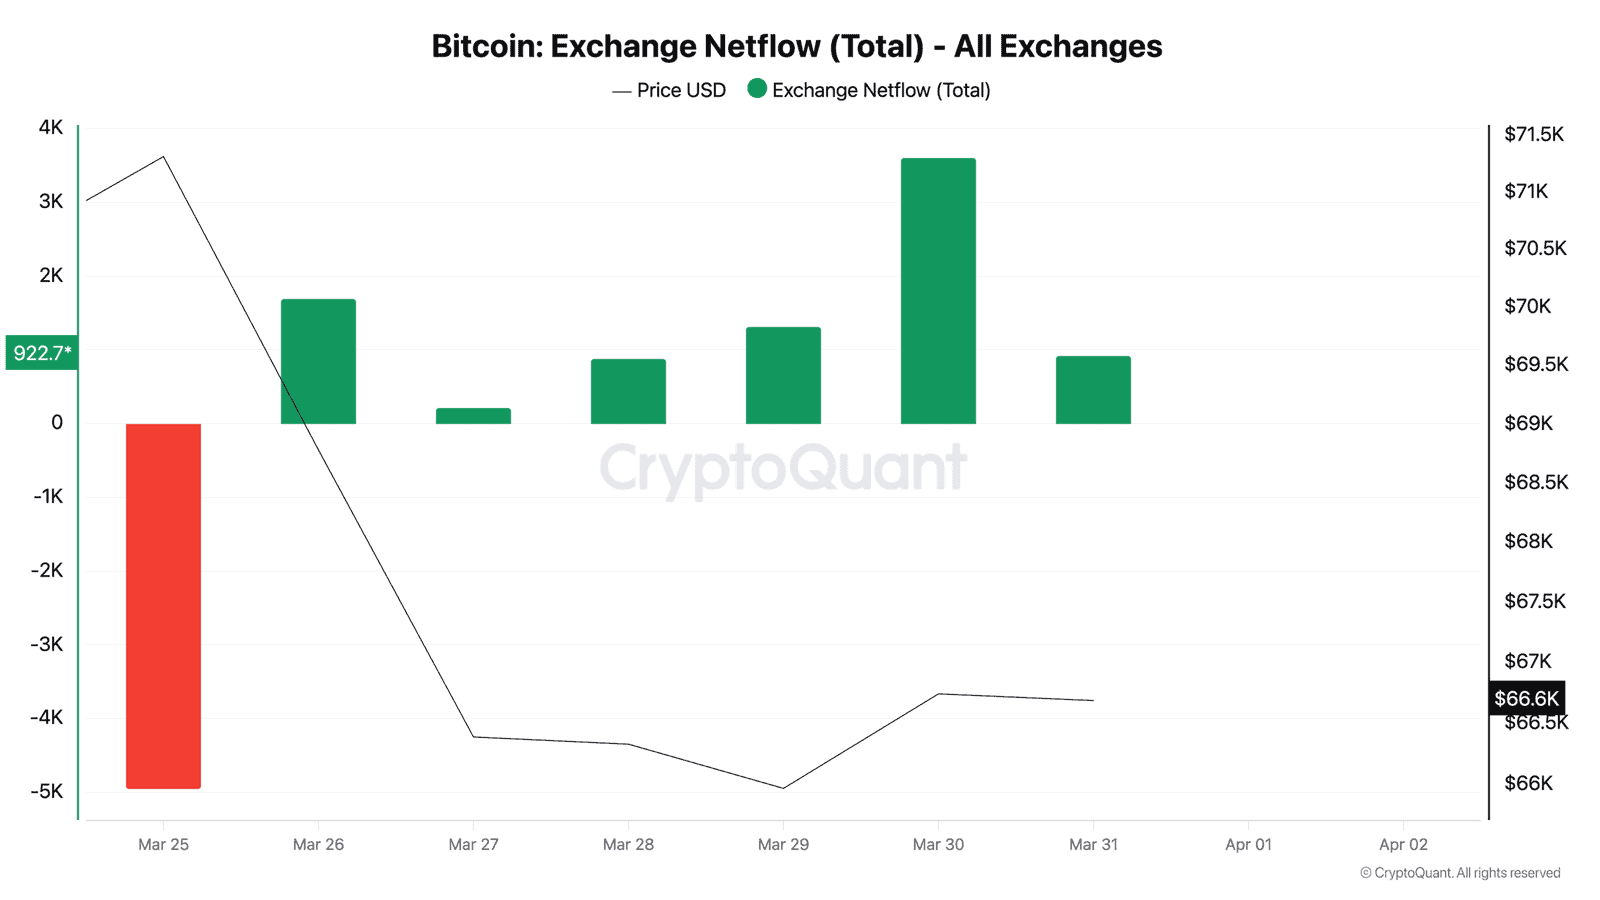
Compare that to the week prior. Between March 22-25, exchanges saw massive outflows totaling over 23,000 BTC. Someone was accumulating aggressively during the initial panic. Now? The flow reversed.
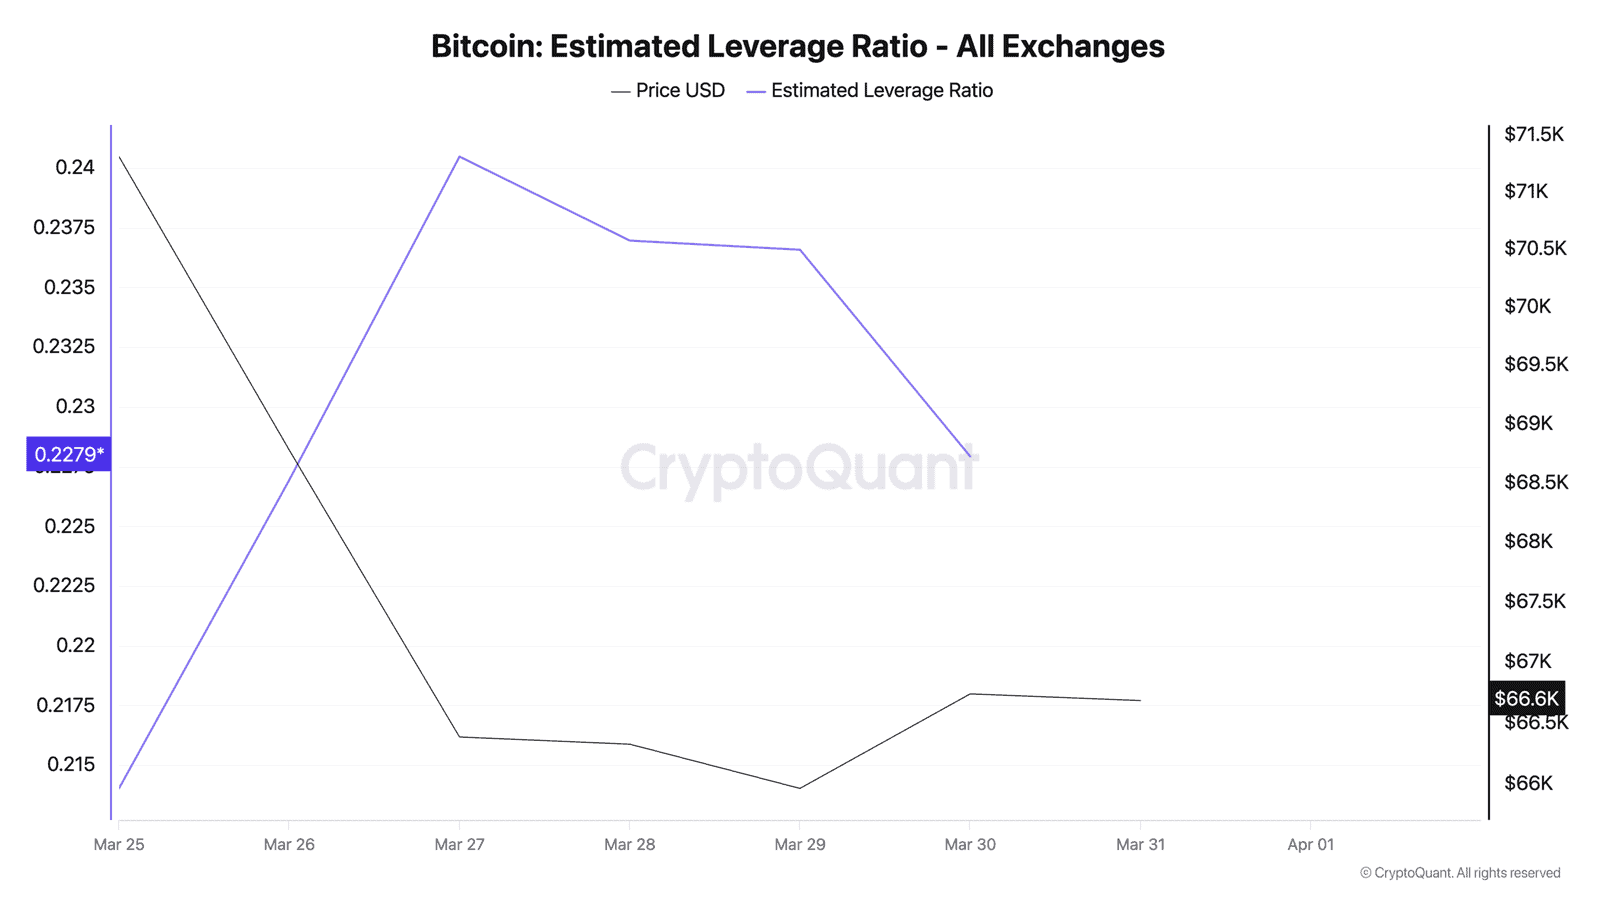
Leverage Ratio Finally Cracks
One genuinely encouraging signal buried in the noise: the estimated leverage ratio dropped to 0.228 on March 30, down from its recent peak of 0.240 on March 27.
Why does this matter? Because our previous analysis flagged leverage building up 12% in five days while the market bled. That’s the kind of setup that ends in a liquidation cascade. The fact that leverage is now unwinding – slowly, not violently – suggests the excess is getting worked off without a blowout.
It’s not dramatic. A 5% decline over three days won’t make anyone’s pulse race. But deleveraging during a downtrend, without a massive liquidation event, is historically how bottoms get built. Not with a bang. With a slow grind.
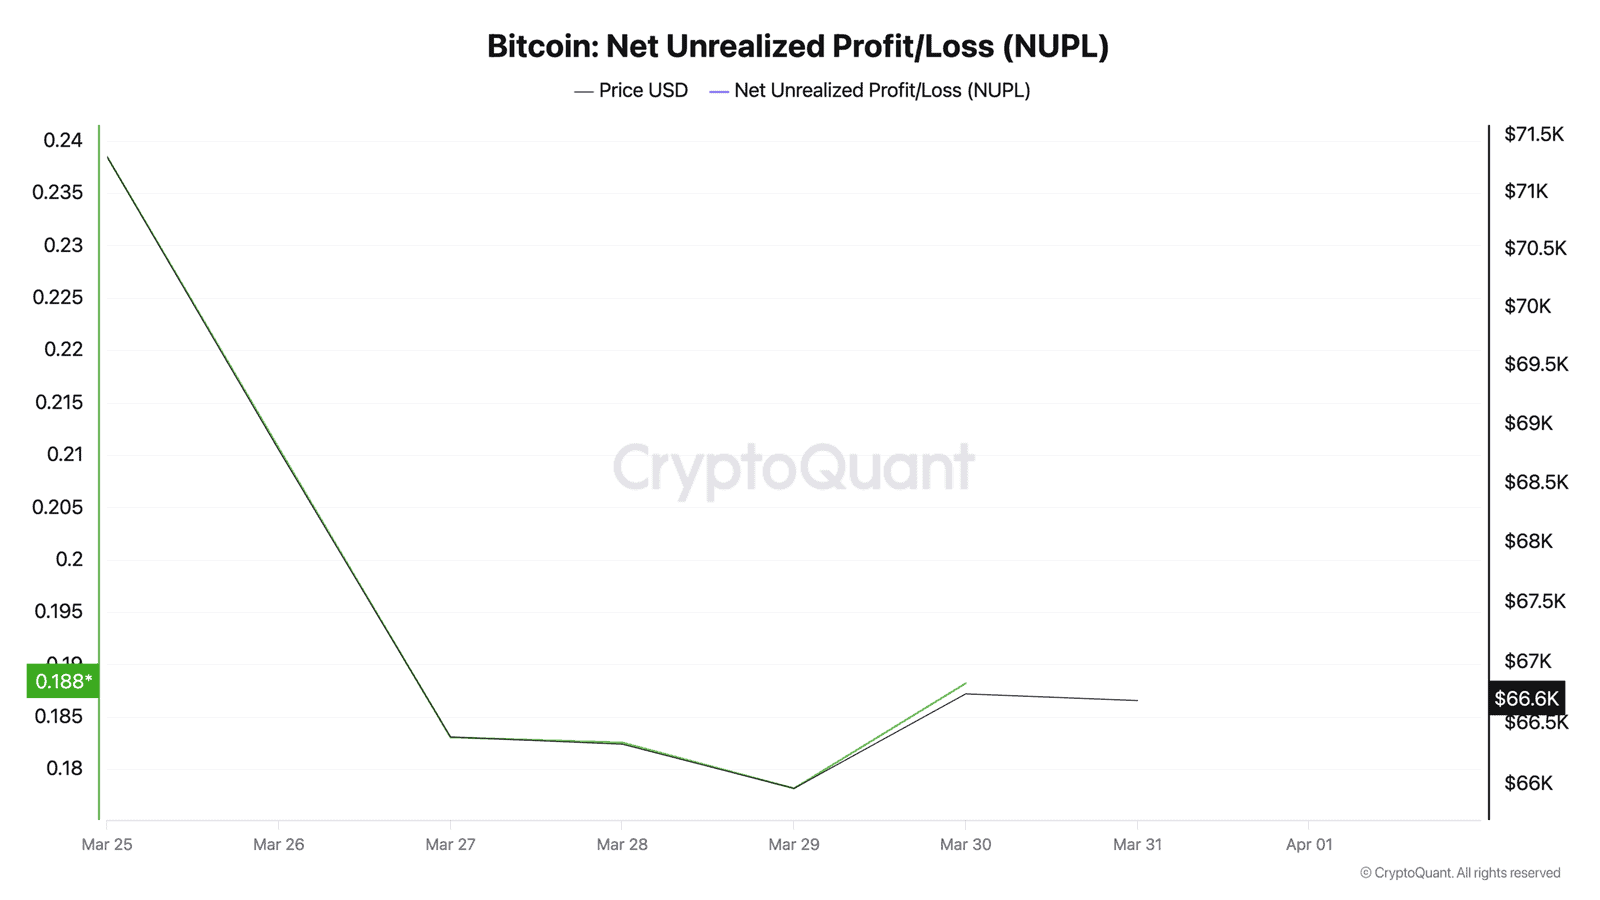
NUPL Sits Three Points From Capitulation
Net Unrealized Profit/Loss came in at 0.188 on March 30 – virtually unchanged from the 0.178 reading two days earlier that we compared to FTX-era levels.
The capitulation zone sits below 0.0. At 0.188, the market is dangling just above it. During the FTX crash, NUPL dipped to -0.05 before bouncing. During COVID, it hit -0.02. We’re not there yet – but we’re closer than at any point since November 2022.
Puell Multiple tells a similar story. At 0.645, miner revenue relative to its 365-day average is deeply depressed. That’s down from 0.675 on March 29 and approaching the 0.619 reading from March 24 – a level not seen since the hash rate capitulation of mid-2022.
Realized price sits at $54,178. BTC currently trades about 23% above its aggregate cost basis. Not much of a buffer.
SOPR: Nine Straight Days of Realized Losses
Aggregate SOPR printed 0.988 on March 30 – the ninth consecutive day below 1.0. Every coin spent on-chain, on average, moves at a loss.
Short-term holder SOPR hovers at 0.992. Long-term holder SOPR, as noted, cratered to 0.681. The divergence is striking: short-term holders are taking shallow cuts while veterans bleed out.
Stablecoin Supply Ratio ticked up to 9.81, from 9.68 on March 29. That $139 billion pool of stablecoins relative to Bitcoin’s market cap represents dry powder. Whether it deploys into BTC or sits on the sidelines through April remains the key question.
ETF holdings? Flat. Institutional funds held 1,318,770 BTC on March 31 – barely changed from 1,318,733 on March 29. After weeks of outflows totaling nearly 6,000 BTC, the bleeding stopped. But fresh buying hasn’t started either.
Key Levels for April
Support: $66,258 (today’s intraday low, immediate support), $64,000 (psychological level plus previous consolidation zone), and $54,178 (realized price – a break below this would mean the average holder is underwater).
Resistance: $68,130 (today’s intraday high), $70,000 (psychological round number, hasn’t held since March 22), and $72,000 (pre-crash support turned resistance).
MVRV at 1.232 suggests the market isn’t deeply undervalued yet by historical standards. During true capitulation events, MVRV drops below 1.0 – meaning market price falls below realized price. We’re not there. But the trajectory over Q1 – from well above 1.5 to barely above 1.2 – paints a clear picture of eroding confidence.
Q1 2026 will be remembered as the quarter where Bitcoin gave back half its ATH gains, long-term holders broke, and leverage quietly started unwinding. Whether that sets up a Q2 recovery or further breakdown depends almost entirely on whether that $139 billion in stablecoin dry powder starts moving.
This analysis is part of our daily Bitcoin price tracking. See all previous analyses and key metrics on our hub page.
This is not financial advice. DYOR. Data as of March 31, 2026.
Leave a Reply