
🕑 5 min read
Exactly one year ago, Trump’s Liberation Day tariffs wiped $6.6 trillion from global markets in 48 hours. Bitcoin dropped 10.4% to $74,436. Pundits called it the end of the bull run.
Six weeks later, BTC hit $111,616 – a new all-time high. A 50% rally that blindsided everyone who sold the panic.
Now the anniversary arrives with bitcoin trading at $67,182, down 47% from that very peak. And every single on-chain metric that preceded last year’s rebound is flashing again – except this time, the readings are more extreme.
What Liberation Day Actually Did to Bitcoin
Trump signed Executive Order 14257 on April 2, 2025, slapping tariffs on 57 countries. China got 34%. The EU got 20%. Markets went into freefall.
The S&P 500 shed 10.5% in two trading sessions – the fifth-worst two-day crash since 1950. The VIX spiked to 45.31, highest since COVID. Bitcoin, still stuck in its “risk asset” costume, correlated at 0.88 with the S&P and tanked from $83,100 to $74,436 in five days.
But something happened that most traders missed during the chaos.
Exchange outflows accelerated. Whales bought the dip. And when Trump announced a 90-day tariff pause on April 9, bitcoin ripped 7% in a single day while the Nasdaq posted its second-best session ever (+12.16%). By May 22, BTC sat at $111,616 – a fresh all-time high.
The crash wasn’t the story. The setup was.
The Tariff Landscape Flipped Upside Down
That original Liberation Day order? The Supreme Court killed it.
On February 20, 2026, the justices ruled 6-3 that Trump’s IEEPA-based tariffs exceeded presidential authority. Some $170 billion in collected tariffs now face refund claims – roughly 2,000 filed and counting. Trump pivoted to a 10% global surcharge under Section 122 of the Trade Act, but that authority expires July 24, 2026.
Section 301 investigations targeting 16 economies are ongoing, with hearings scheduled for April 28 through May 1. If those aren’t wrapped up before the Section 122 expiry, there’s a legal void – no clear statutory basis for maintaining tariffs at all.
For crypto, the direct impact was always indirect: risk-off sentiment, dollar strength, liquidity tightening. What matters now isn’t the tariffs themselves. It’s where bitcoin’s on-chain fundamentals sit compared to where they sat when the last tariff shock hit.
Every On-Chain Signal Is More Extreme Than Last April
During the original Liberation Day crash, bitcoin was coming off highs near $83,000. Fear & Greed hovered in neutral territory. On-chain metrics showed a healthy market absorbing a macro shock.
None of that describes today.
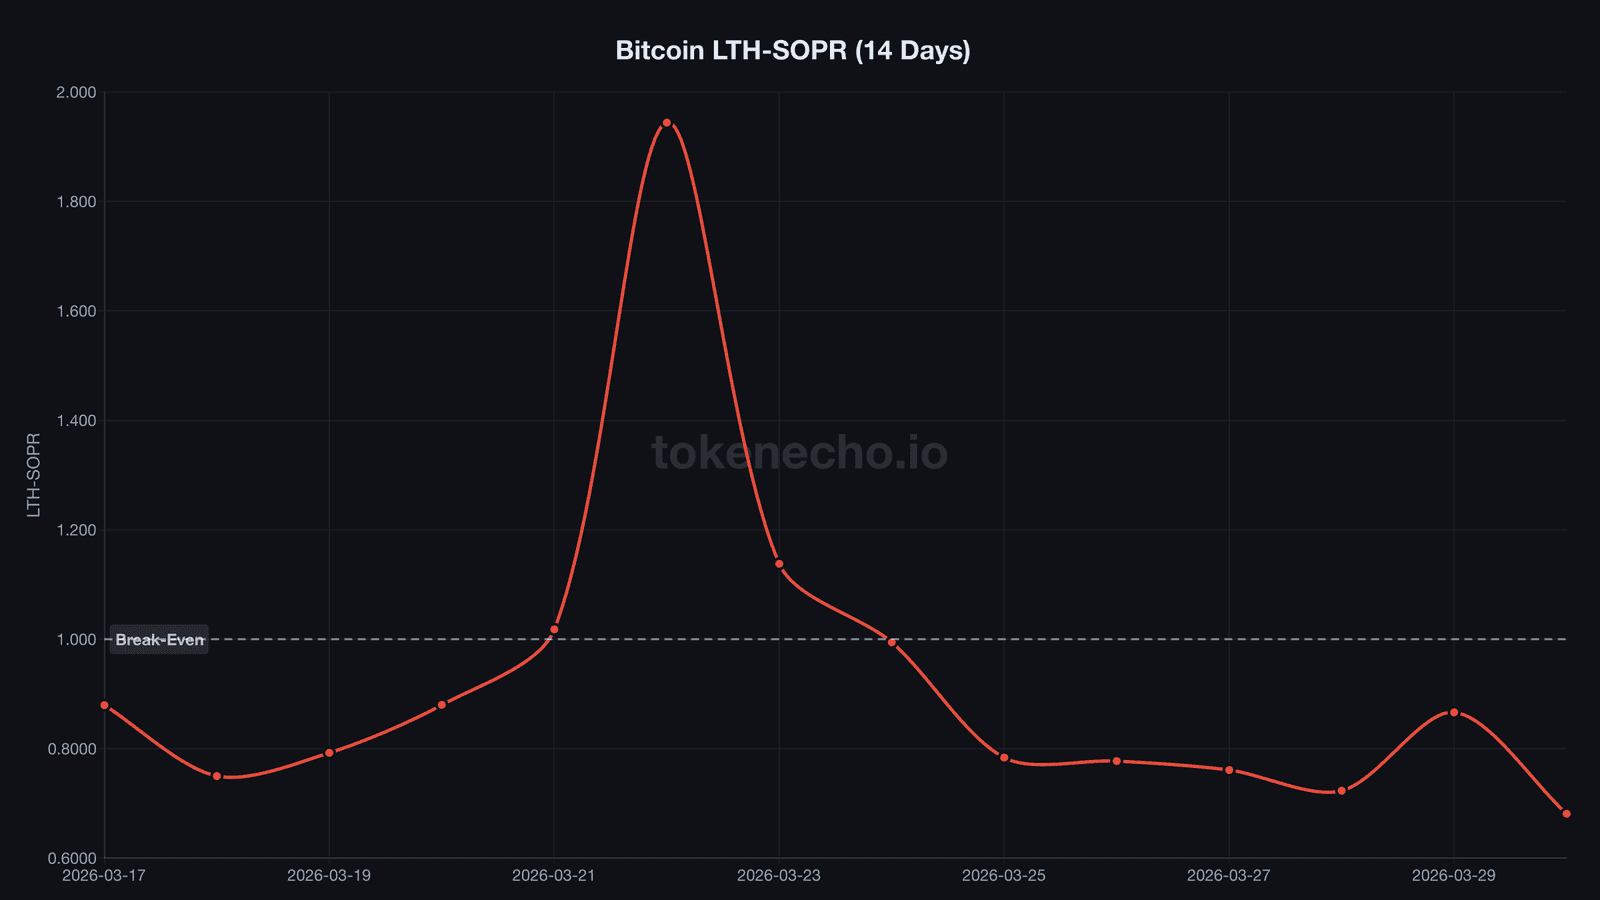
LTH-SOPR – the ratio measuring whether long-term holders sell at a profit or loss – cratered to 0.681 on March 30. That’s a new cycle low. Long-term holders who survived FTX, Luna, and COVID are now selling at a 32% average loss. During the Liberation Day crash a year ago, LTH-SOPR stayed above 1.0 – long-term holders were still profitable. Not anymore.
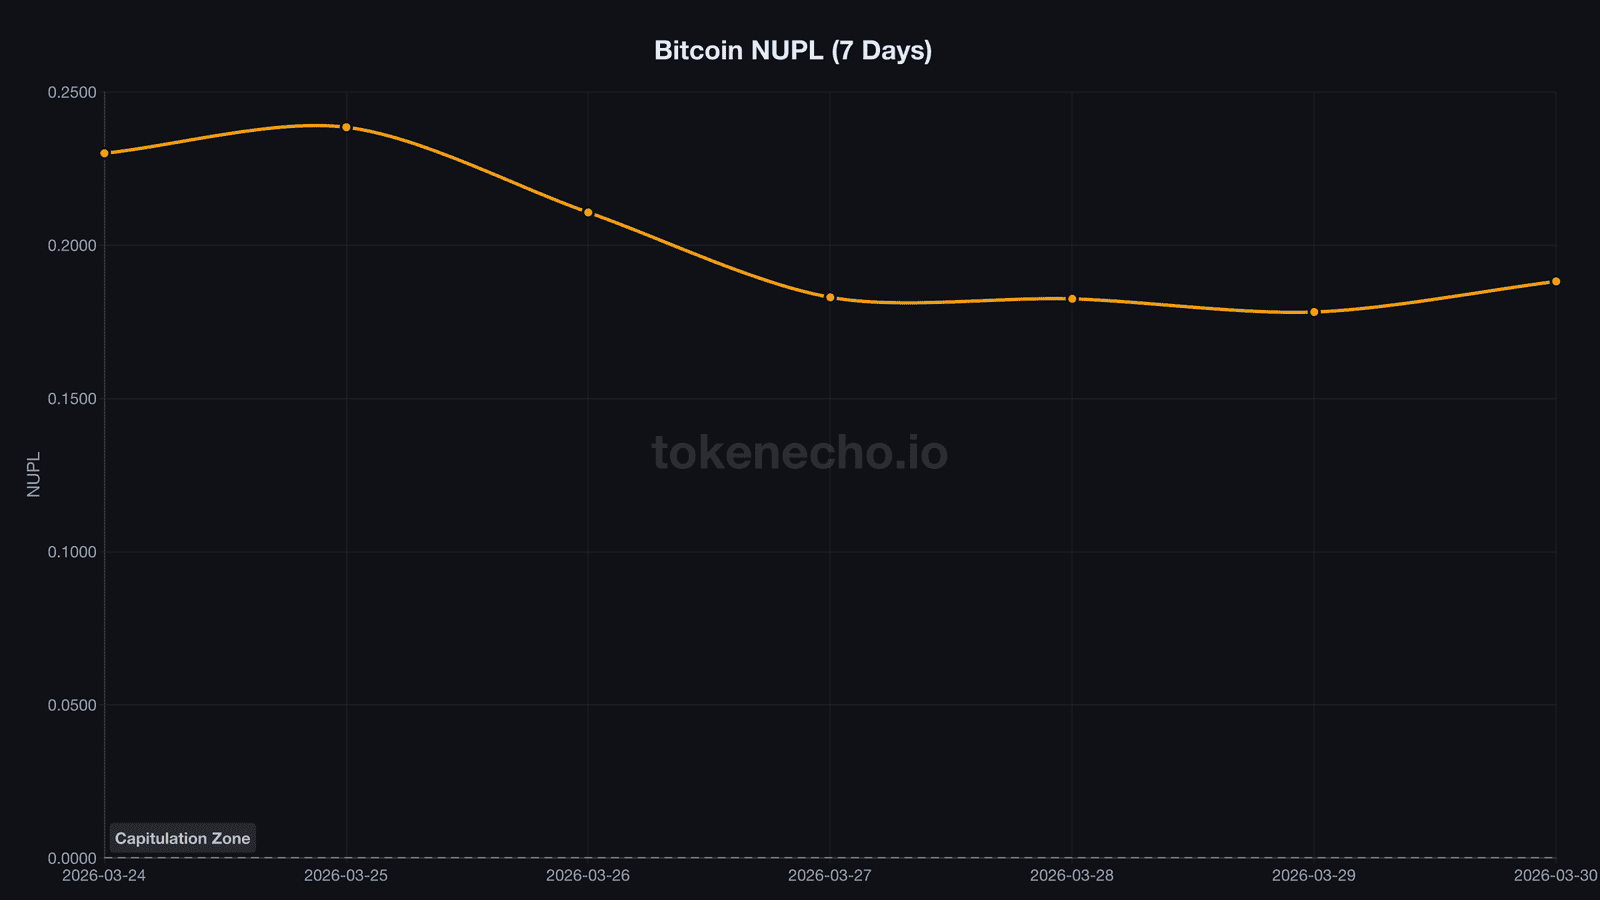
SOPR itself has spent 10 consecutive days below 1.0, meaning the entire market is selling at a loss. NUPL slid to 0.188, scraping the capitulation zone. The last time it got this low? November 2022. Right before bitcoin launched its post-FTX rally.
“Bitcoin has been stuck in no man’s land between optimism and capitulation for nearly two months,” said Ki Young Ju, CEO of CryptoQuant. “But the on-chain structure looks identical to late 2022.”
$139 Billion Waits on the Sideline
The Stablecoin Supply Ratio dropped to 9.81 – its lowest since the post-FTX accumulation phase. Translated: there’s roughly $139 billion in stablecoin purchasing power relative to bitcoin’s market cap.
That’s a loaded spring.
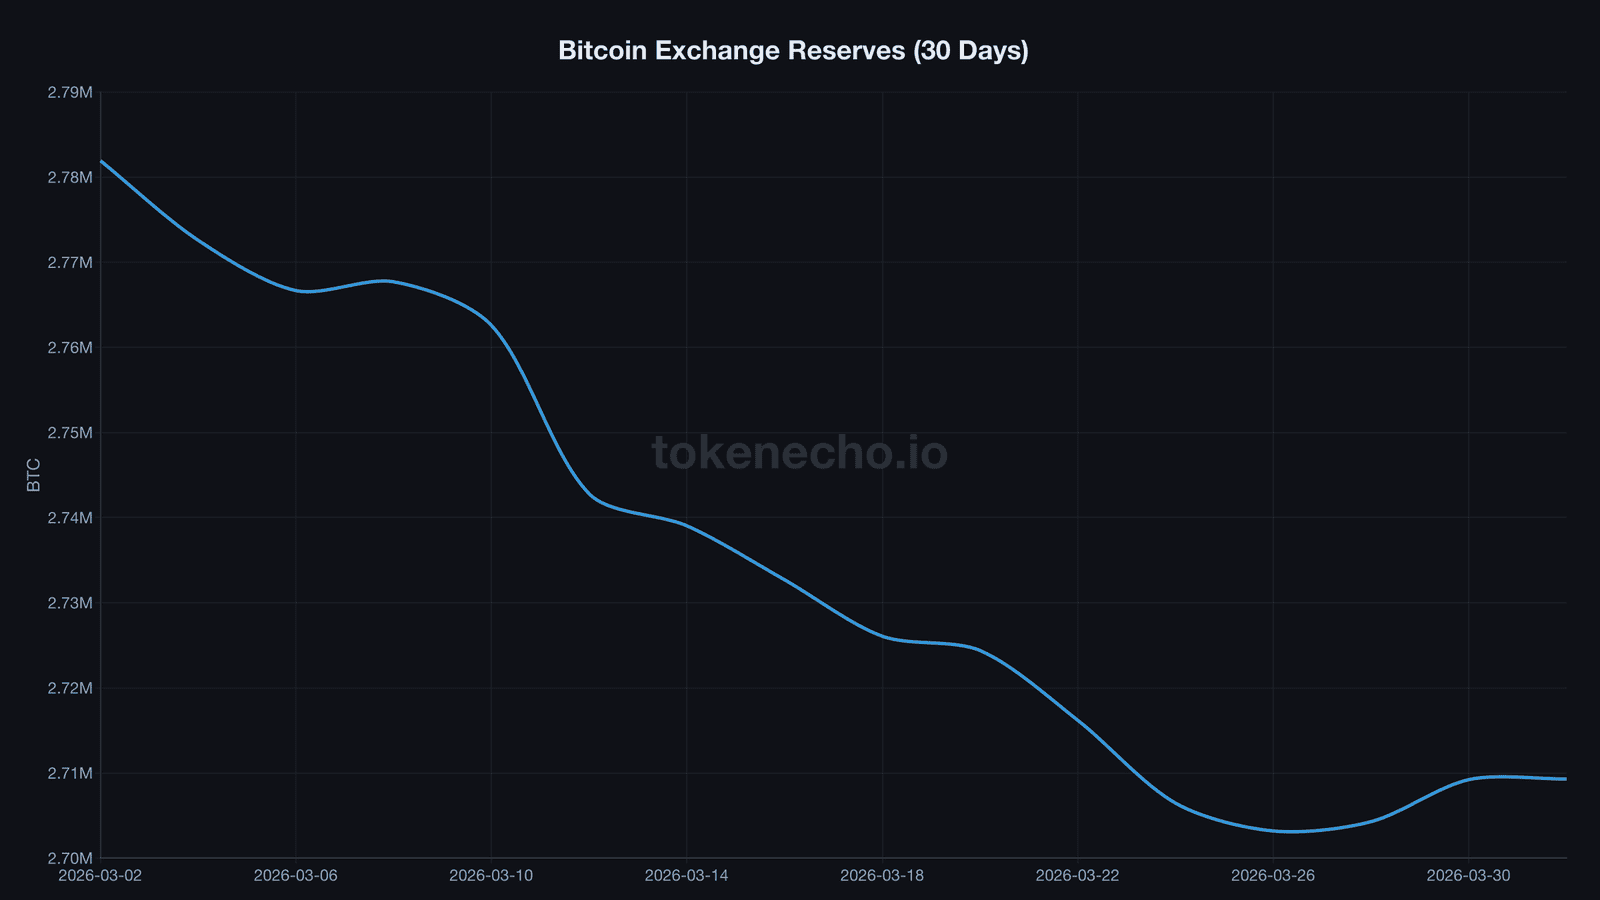
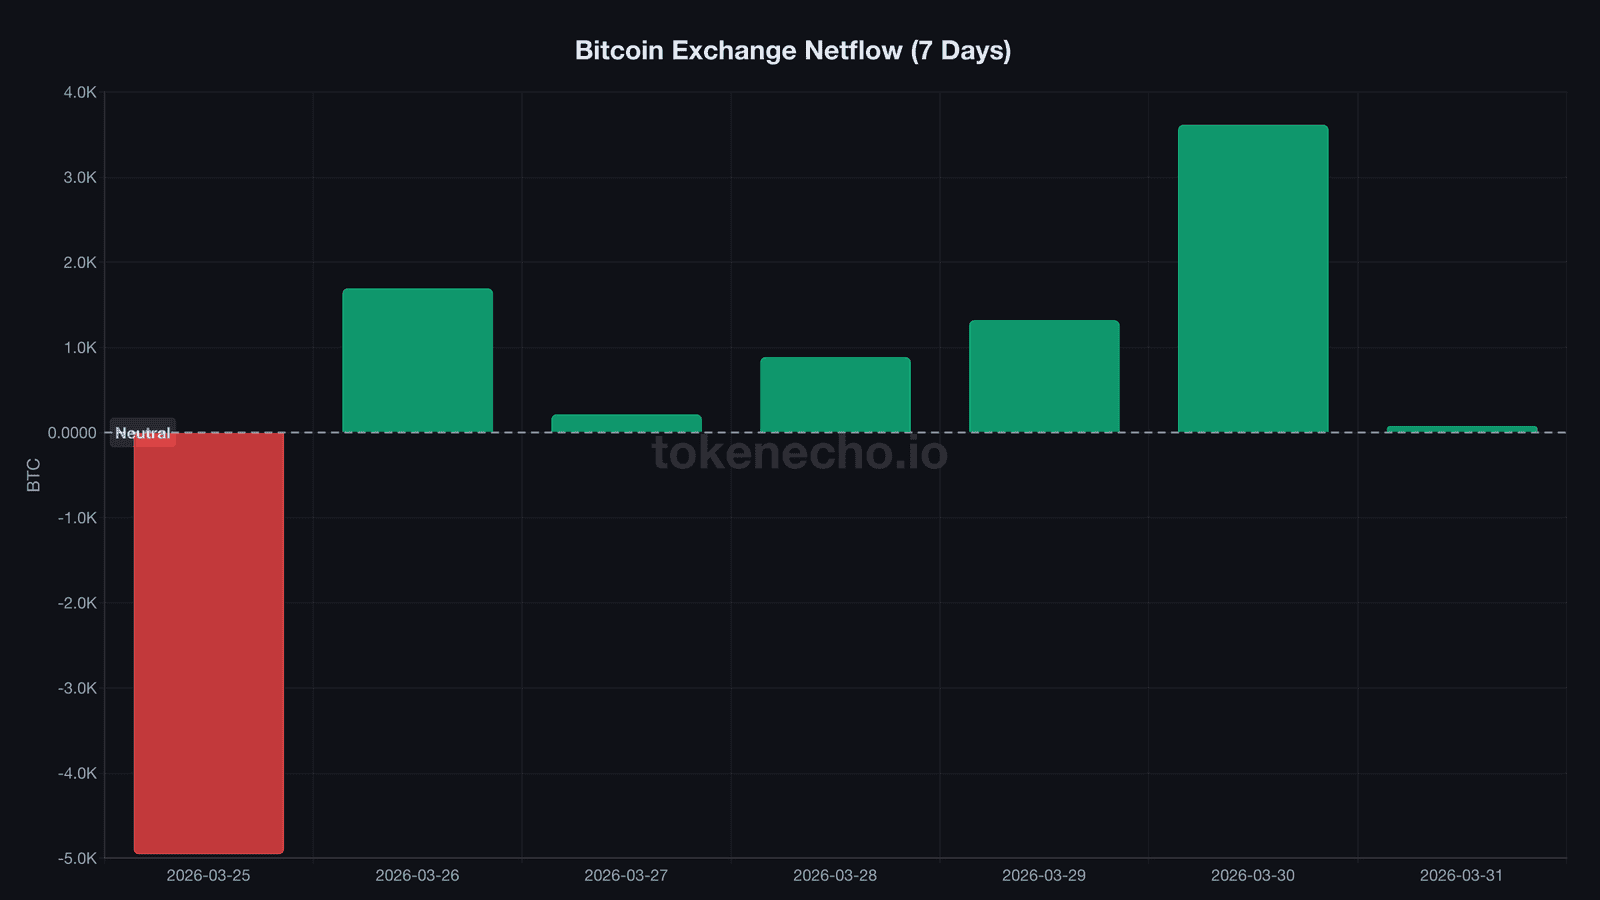
Exchange reserves tell a more complicated story. After weeks of decline – from 2,781,928 BTC on March 2 to a local low of 2,701,496 on March 25 – reserves ticked back up by 7,801 BTC over the past six days. Net inflows five out of six days, with March 30 alone seeing +3,615 BTC flow onto exchanges.
Short-term selling pressure? Sure. But zoom out: reserves are still down 72,631 BTC from the start of the month. And the Puell Multiple sits at 0.645, deep in the green zone, confirming miners are under severe revenue stress. Mining bitcoin currently costs more than it’s worth – the last time this dynamic resolved, it resolved upward.
Even Saylor Blinked
Strategy – formerly MicroStrategy, the company synonymous with “buy bitcoin no matter what” – filed an 8-K on March 30 confirming zero purchases for the week. That broke a 13-week consecutive buying streak, the longest in the company’s history.
762,099 BTC sitting on their balance sheet. Zero new buys. Michael Saylor skipped his signature Sunday “orange dot” tweet and posted about preferred stock instead.
When the single most aggressive corporate buyer stops buying during bitcoin’s worst quarter since 2018 – a quarter where BTC fell 23% from $87,700 to $67,200 – it either signals exhaustion or a deliberate pause before the next chapter.
The funding pipeline that fueled Strategy’s spree appears dry. No new equity issued through at-the-market programs. Yet their average cost basis sits around $67,458 – almost exactly where BTC trades today. They’re not underwater. They’re just not adding.
The Liberation Day Playbook – and Why This Time Could Be Bigger
Last April’s script: tariff shock, 10% crash, extreme fear, exchange outflows, 50% rally to ATH in six weeks.
Today’s setup runs deeper. NUPL is at capitulation levels that took months to reach during FTX, not days. LTH-SOPR is printing numbers that long-term holder cohorts have never experienced in a post-halving year. And $139 billion in stablecoins is the most dry powder the market has ever held during a capitulation signal.
But the market also faces something it didn’t face last April: institutional ambivalence. ETF holdings have barely moved – 1,318,770 BTC – neither panic selling nor aggressively buying. Morgan Stanley’s MSBT spot bitcoin ETF, with its market-leading 0.14% fee, is reportedly days from launching. That could be the institutional catalyst this setup needs.
The leverage ratio peaked at 0.240 on March 27 and has since declined to 0.228 – a healthy deleveraging that cleans the derivatives overhang without a liquidation cascade. When leverage drops while spot accumulation signals build, the market is resetting for a directional move.
Last time, that direction was up. By 50%.
This is not financial advice. DYOR. Data as of March 31, 2026.
Sources
- CryptoQuant API: SOPR, NUPL, exchange netflow, exchange reserves, leverage ratio, Puell Multiple, SSR (accessed March 31, 2026)
- CoinGecko API: BTC price, market cap, ATH data (accessed March 31, 2026)
- Supreme Court IEEPA Tariff Ruling – SCOTUSblog
- Strategy Breaks 13-Week BTC Buying Streak – Bitcoin Magazine
- Liberation Day Tariffs – Tax Foundation
Leave a Reply