
🕑 5 min read
The Puell Multiple drops to 0.625 — its lowest level this cycle — while 4,840 BTC quietly leave exchanges in four days.
Bitcoin miners are earning less right now than at any point this cycle.
The Puell Multiple, a ratio that compares daily miner revenue to its 365-day moving average, cratered to 0.625 on April 3. That’s below the 0.645 floor from just four days earlier — a new cycle low. Bitcoin, meanwhile, couldn’t be bothered. It sits at $66,911 as of April 4, 2026, up a negligible 0.43% in 24 hours and barely 0.91% on the week.
Flat. Bored. While the people who actually secure the network bleed money.
This bitcoin price analysis breaks down why miner revenue fell off a cliff, why long-term holders just started selling at a loss for the second time in a week, and why 4,840 BTC worth $324 million have quietly disappeared from exchanges since March 31.
Miner Revenue Hits Its Lowest Point — and the Math Keeps Getting Worse
Imagine running a factory where every product costs more to make than you can sell it for. That’s Bitcoin mining at $66,900.
CoinShares pegged the average BTC production cost at roughly $80,000 for publicly listed miners in their Q1 2026 report. Spot price: $66,911. That’s a $13,100 loss per coin minted — and the gap is widening, not shrinking.
The Puell Multiple has been in freefall. From 0.814 on March 28, it dropped to 0.782 on April 1, then to 0.685, and now to 0.625. Six days. A 23% revenue collapse relative to the annual baseline, per CryptoQuant data.
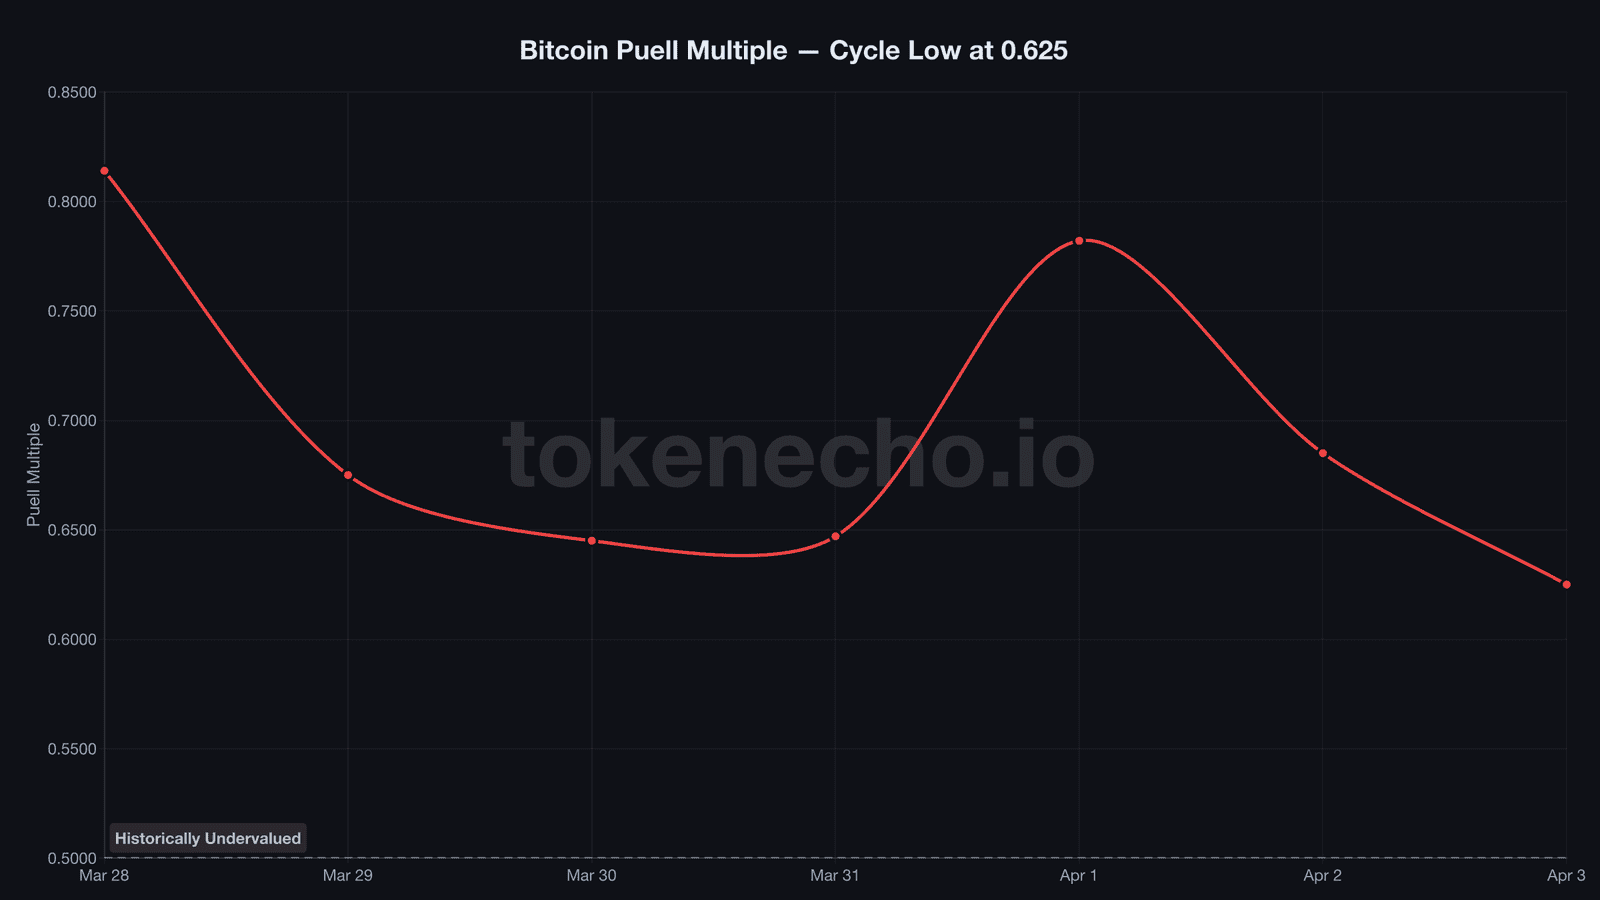
Anything below 0.5 has historically marked generational buying opportunities — the kind of zone that preceded the 2018 and 2022 bottoms. We’re not there. But the trajectory isn’t exactly reassuring.
Hashrate tells the same story from a different angle. Network compute power swung from 1,077 EH/s on April 1 down to 912 EH/s by April 3. A 15% drop in 48 hours. Less efficient rigs are going dark.
“We’re pivoting to become a diversified digital infrastructure company,” MARA Holdings CEO Fred Thiel said during the company’s latest earnings call. Translation: mining Bitcoin at a loss doesn’t work as a business model. MARA already dumped 15,133 BTC — worth $1.1 billion — over two months to fund that pivot. It wasn’t alone. Bitdeer ran its BTC treasury to zero. Core Scientific sold $175 million worth.
When miners start selling the product they’re supposed to believe in, pay attention.
Long-Term Holders Started Selling at a Loss. Again.
Long-term holders — wallets untouched for over 155 days — are supposed to be the conviction class. The diamond hands who don’t flinch at drawdowns.
They flinched. Twice in a week.
LTH-SOPR, a metric that tracks whether long-term holders sell above or below their cost basis, cratered from 0.991 on March 31 to 0.753 by April 3. That means the average long-term seller is locking in a 25% loss. For context, the cycle floor was 0.681 on March 30. We bounced to near break-even. And now we’re heading right back down.
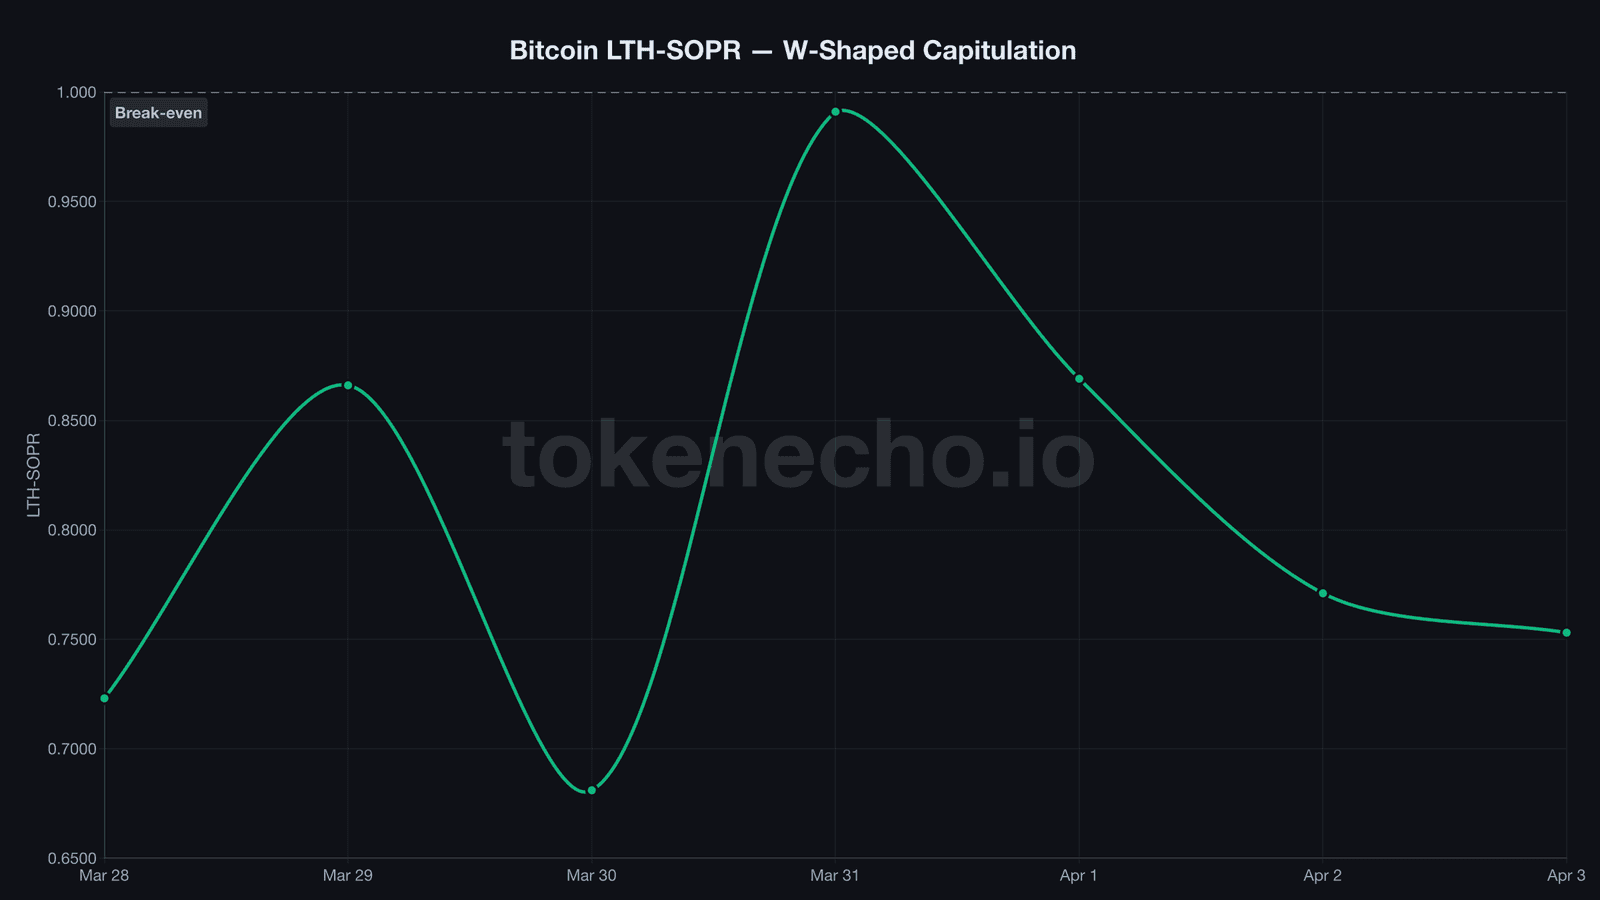
It’s a textbook W-pattern. First dip to 0.681, recovery to 0.991, second dip to 0.753. The bears didn’t let them escape.
Broader SOPR — covering all sellers, not just long-term ones — reads 0.995. That’s 13 consecutive days below the 1.0 break-even line. Every person selling Bitcoin right now, on average, is eating a loss. Short-term holders at 0.996. Long-term holders at 0.753. Nobody’s making money.
NUPL, the net unrealized profit/loss ratio for the entire network, slid from 0.206 back to 0.192 — erasing the brief April 1 recovery. Capitulation territory sits at 0.0. We’ve been drifting toward it since late January.
Miner capitulation and long-term holder capitulation don’t usually happen at the same time. When they do, it tends to mark the point where sellers simply run out of things to sell.
$324M in BTC Left Exchanges While the Price Went Nowhere
So who’s buying all this BTC that miners and long-term holders keep dumping?
Exchange reserves dropped from 2,709,944 BTC on March 31 to 2,705,104 on April 4 — a net outflow of 4,840 BTC worth roughly $324 million. The pattern has been choppy according to CryptoQuant: a massive 3,549 BTC withdrawal on April 1, a partial reversal on April 3 (+213 BTC), and another 667 BTC departure today.
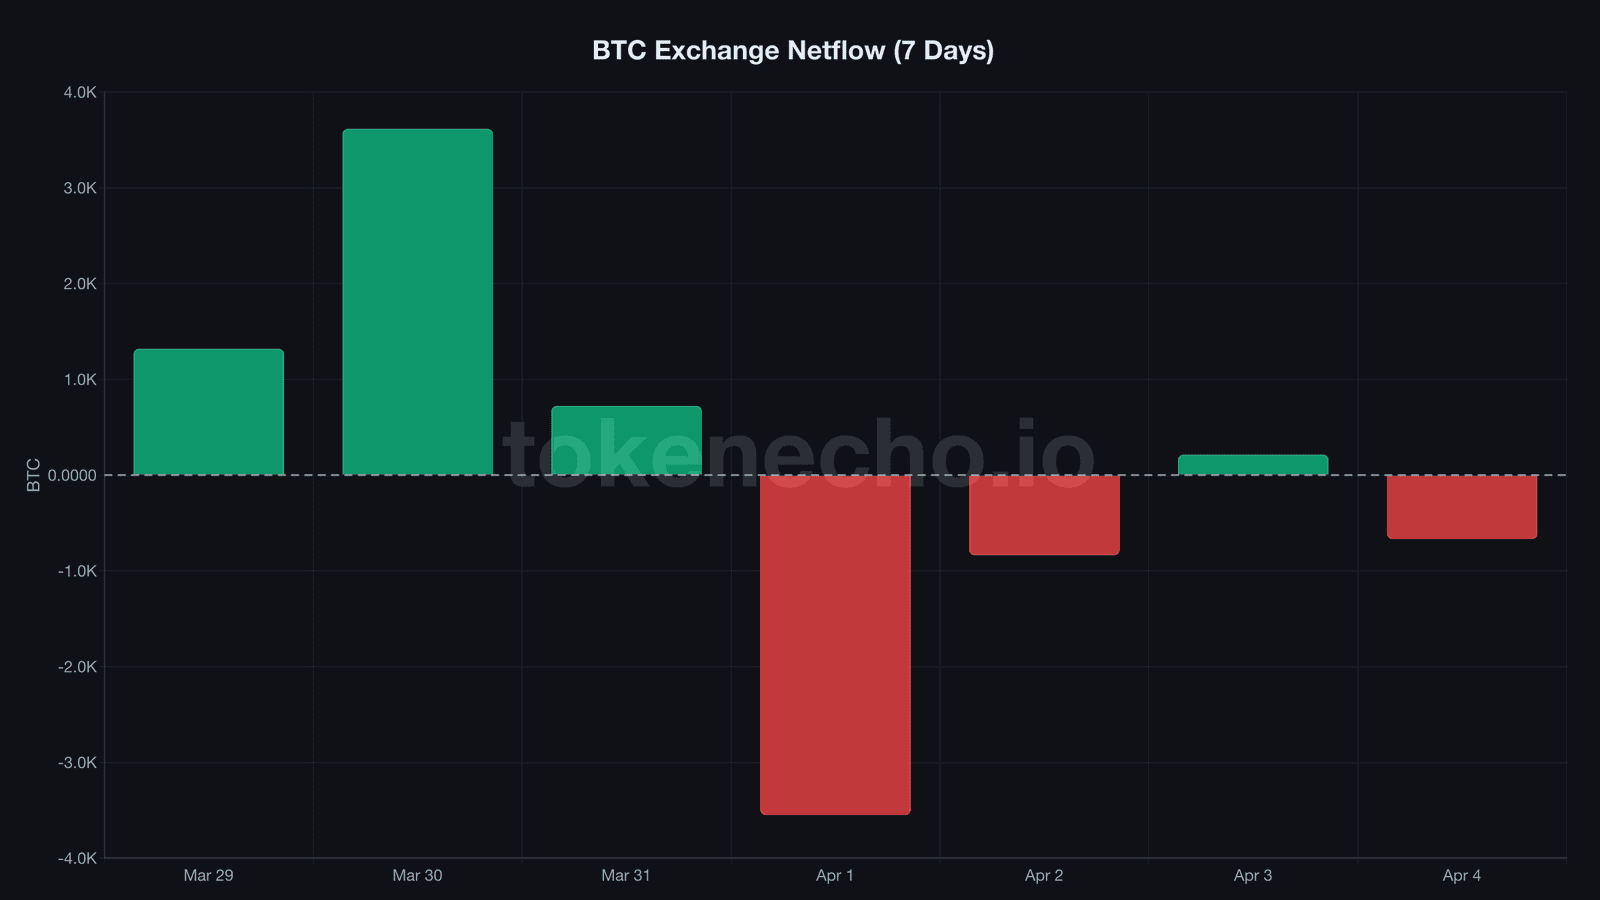
But the net direction is clear. Coins are leaving trading platforms and moving to cold storage or OTC desks.
The leverage picture reinforces the story. The estimated leverage ratio fell from 0.237 in late March to 0.225 — a 5% decline signaling voluntary deleveraging. Traders are closing derivative positions, not opening new ones. Whatever buying pressure exists right now, it’s coming from spot. Not leveraged bets.
ETF holdings have stabilized at 1,318,699 BTC — virtually unchanged from a week ago. After weeks of outflows, institutions stopped selling. They haven’t turned aggressive buyer again, but the bleeding stopped. That’s something.
And the dry powder keeps building. The Stablecoin Supply Ratio sits at 9.92, representing roughly $135 billion in stablecoin capital parked on the sidelines. That powder keg has grown steadily since mid-March — like a coiled spring that nobody’s willing to release yet.
Conditions, Not Predictions
If the Puell Multiple breaches 0.5 while exchange outflows continue, the setup rhymes with late 2022 — when miner capitulation at that exact threshold marked the absolute bottom. But we’re at 0.625, not 0.5. That gap matters.
For bulls, the ingredients are assembling: leverage flushed to 4-week lows, long-term holders running out of room for further capitulation, spot accumulation ticking on, and $135 billion in stablecoin dry powder on the sidelines.
For bears, the counter is straightforward: SOPR hasn’t crossed 1.0 in 13 days, NUPL keeps sliding back toward capitulation, and miners are running negative margins at $66.9K. A drop below $64,000 support could trigger forced liquidations from the miners still hanging on.
| Metric | Value | Signal |
|---|---|---|
| Price | $66,911 | +0.43% 24h, -46.9% ATH |
| Puell Multiple | 0.625 | Cycle low (miner stress) |
| SOPR | 0.995 | 13 days below 1.0 |
| LTH-SOPR | 0.753 | W-shaped capitulation |
| MVRV | 1.237 | Compressed |
| NUPL | 0.192 | Sliding toward capitulation |
| Leverage Ratio | 0.225 | Deleveraging (-5%) |
| Exchange Reserves | 2,705,104 BTC | -4,840 in 4 days ($324M) |
| ETF Holdings | 1,318,699 BTC | Stable |
| SSR | 9.92 | ~$135B dry powder |
| Realized Price | $54,128 | 24% below spot |
This analysis is part of our daily Bitcoin price tracking. For long-term outlook, see our Bitcoin Price Prediction 2026-2030.
Miners say they won’t sell. Long-term holders said the same thing — and capitulated twice. Whether $66.9K holds depends on which side blinks first.
This is not financial advice. DYOR. Data as of April 4, 2026.
Sources:
- CoinGecko Bitcoin data — price, market cap, ATH, volume
- CryptoQuant — SOPR, LTH-SOPR, MVRV, NUPL, Puell Multiple, exchange flows, leverage ratio, SSR, hashrate, realized price, ETF holdings
- CoinShares Q1 2026 Bitcoin Mining Report — production cost estimates
Leave a Reply