
🕑 4 min read
Ethereum’s busiest trading venues just went silent.
Total exchange activity – inflows plus outflows combined – dropped from 2.39 million ETH on March 31 to 358,000 on April 4. An 85% collapse in four days.
And ETH didn’t move. It sat at $2,044 like nothing happened.
This isn’t just sellers drying up, which we covered in our previous analysis. Both sides walked away.
Exchange Activity Drops 85% – Both Sides Walked Away
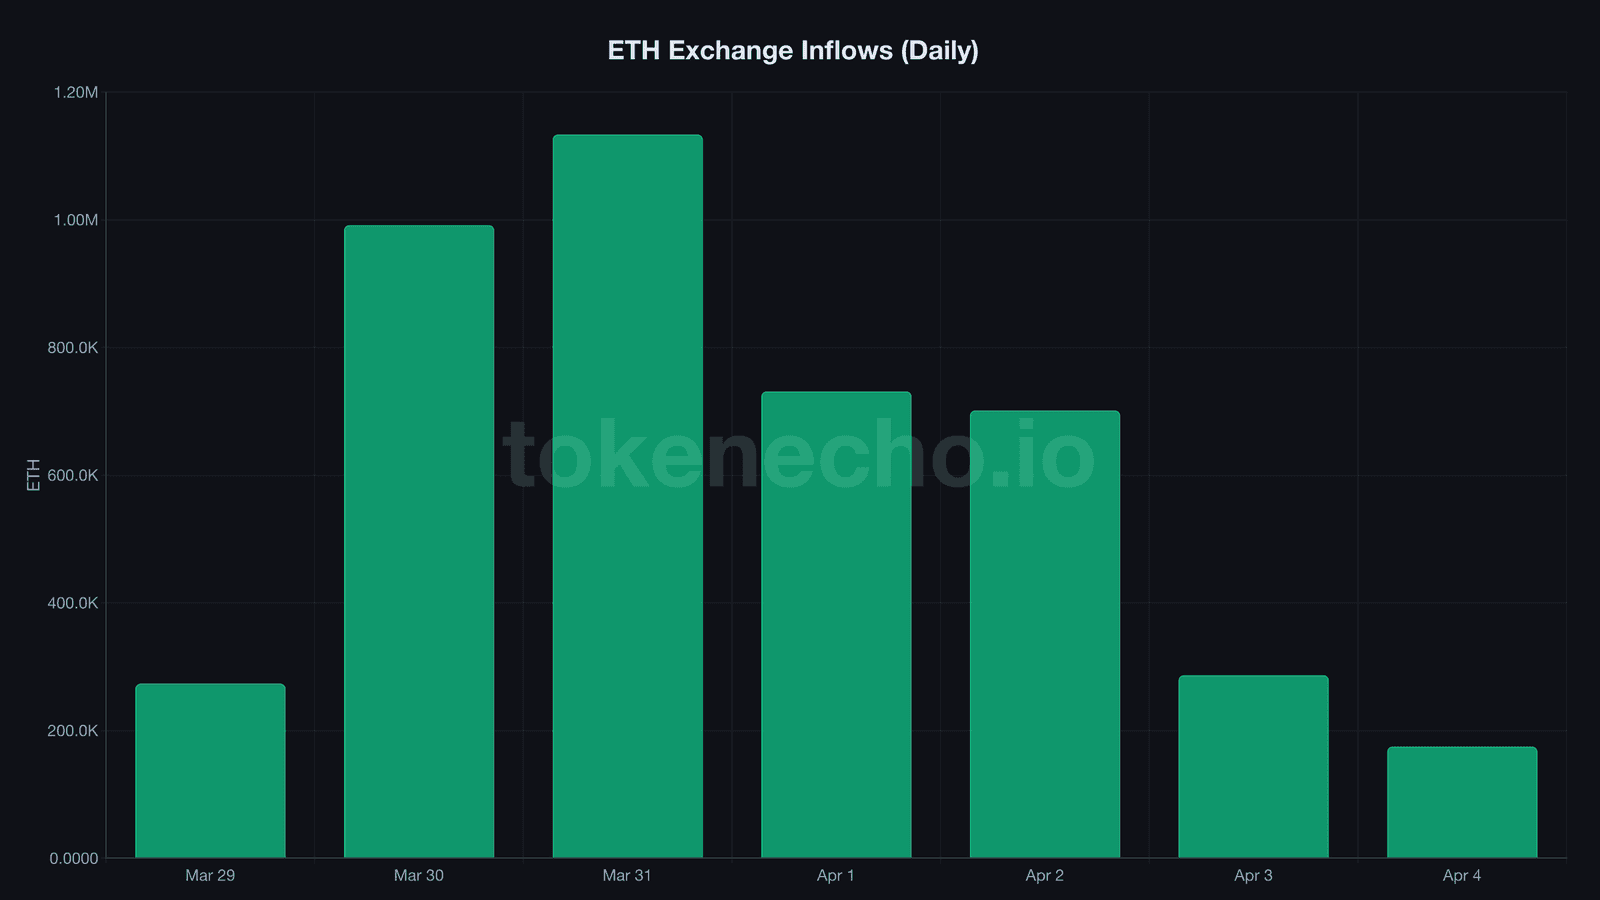
358,000 ETH. That’s all the combined exchange activity Ethereum logged on April 4.
Inflows to exchanges, a proxy for selling pressure, crashed from 1.13 million ETH on March 31 to just 174,672 by April 4. That’s the thinnest deposit volume we’ve tracked this entire cycle.
Outflows dropped too – from 1.25 million to 183,568. But they’ve stayed above inflows every single day this week, maintaining a quiet net drain that nobody seems to be paying attention to.
The price didn’t care. ETH sat at $2,044 as of Saturday morning, barely moving in either direction – 58.7% below its all-time high of $4,946 from August 2025.
It’s the crypto equivalent of a trading floor where every broker went to lunch at the same time and forgot to come back – except the back-office clerks, who kept processing withdrawal orders in the background like nothing had changed.
Leverage Crashed 4.4% But Spot Accumulation Didn’t Stop
Derivatives traders are leaving. Spot accumulators aren’t.
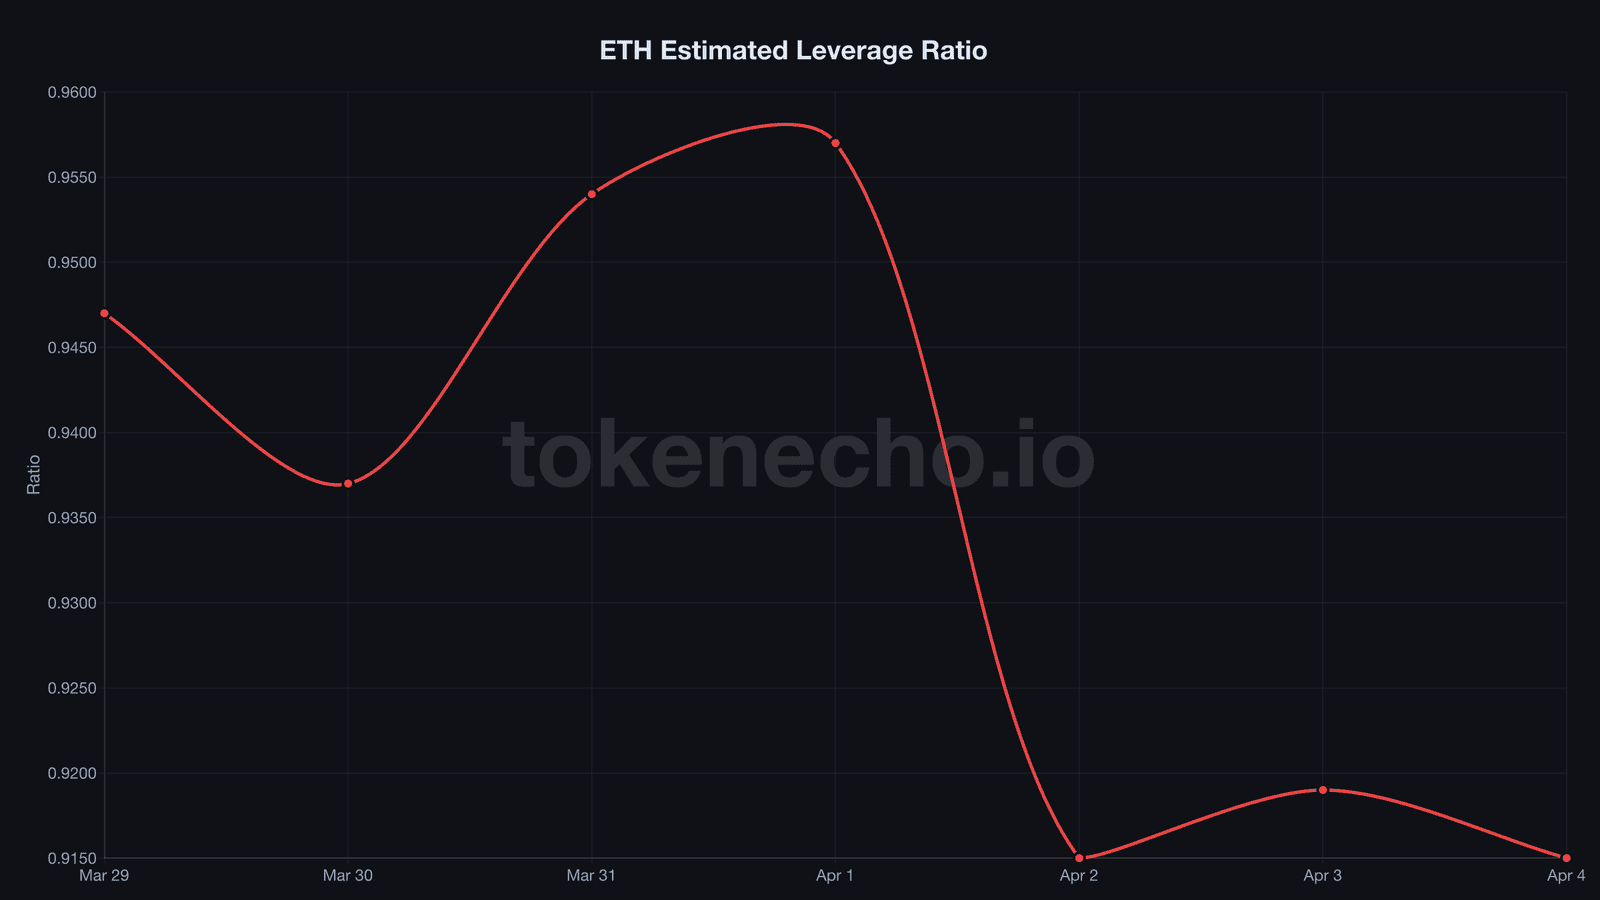
Ethereum’s estimated leverage ratio, a metric that measures open interest relative to exchange reserves, peaked at 0.957 on April 1. Three days later it sat at 0.915 – a 4.4% drop that marks one of the sharpest deleveraging events ETH has seen this quarter.
When exchange activity collapses this hard, derivative positions built on thin liquidity become a liability. Traders who survived the March wipeout aren’t sticking around to test their luck again.
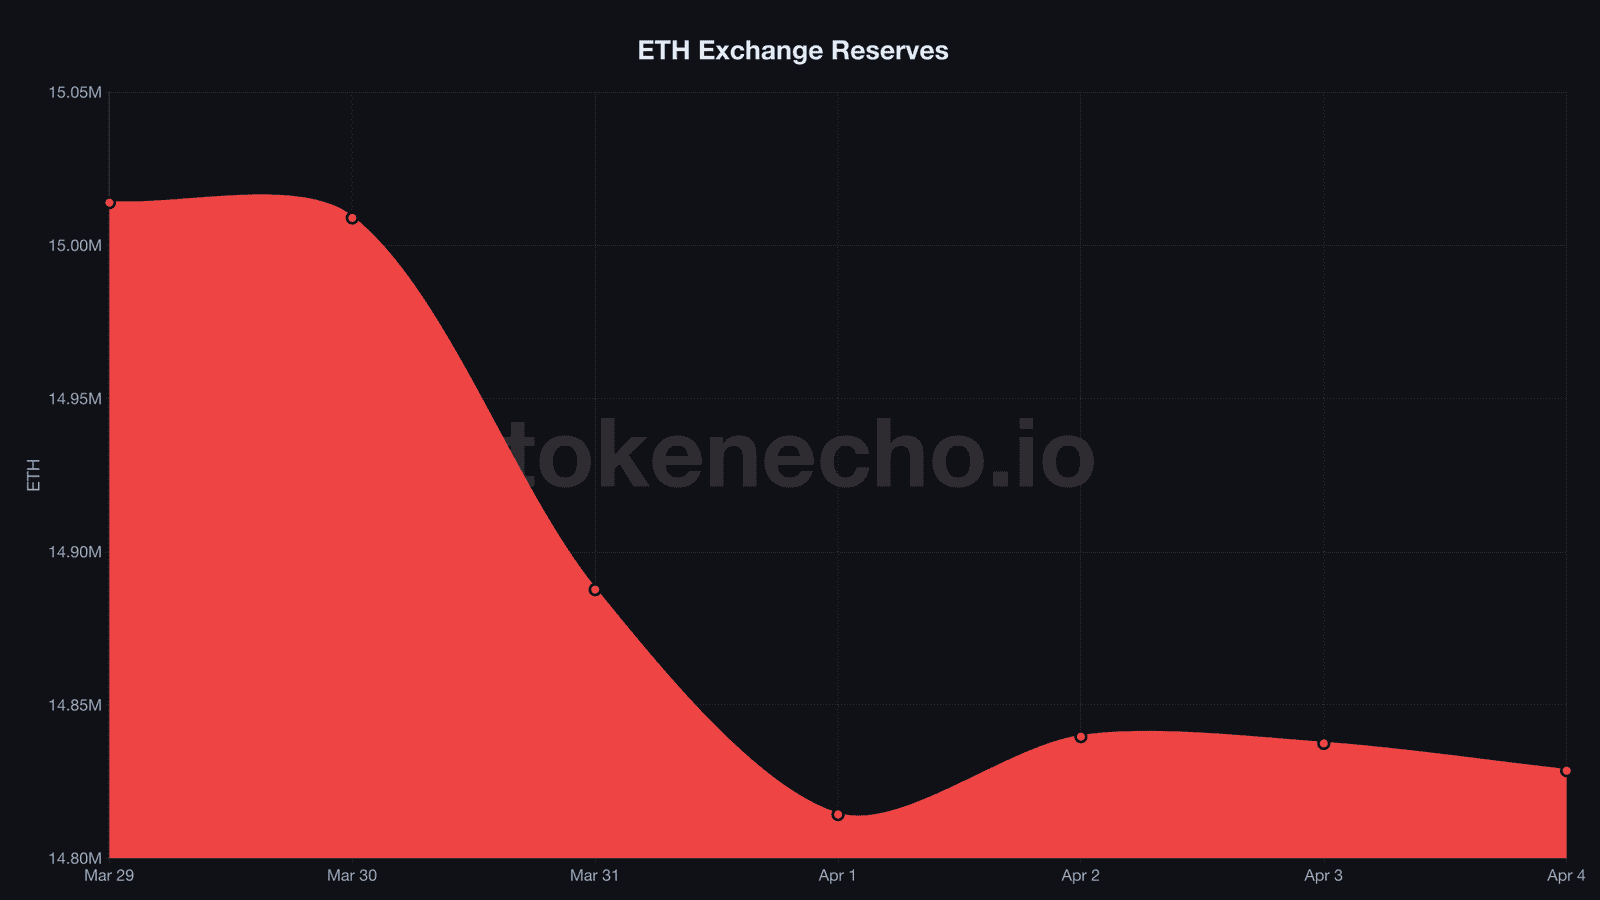
But what separates this from a standard risk-off flush? Exchange reserves kept declining through the entire deleveraging.
They didn’t bounce. Didn’t flatten. Just kept bleeding – from 14.89 million ETH on March 31 to 14.83 million by April 4.
That’s roughly 59,000 ETH drained in four days, even as the speculative market went dark.
Institutional flows tell a similar story of disconnect.
“They haven’t rebounded the way Bitcoin has, at least from a flow perspective,” said James Seyffart, Research Analyst at Bloomberg Intelligence. “People have already started buying the dip in Bitcoin – but not so much with Ethereum on the ETF side.”
The gap between ETF indifference and on-chain accumulation keeps widening.
185,000 ETH Left Exchanges This Week – Price Barely Moved
So where is 185,000 ETH going if nobody’s trading?
Over the past six days, exchange reserves dropped by 185,359 ETH. That’s roughly $379 million withdrawn to cold storage while the broader market sat on its hands.
Reserves now stand at 14.83 million ETH, their lowest point in at least seven days.
And the drain didn’t start this week. Over the past 30 days, exchanges have shed approximately 1.13 million ETH – around $2.3 billion in supply removed from the immediate trading pool, a sustained bleed that spot markets can’t ignore indefinitely.
Someone – or many someones – keeps pulling ETH off exchanges at a steady drip regardless of price.
ETH/BTC clings to 0.0305, a ratio it hasn’t visited since 2021. Dominance hovers near 10%. At $246.7 billion, Ethereum’s market cap sits roughly on par with American Express – not exactly the valuation you’d expect for the world’s largest smart contract platform.
But Luke Nolan, analyst at CoinShares, sees fundamentals pulling away from the price. “Volumes continue to grow quickly, and I do think once crypto sentiment stabilises, Ethereum could outperform [Bitcoin] in the shorter run as price catches up to ‘better’ fundamentals,” Nolan said.
One signal cuts against this accumulation narrative, though. ETH ETFs have recorded $2.76 billion in net outflows over the past four months. BlackRock’s staked ETHB fund launched strong at $155 million – but it hasn’t reversed the broader institutional exit. Until that flow reverses, the on-chain drain lacks a clear demand catalyst from the institutional side.
If exchange activity stays this depressed while reserves continue draining, the supply-demand imbalance tightens every day. Compressed volatility with declining supply has historically preceded sharp moves – the direction depends on whether the next catalyst is a macro shock or institutional re-entry.
Support sits at $2,000 and $1,850. Resistance clusters at $2,070, $2,100, and $2,150. The leverage unwind cleared out the weakest derivative positions, which makes any future rally more likely spot-driven and sustainable.
Until ETH reclaims $2,150 with volume – or loses $2,000 on heavy exchange inflows – the dead zone persists.
This analysis is part of our daily Ethereum price tracking. See all previous analyses and key metrics on our hub page.
Exchange outflows say accumulation. ETF flows say indifference. One of them is wrong – and April should settle it.
This is not financial advice. DYOR. Data as of April 5, 2026.
Leave a Reply