
🕑 6 min read
The crypto market touched panic levels not seen since Luna imploded – then quietly turned around while nobody was watching.
Eight.
That’s where the Crypto Fear & Greed Index landed on Wednesday – the lowest single reading since Terra/Luna collapsed in June 2022. Only 15 readings below 10 have ever been recorded since the index launched in 2018.
And while most of crypto Twitter spent the week doom-scrolling, the on-chain data told a completely different story.
Bitcoin ended the week at $69,854 – up 4.5% from where it started on March 31.
Ethereum outpaced it, jumping 5.6% to $2,152 in its best weekly performance since early February. Total crypto market cap bottomed at $2.37 trillion mid-week during the worst of the panic, then recovered to $2.47 trillion by Sunday afternoon.
But what caught our attention wasn’t the price recovery. It was everything happening underneath it.
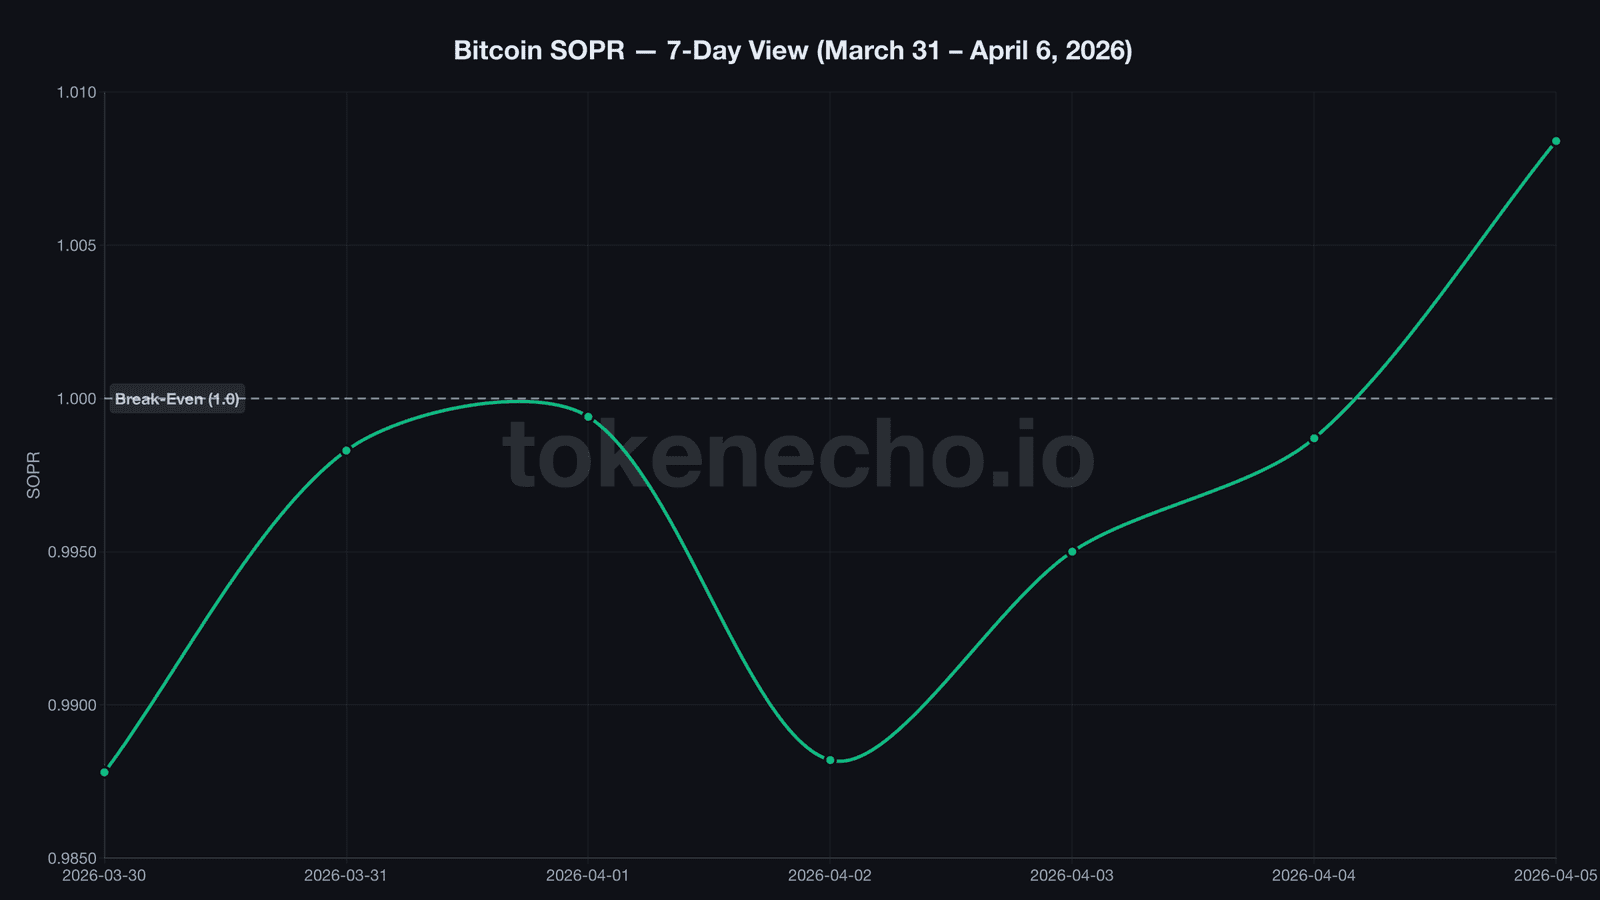
SOPR breaks above 1.0 – but the whales already started selling
Everyone expected more pain. Instead, the market quietly flipped a switch.
SOPR, the spent output profit ratio that measures whether sellers are booking profits or losses when they move coins, finally broke above 1.0 on Saturday. That 13-day streak below the break-even line was the longest since the FTX collapse in November 2022.
Back then, BTC sat at $16,000. It tripled within 90 days.
NUPL, a metric tracking aggregate unrealized profit and loss across the entire network, climbed from 0.188 to 0.215 over the week. Still uncomfortably close to capitulation territory – but trending in the right direction for the first time since early March.
So the bleeding stopped. Great.
Except the same day SOPR flipped positive, LTH-SOPR – the version tracking only long-term holders – spiked to 2.874. That’s a 187% profit margin on coins that hadn’t moved in months, possibly years.
Coin Days Destroyed, a measure of how many old dormant coins suddenly get transferred, surged 6x to 14.8 million. Smart money sat through the entire 13-day capitulation event – then sold into the first green candle.
That’s like watching everyone rush out of a burning building, then seeing the insurance adjuster quietly walk out the back door counting cash.
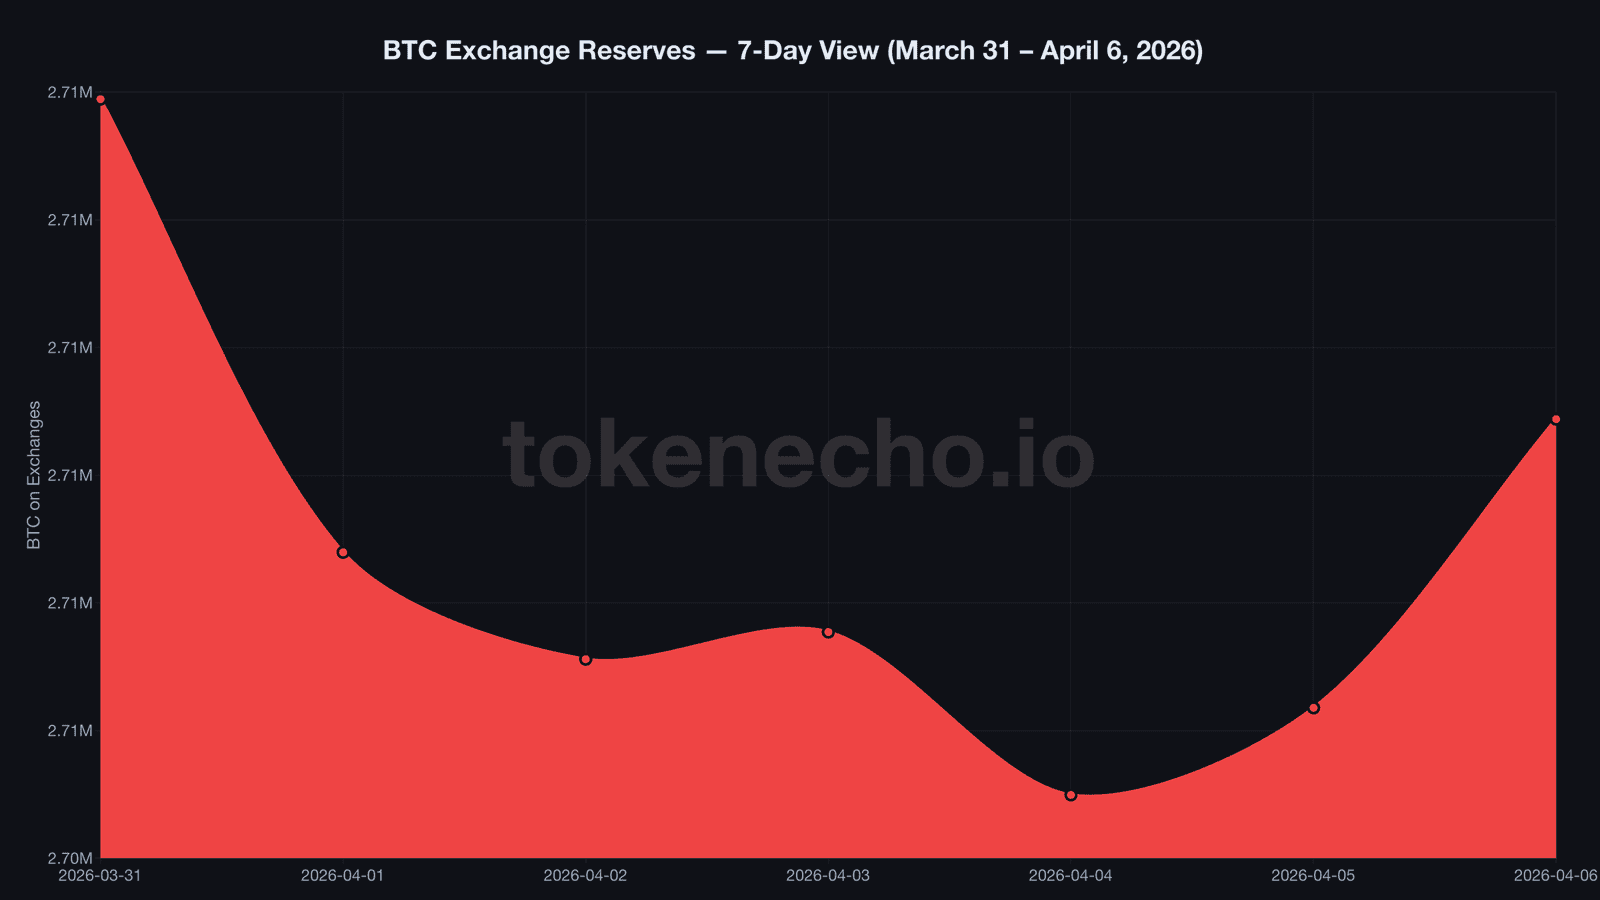
Exchange deposits crash 87% as sellers run dry
87%.
That’s how much BTC exchange deposits dropped in three days this week. And no, that’s not a typo.
Sellers didn’t just slow down – they vanished, like a store that ran out of inventory during a fire sale. BTC exchange reserves slid from 2,709,944 to 2,707,438 over the week.
That’s a net drain of about 2,500 BTC – roughly $175 million walking out the door.
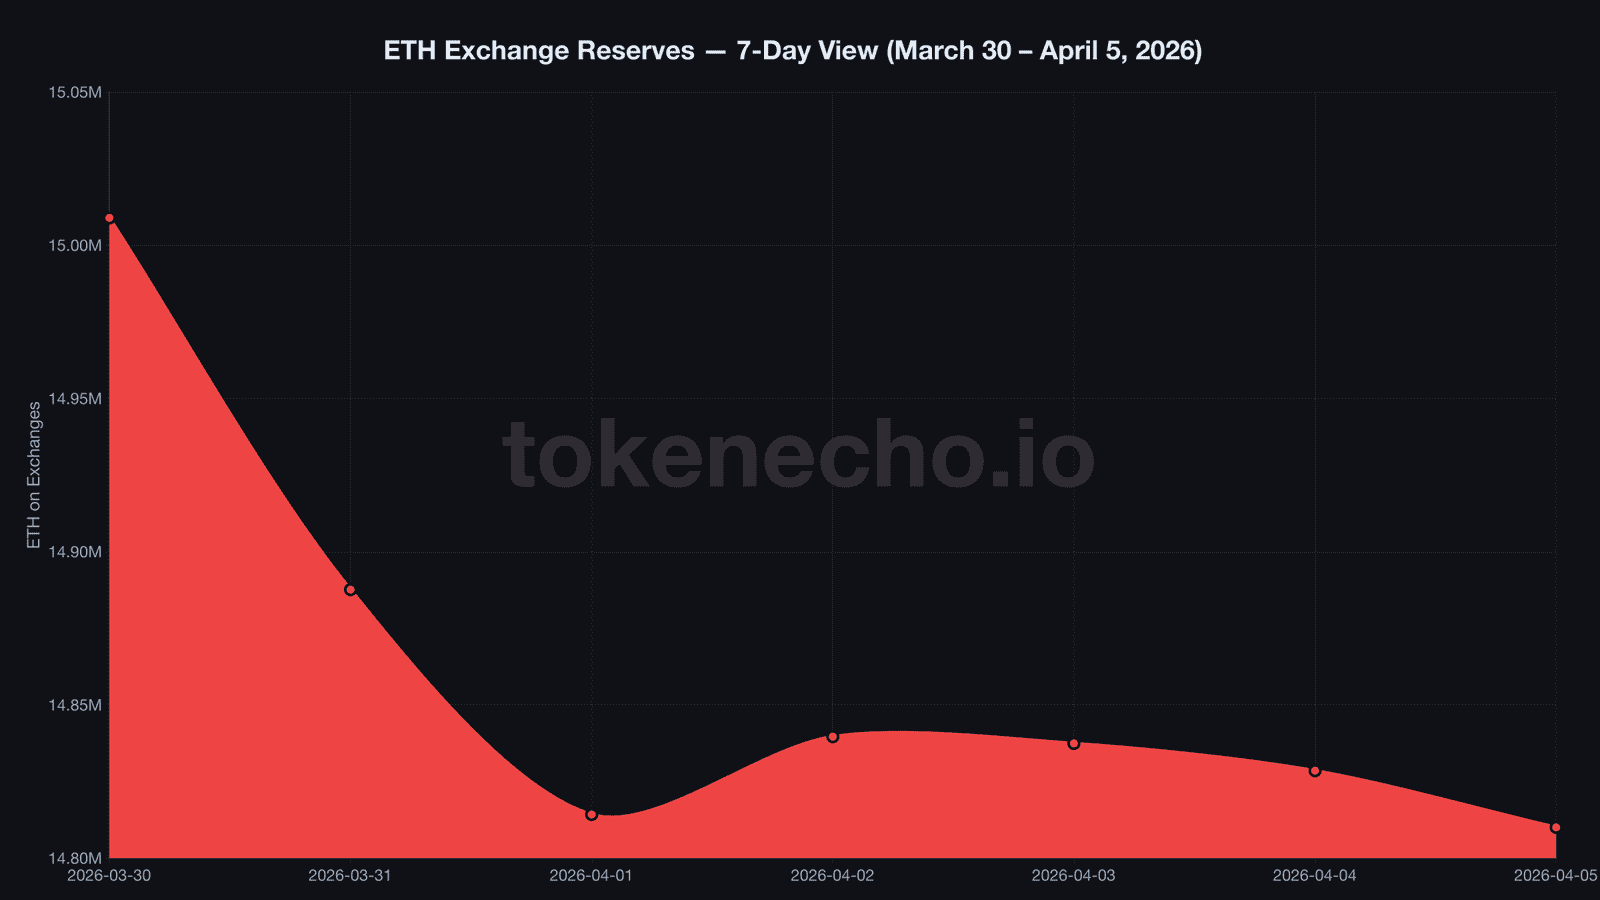
Ethereum saw an even more dramatic version. ETH trading activity collapsed 85% in four days.
Exchange deposits plunged from 1.13 million ETH daily to just 286,000. The order book dried up.
But while volume cratered, 77,584 ETH quietly left exchanges during the week. That’s $167 million in spot accumulation, done without making a sound.
Someone’s buying. They’re just not doing it loudly.
ETH open interest plunged $1.1 billion in a single day. Gone.
The drop – from $14.36 billion to $13.26 billion – wiped out the leveraged position structure entirely. Funding rates flipped from deeply negative to positive in 72 hours. What’s left looks mostly spot-driven.
For context, the last time BTC exchange deposits crashed this hard while reserves simultaneously declined was October 2023 – just before the run from $27,000 to $73,000.
$285M gone in 12 minutes – North Korea’s biggest crypto heist of 2026
Picture a Solana DeFi team waking up on April Fools’ Day to discover their protocol just lost more money than every crypto hack in Q1 combined.
That’s what happened to Drift Protocol. North Korean state-sponsored hackers – attributed by TRM Labs and Elliptic to group UNC4736 – drained $285 million in twelve minutes flat after spending six months socially engineering multisig signers, creating fake tokens with manufactured price histories on Raydium, and exploiting an oracle manipulation vulnerability that Drift’s own Security Council migration had exposed just five days earlier.
Drift’s TVL cratered from $550 million to under $300 million in less than an hour.
The broader DeFi sector held at roughly $90 billion in total value locked. But Solana’s security credibility took a hit it won’t shake off quickly.
Can a $285 million exploit actually be good for crypto? Probably not. But it accelerated conversations about multisig security, timelock requirements, and oracle design that the industry had been avoiding for months.
Japan cuts crypto tax to 20% while the U.S. argues over stablecoins
What happens when the world’s third-largest economy declares crypto a financial product?
Japan’s FSA announced plans to reclassify 105 cryptocurrencies – including Bitcoin and Ethereum – as “financial products” under the Financial Instruments and Exchange Act.
The tax rate drops from a punishing 55% to a flat 20%, with insider trading and market manipulation laws applying to crypto for the first time. Exchanges must now report reserves in near real-time.
Meanwhile across the Pacific, the CLARITY Act hit a four-way deadlock. Banks want to block stablecoins from offering deposit-like yields. Crypto firms object to bank-friendly restrictions.
Congress left for Easter recess without a vote.
‘If the bill doesn’t advance by May, digital asset legislation may not get serious consideration for years,’ said Senator Bernie Moreno – a warning that landed harder than most of the week’s on-chain data.
BTC ETF flows mirrored the indecision. BlackRock’s IBIT pulled in $98.4 million on March 31, then shed $86.5 million the very next day.
Net weekly flows barely scraped positive. ETH ETFs fared worse – bleeding $42.1 million net, extending a four-month outflow streak that’s now hit $2.76 billion total.
Traders watching the regulatory landscape will note that Japan’s 20% flat rate now makes it one of the most competitive crypto tax jurisdictions among G7 nations – while the U.S. Congress hasn’t passed a single piece of crypto legislation since FIT21 stalled in 2024.
Algorand’s 50% rally – Google, the SEC, and Revolut walk into a bar
The week’s biggest winner wasn’t Bitcoin or Ethereum.
Algorand surged 49.7% in seven days, the kind of rally nobody expected from a coin trading near its all-time low of $0.08.
By Sunday, ALGO sat at $0.1226. Google’s Quantum AI paper cited ALGO’s Falcon post-quantum cryptographic signatures 32 times.
Revolut announced ALGO staking for its 70 million users. And the SEC/CFTC commodity recognition from March gave it the regulatory green light.
Three unrelated tailwinds hitting the same tiny-cap coin in the same week. Sometimes the market just does that.
ALGO is still down 96.5% from its $3.56 all-time high.
At an FDV of just $1.09 billion, the rally looks impressive on a 7-day chart. Zoom out, and it’s a rounding error.
| Asset | Price (Apr 6) | Weekly Change | Key Metric |
|---|---|---|---|
| BTC | $69,854 | +4.5% | SOPR broke 1.0 after 13 days |
| ETH | $2,152 | +5.6% | 77,584 ETH left exchanges |
| XRP | $1.35 | -0.5% | Flat despite market rally |
| SOL | $82.55 | -2.3% | Drift hack weighed on sentiment |
| DOGE | $0.09 | -0.2% | Range-bound |
| ADA | $0.26 | +2.8% | Modest recovery |
| ALGO | $0.12 | +49.7% | Google quantum + Revolut staking |
| Total MC | $2.47T | +1.6% | Recovered from $2.37T mid-week low |
| BTC Dom. | 56.6% | Stable | Flight-to-quality held |
| Fear & Greed | 13 | From low of 8 | Lowest since Terra/Luna (June 2022) |
For our latest analysis, see the Bitcoin price analysis and Ethereum price analysis hub pages.
SOPR just snapped 13 days of bleeding, but the whales who waited out the entire capitulation are already selling into the rally. Whether this week’s seller exhaustion holds through Q2 – or turns out to be a dead cat bounce while smarter money heads for the exits – is the question that defines April.
This is not financial advice. DYOR. Data as of April 6, 2026.
Sources
- CoinGecko API – prices, market cap, supply, 7d/30d changes
- CryptoQuant API – SOPR, MVRV, NUPL, exchange reserves, netflow, leverage ratio, CDD
- TRM Labs – Drift Protocol North Korea attribution report
- Japan FSA – Financial Instruments and Exchange Act amendment announcement
- CoinReporter – CLARITY Act four-way deadlock coverage
- Farside Investors – Bitcoin and Ethereum ETF daily flow data
Leave a Reply