Total market cap, dominance rankings, chain breakdown, on-chain indicators, and regulation tracker — updated weekly with CoinGecko and CryptoQuant data.
Last update: April 6, 2026
Over $303 billion sits in stablecoins right now. That’s more than Finland’s GDP, parked in digital dollars across a dozen blockchains — and most of it isn’t moving.
The stablecoin sector commands 12.3% of the entire crypto market cap. Two years ago, it was half this size. Institutional demand for on-chain settlement, cross-border payments, and DeFi collateral has turned what started as a trading convenience into something that resembles critical financial plumbing.
This page tracks it all. Market cap rankings, dominance shifts, the Stablecoin Supply Ratio (a measure of how much buying power stablecoins hold relative to Bitcoin), chain-level data, and regulatory developments. We update every Monday with verified API data.
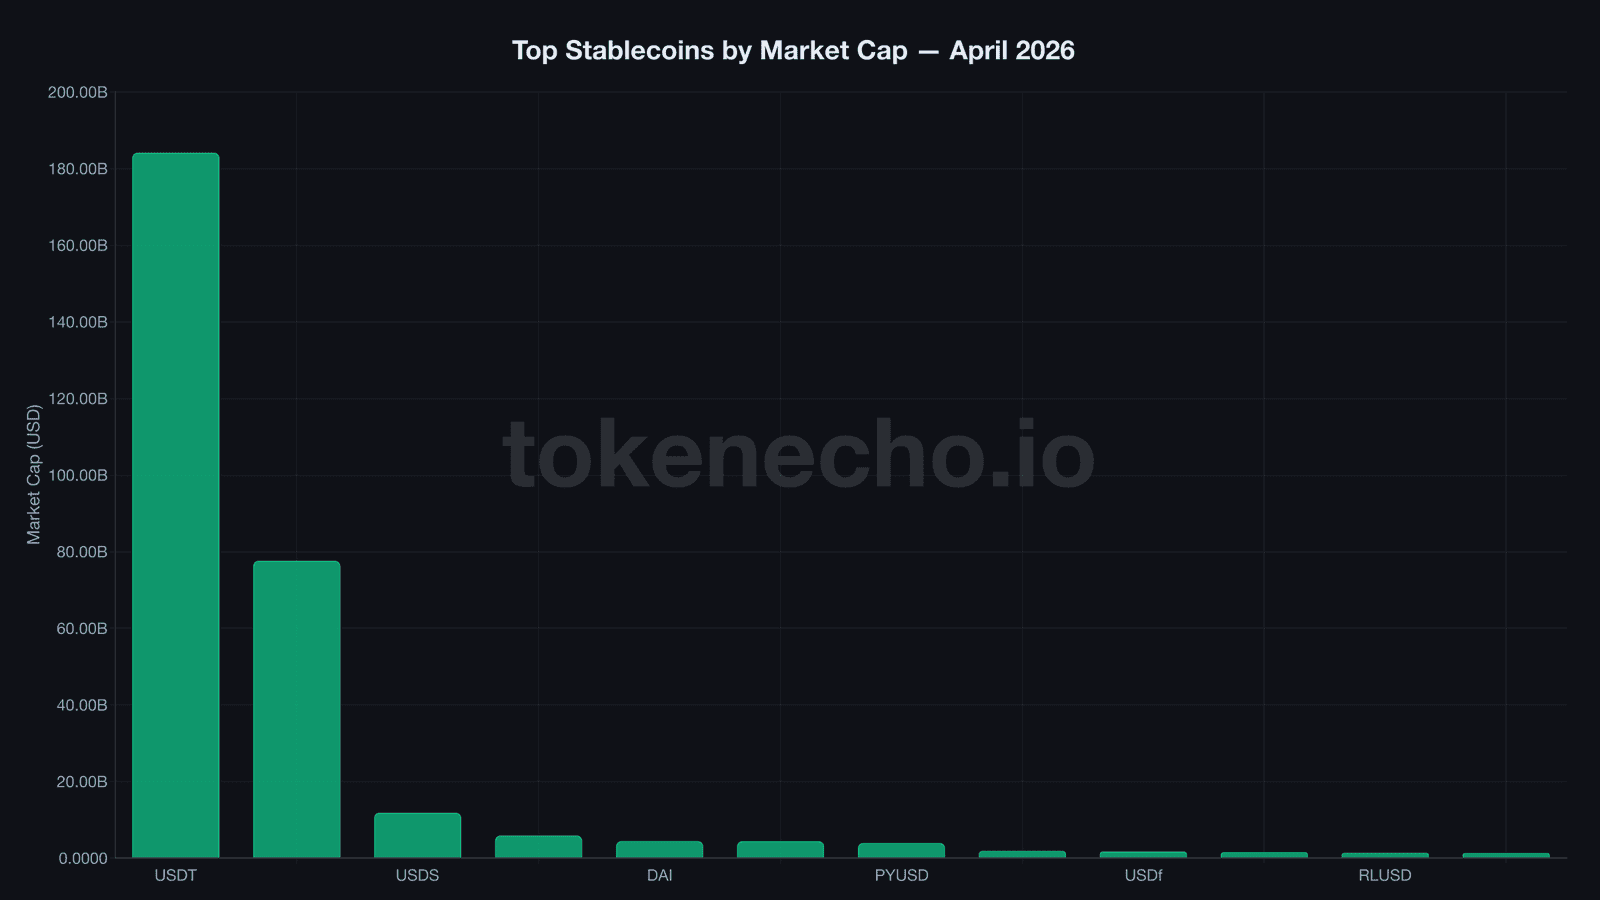
Top stablecoins ranked — and who’s gaining ground
| Rank | Stablecoin | Ticker | Market Cap | Share | Type | 24h Volume |
|---|---|---|---|---|---|---|
| 1 | Tether | USDT | $184.1B | 60.6% | Fiat-backed | $64.8B |
| 2 | USDC | USDC | $77.6B | 25.6% | Fiat-backed | $10.8B |
| 3 | USDS | USDS | $11.8B | 3.9% | Crypto-backed | $160M |
| 4 | Ethena USDe | USDe | $5.9B | 1.9% | Synthetic | $79M |
| 5 | Dai | DAI | $4.4B | 1.5% | Crypto-backed | $55M |
| 6 | USD1 | USD1 | $4.4B | 1.5% | Fiat-backed | $909M |
| 7 | PayPal USD | PYUSD | $3.9B | 1.3% | Fiat-backed | $262M |
| 8 | Global Dollar | USDG | $1.9B | 0.6% | Fiat-backed | $52M |
| 9 | Falcon USD | USDf | $1.7B | 0.6% | Synthetic | $832K |
| 10 | USDD | USDD | $1.5B | 0.5% | Algorithmic | $7.5M |
| 11 | Ripple USD | RLUSD | $1.4B | 0.4% | Fiat-backed | $87M |
| 12 | BFUSD | BFUSD | $1.3B | 0.4% | Synthetic | $1.6M |
Twelve stablecoins above $1 billion. Seven of them didn’t exist two years ago.
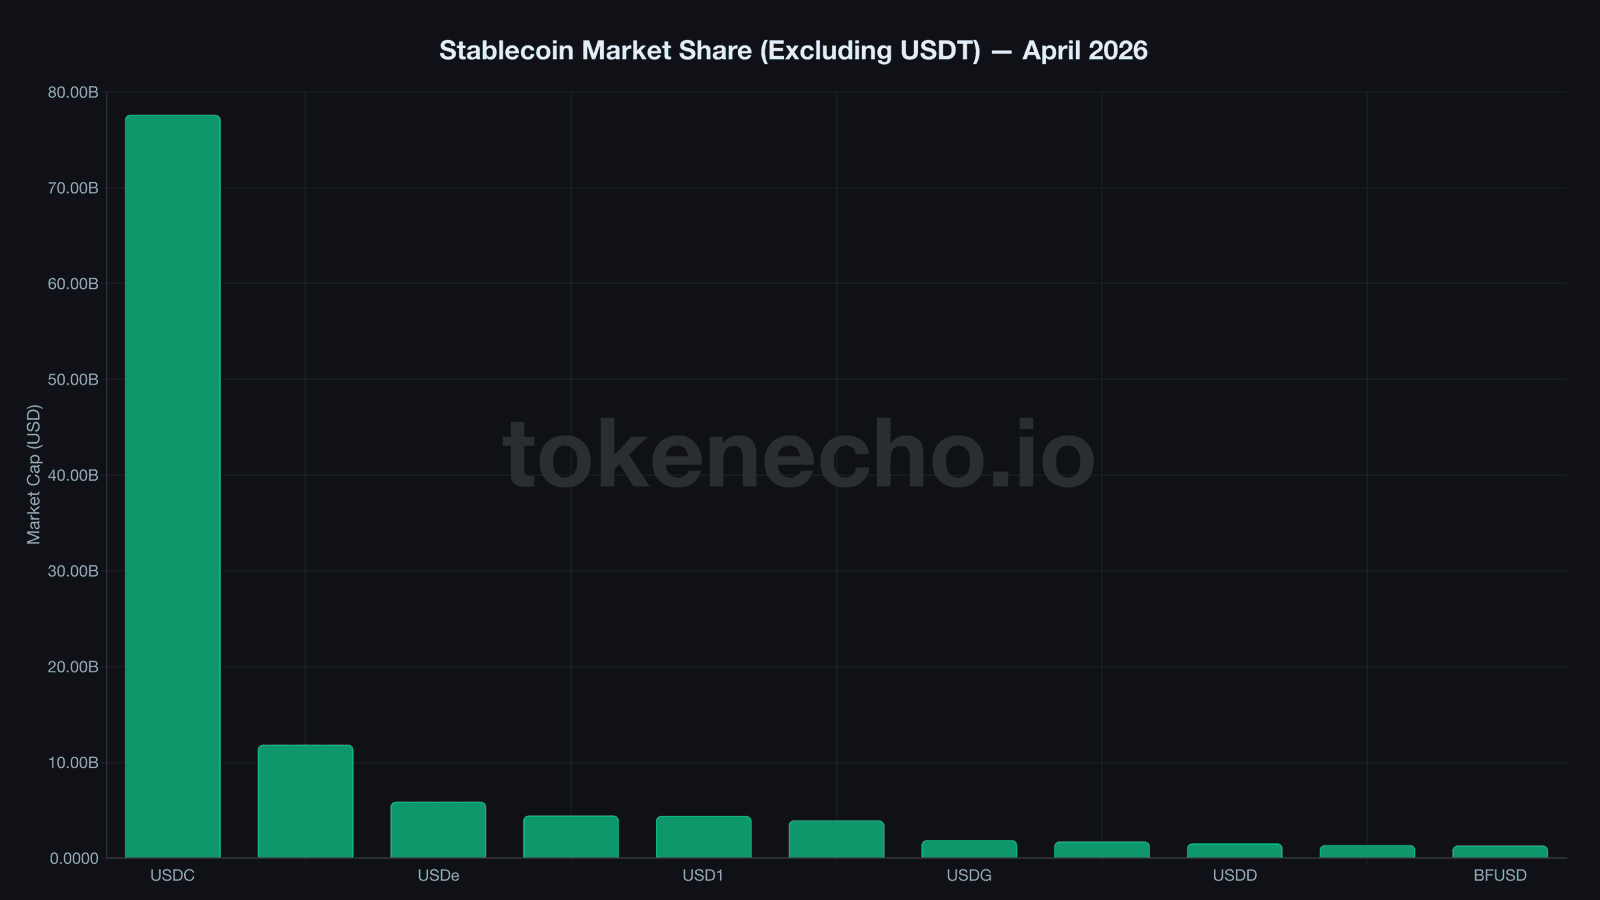
The duopoly cracks — new players capture $11B in share
USDT’s 60.6% dominance looks unshakeable. It isn’t.
In early 2024, Tether controlled 72% of the stablecoin market. USDC held most of the rest. Today, that combined grip has loosened to 86% — and the erosion is accelerating.
The insurgents aren’t small. Trump’s USD1 — backed by World Liberty Financial — went from zero to $4.4 billion in under a year, making it the fastest stablecoin launch in history. PayPal’s PYUSD quietly hit $3.9 billion with 400 million potential users in its ecosystem. Ripple’s RLUSD crossed $1.4 billion. Even Paxos spun up USDG at $1.9 billion.
“The stablecoin market is fragmenting along institutional lines,” said Jeremy Allaire, Circle’s CEO, during the company’s CRCL IPO roadshow. He’s right — but Circle is part of the problem it’s describing.
As we covered in early April, USDC lost $1.4 billion in exchange reserves in just 10 days while USD1 gained $1.1 billion. That’s not a trend. That’s a regime change.
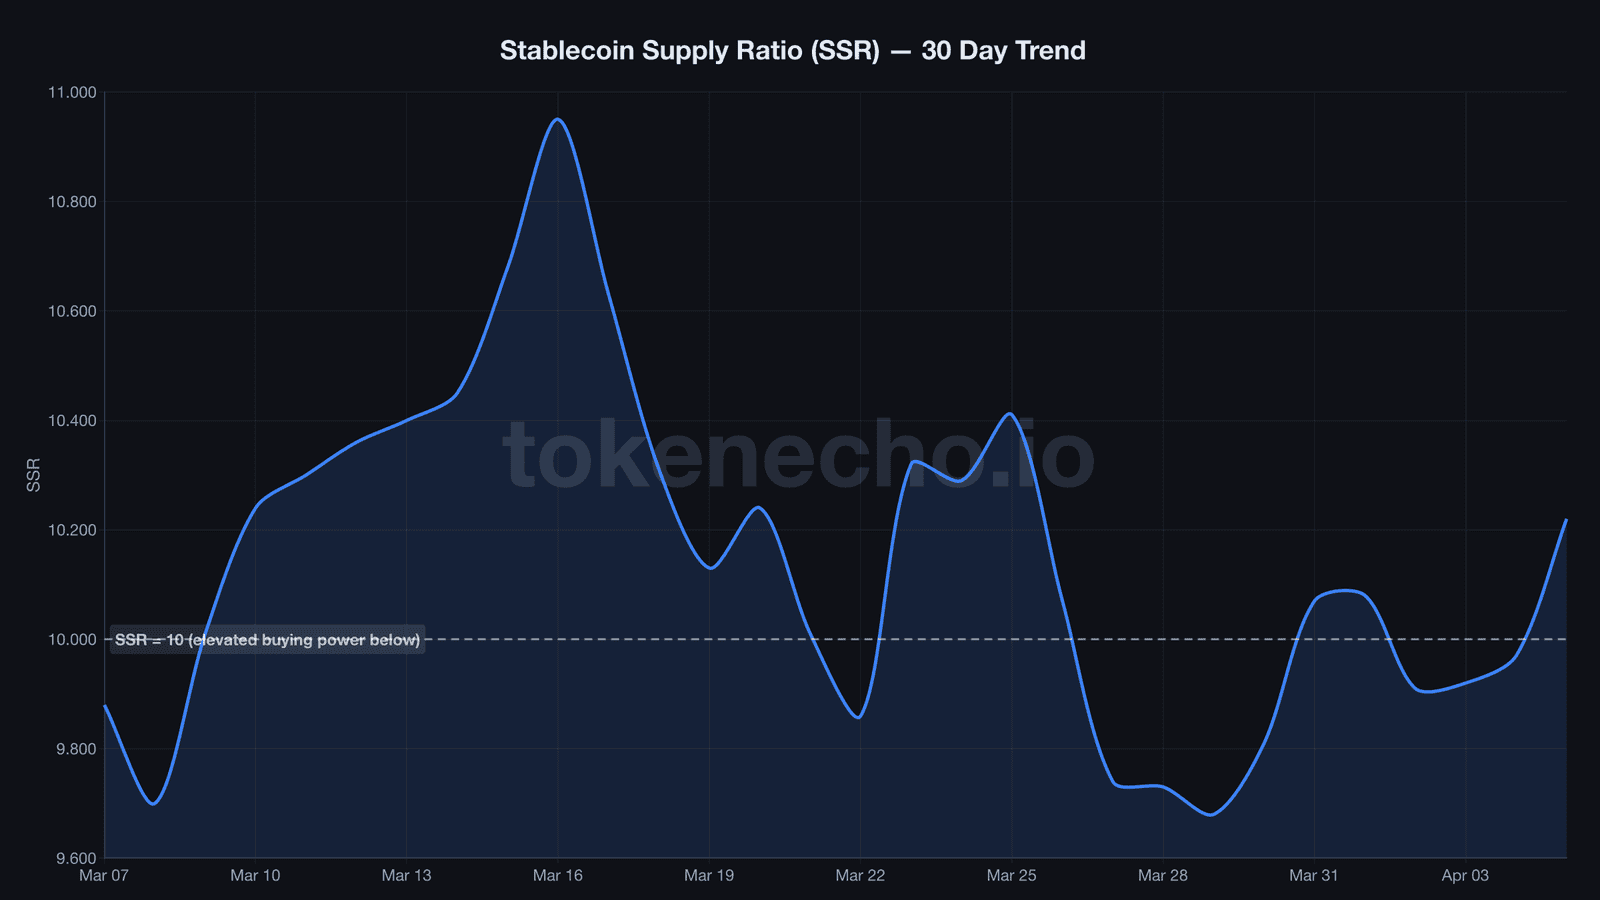
Stablecoin Supply Ratio — $139B in dry powder, still parked
SSR, the Stablecoin Supply Ratio, measures Bitcoin’s market cap relative to total stablecoin supply. Lower values mean more stablecoin firepower per dollar of BTC — more fuel parked on the sidelines, waiting.
| Date | SSR | 7d Change | Signal |
|---|---|---|---|
| April 5, 2026 | 10.22 | +4.2% | Neutral — moderate buying power |
| March 29, 2026 | 9.68 | — | Elevated — significant dry powder |
| March 22, 2026 | 9.86 | — | Elevated — post-crash accumulation zone |
| March 8, 2026 | 9.70 | — | Elevated — pre-correction levels |
SSR bottomed at 9.68 on March 29 — the lowest reading in weeks — then climbed to 10.22 as BTC recovered from $66K to $69K. During that selloff, roughly $139 billion in stablecoins sat on the sidelines while Bitcoin bled 20% from its highs.
So why hasn’t it moved? Most of that capital still hasn’t deployed. SSR below 10 has historically preceded significant buying pressure. The current 10.22 sits right at the edge — not screaming “buy,” but not walking away either.
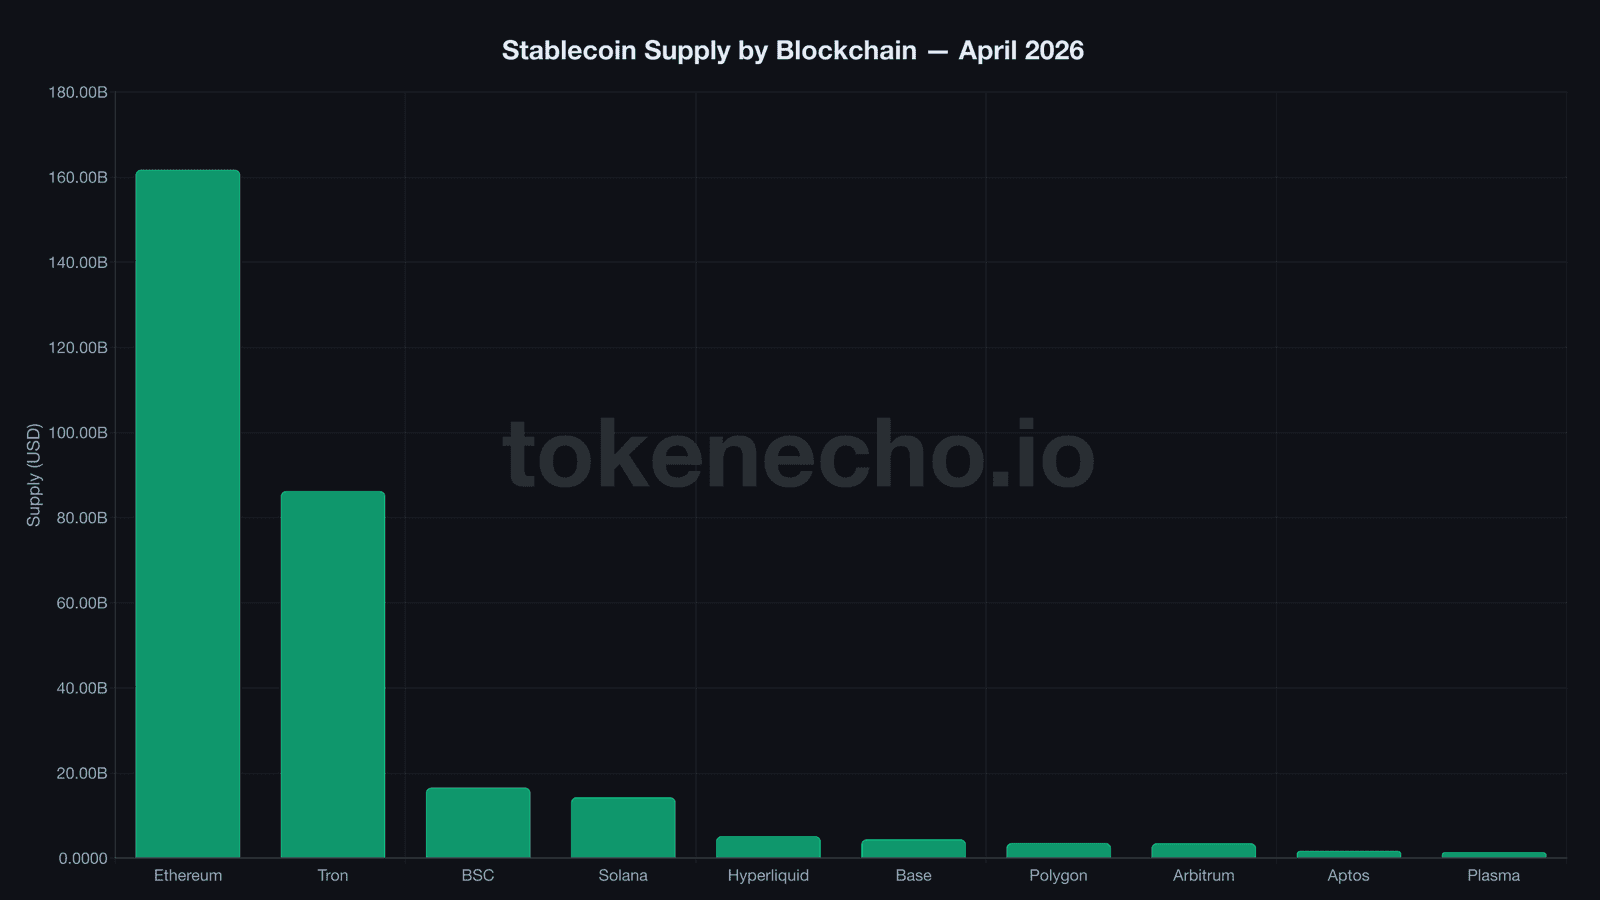
Where stablecoins live — the chain breakdown
Ethereum is the vault. Solana is the highway. Tron is the remittance wire. And Base is the dark horse nobody saw coming.
Each chain serves a different stablecoin function, and the capital allocation reflects that. Ethereum holds $161.7 billion in stablecoin supply — more than half the total market — anchored by DeFi protocols that demand deep liquidity pools. But raw reserves don’t tell the whole story.
Tron sits at $86.2 billion, mostly in USDT serving emerging-market remittances. And Solana? It holds just $14.3 billion in supply but processes $650 billion in stablecoin volume monthly — a 42x velocity advantage over Ethereum. The money doesn’t sit on Solana. It moves.
Ethereum holds the largest reserves by far — anchored by DeFi protocols that need deep liquidity, lending markets that lock collateral for months, and derivatives platforms where stablecoins serve as margin — but Solana’s 42x velocity advantage shows that where money sits and where money moves are two very different things.
| Chain | Stablecoin Supply | Primary Role | Key Stablecoins |
|---|---|---|---|
| Ethereum | $161.7B | DeFi collateral, settlement | USDT, USDC, DAI, USDe |
| Tron | $86.2B | Remittances, emerging markets | USDT |
| BSC | $16.6B | Retail trading | USDT, FDUSD |
| Solana | $14.3B | Payments, high-speed trading | USDC, PYUSD |
| Hyperliquid | $5.2B | Perp DEX settlement | USDC |
| Base | $4.4B | Retail, Coinbase ecosystem | USDC |
| Polygon | $3.6B | Gaming, micro-payments | USDT, USDC |
| Arbitrum | $3.5B | DeFi, L2 trading | USDT, USDC |
Four types, four risks — a quick stablecoin taxonomy
Not every dollar-pegged token works the same way. The backing mechanism determines everything — ask anyone who held UST in May 2022 and watched $40 billion evaporate in 72 hours.
Fiat-backed (USDT, USDC, PYUSD, USD1, RLUSD)
Each token is redeemable for actual dollars, Treasury bills, or equivalent reserves held by the issuer. It’s the simplest model and the most trusted — but it requires trusting the issuer’s attestations. Tether’s reserve composition has been questioned for years. Circle publishes monthly attestations audited by Deloitte. PayPal holds reserves at State Street.
Crypto-backed (DAI, USDS)
Overcollateralized with crypto assets. Deposit $150 in ETH, mint $100 in DAI. More decentralized than fiat-backed alternatives, but capital-inefficient. And during Black Thursday in March 2020, liquidation cascades nearly broke DAI’s peg when ETH crashed 43% in hours.
Synthetic / Delta-neutral (USDe, BFUSD, USDf)
These use short perpetual futures positions to hedge the collateral’s price exposure. Capital-efficient and often yield-bearing — Ethena’s USDe offered double-digit yields during the bull market. But funding rates can flip negative for extended periods, eating into reserves. Smart contract risk compounds the problem.
Algorithmic (USDD)
Protocol mechanisms maintain the peg without full collateral backing. The riskiest category by far. Luna/UST’s collapse proved that algorithmic stability is an oxymoron under stress. USDD now maintains overcollateralization as a safeguard — essentially admitting the original premise doesn’t work.
The lesson from 2022 still applies: the more complex the peg mechanism, the more ways it can break.
Regulation moves faster than the market itself
For the first time, regulators are writing stablecoin-specific laws — not retrofitting securities frameworks.
| Jurisdiction | Legislation | Status | Key Provisions |
|---|---|---|---|
| United States | GENIUS Act | Committee passed, Senate floor pending | Federal licensing, reserve requirements, consumer protections |
| United States | CLARITY Act | Passed House vote, March 2026 | RWA tokenization framework, stablecoin yield rules |
| European Union | MiCA | Fully effective since June 2024 | 1:1 reserve mandate, €200M daily cap for non-EU stablecoins |
| UAE / Dubai | VARA framework | Active | Licensed stablecoin issuance, AED-pegged products |
| Japan | PSA Amendment | Active | Bank-issued stablecoins only, 100% deposit backing |
The U.S. remains the biggest wildcard. The GENIUS Act would create the first federal licensing framework for stablecoin issuers — but the political entanglement with USD1, backed by a sitting president’s family, has complicated the timeline. Whether that conflict accelerates or stalls the legislation will define the regulatory landscape for years.
Latest stablecoin analysis from TokenEcho
- USDC lost $1.4B in 10 days while Trump’s USD1 gained $1.1B — the stablecoin map is being redrawn — April 1, 2026
- Solana processes $650B in stablecoins monthly — more than Ethereum — with just 5% of supply — March 27, 2026
- Inside Trump’s crypto empire: a $3.3B stablecoin, a 95% crash, and a $7M dinner — March 23, 2026
- Stablecoin market hits record $320B as USDC captures 64% of transaction volume — March 23, 2026
What to read next
- What are stablecoins? A complete explainer covering types, risks, and real-world use cases (coming soon)
- USDT vs USDC: Which stablecoin should you actually use? (coming soon)
- How stablecoins work: Backing, reserves, and what happens during a depeg (coming soon)
- Stablecoin regulation 2026: GENIUS Act, MiCA, and what’s next (coming soon)
How this page is built
Every number on this page comes from verified API sources. Market caps and volumes: CoinGecko API. On-chain indicators like SSR: CryptoQuant API. Chain breakdowns: DefiLlama API. We don’t scrape headlines or use secondhand data.
We update this page every Monday with fresh numbers. If something doesn’t have a source, it doesn’t belong here.
The stablecoin market keeps shifting — last week’s dominance chart is already outdated. That’s exactly why this page exists.
This is not financial advice. Always do your own research. Data as of April 6, 2026.