
🕑 5 min read
A three-day on-chain reversal exposes the ceasefire bounce as an exit window — not a recovery signal.
Bitcoin climbed $5,000 last week. Everybody cheered.
But the people who’d been holding BTC the longest — through COVID, through Luna, through FTX — weren’t cheering. They were leaving.
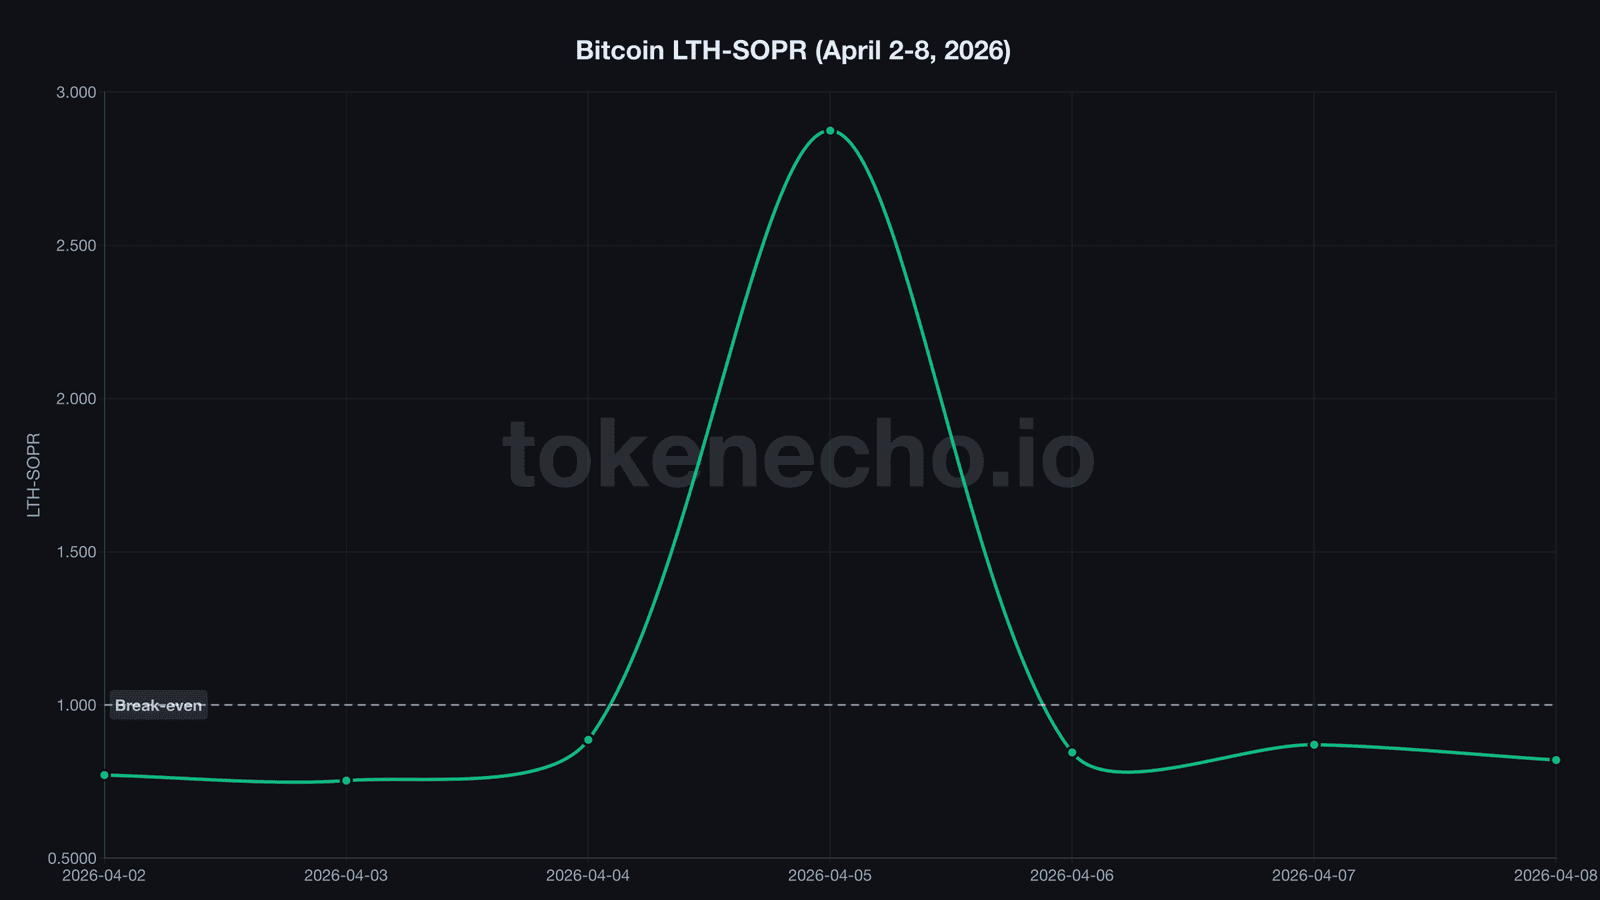
On April 5, long-term Bitcoin holders sold coins at an average profit of 187%. Three days later, that same group was locking in 18% losses. The gap between those two numbers tells you everything about who really won the Iran ceasefire rally — and who got stuck with the bags.
Old coins worth 187% profit vanished in a single session
2.874.
That’s the LTH-SOPR, a metric measuring the profit-or-loss ratio of coins held longer than 155 days when they’re finally spent, on April 5. At that level, the average long-term holder who sold was sitting on nearly triple their original cost basis.
These were likely coins bought around $24,000 during the 2020 accumulation phase. Untouched for years — until Saturday.
The timing wasn’t accidental. Hours earlier, Washington and Tehran agreed to a two-week ceasefire, the first pause since fighting escalated in early 2026. BTC jumped from $66,000 to $69,000 in a single session, and the exit door swung wide open.
Morgan Stanley’s MSBT Bitcoin ETF launched that same week at a 0.14% expense ratio — undercutting BlackRock’s IBIT by nearly half. Smart money had two catalysts and a clean path out.
CDD, which tracks the cumulative “age” of all coins moved on a given day, spiked to 14.8 million. That’s a 6x surge from the day before, confirming that very old coins — the kind early adopters and institutional holders sit on for years — were finally on the move.
Someone saw the lifeboat. And they climbed in calmly, at 187% profit, while steerage was still being told the ship was fine.
Three days later, long-term sellers bled 18% — and CDD went silent
The last time LTH-SOPR crashed from profit-taking to deep loss-making this fast was November 2022. BTC sat at $16,000 back then. It tripled within six months.
But there’s a critical difference between now and the FTX bottom.
By April 8, LTH-SOPR had cratered to 0.820. And no, that’s not a rounding error. The average long-term holder selling on Tuesday was eating an 18% loss on coins they’d held for months — or years.
What caught our attention wasn’t the number itself. It was the velocity. From 2.874 to 0.820 in 72 hours. We’ve tracked this metric through every cycle inflection since 2018 — from the December bottom through the Luna collapse through the FTX aftermath and every dead-cat bounce in between — and a swing that violent almost never shows up outside of full-blown capitulation events.
CDD collapsed right behind it. From the 14.8 million spike on Saturday to just 4.3 million by Tuesday — a 71% drop. The old coins went dark. Whatever needed to be sold had been sold.
Meanwhile, overall SOPR, the broader version capturing profit and loss across all holder cohorts, barely crossed above 1.0 for the first time in 13 days. It touched 1.005 on April 8.
That’s the thinnest break-even cross in months. One bad session and it’s back underwater.
‘This bull cycle is over for now. Expecting 6-12 months of bearish or sideways price action,’ said Ki Young Ju, CEO of CryptoQuant, earlier this cycle on X. The LTH data isn’t exactly proving him wrong.
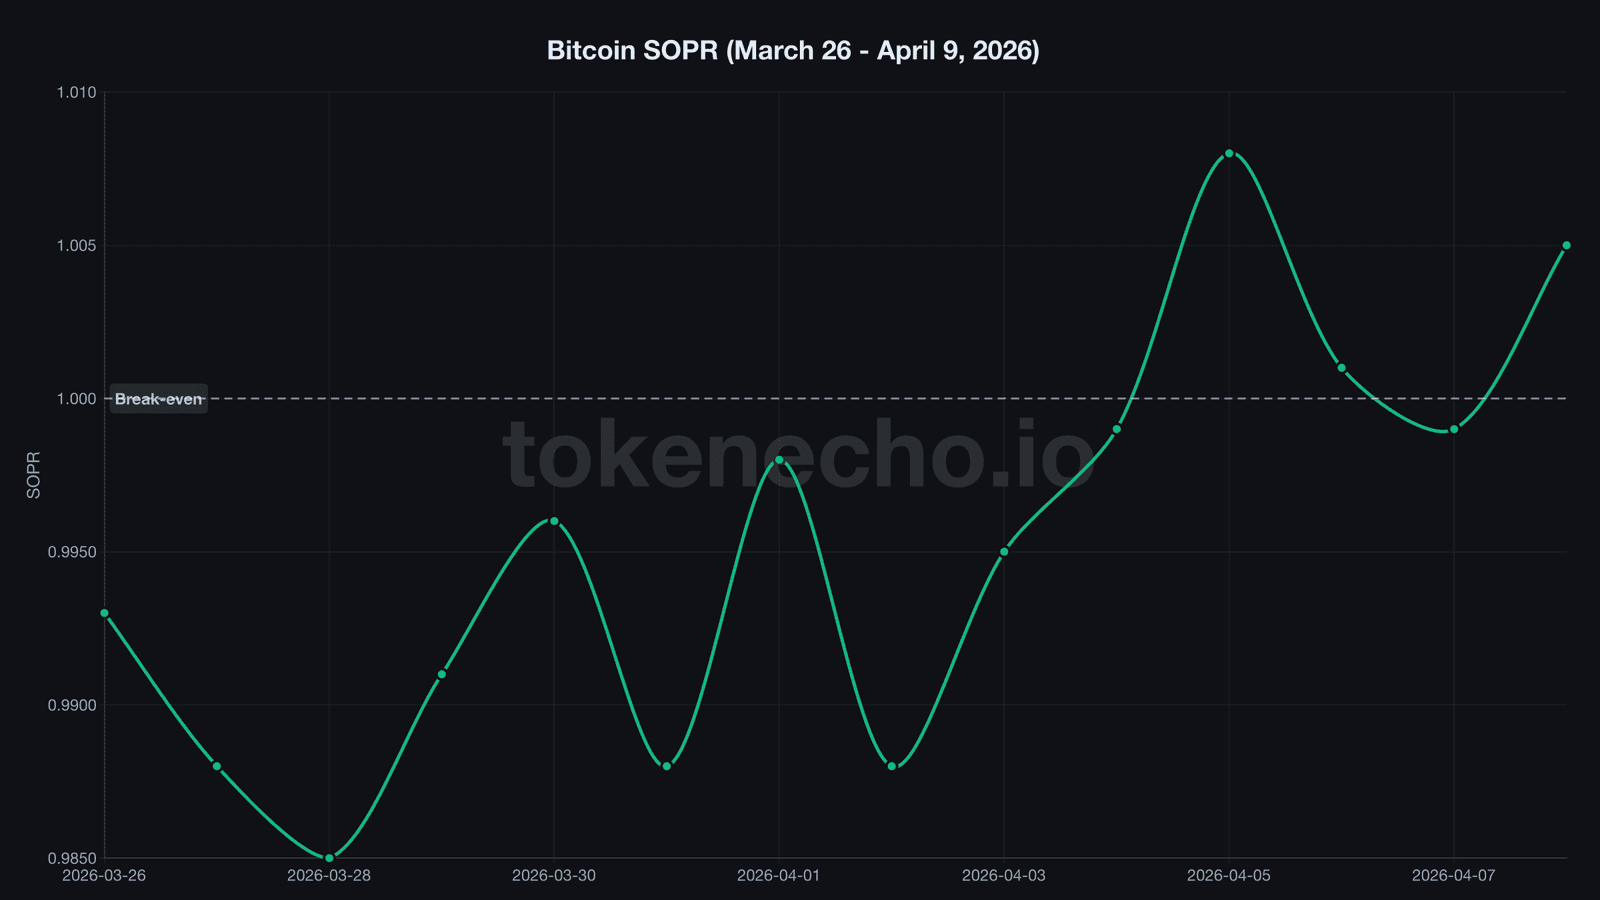
For context, the last time SOPR spent 13+ consecutive days below 1.0 and then barely scraped break-even, it slipped right back under within 48 hours. Holding above 1.0 for a single session doesn’t flip the trend — it takes a sustained week at minimum.
The profitable holders already walked through the exit. The question now is what happens when only the underwater crowd remains.
$308M in ETH floods back to exchanges as the rally stalls
So who’s actually buying at $71,000?
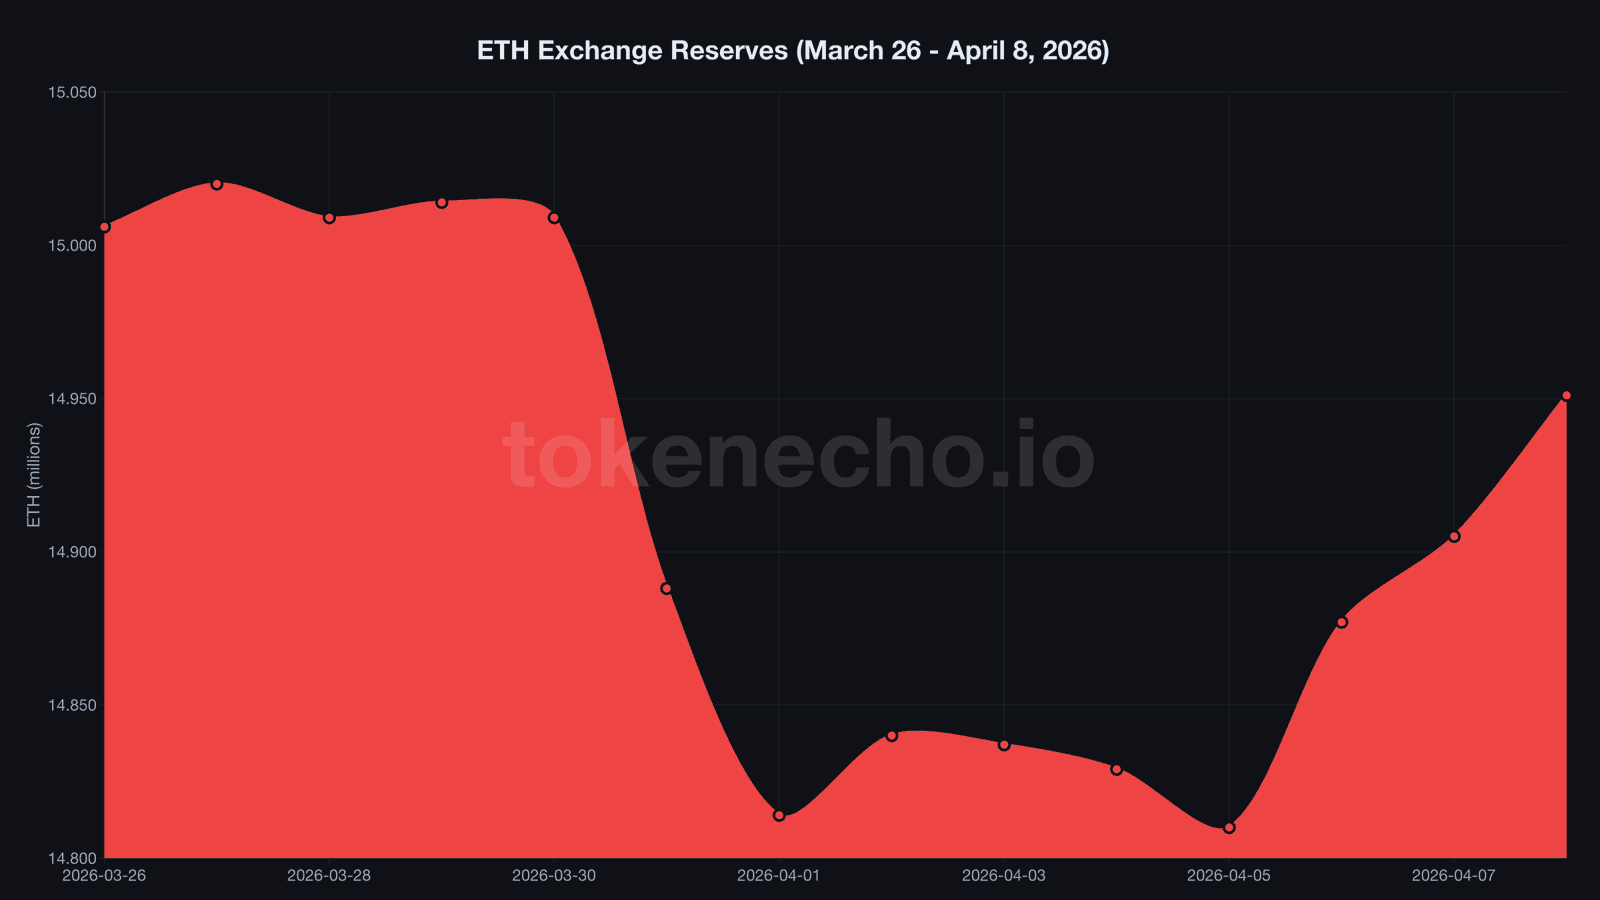
Not Ethereum holders, apparently. After a 30-day outflow streak that drained 1.19 million ETH — roughly $2.4 billion — from exchange wallets, the trend just snapped.
Between April 6 and 8, a combined 141,000 ETH poured back into exchange hot wallets. That’s $308 million at current prices, reversing the supply squeeze narrative in three sessions flat.
BTC exchange netflows aren’t any cleaner. On April 7, 3,157 BTC left exchanges — encouraging on the surface.
Then 2,109 BTC rushed right back in the next day. It’s a tug-of-war, and tug-of-wars at $71K aren’t what breakouts look like.
Trump’s latest tariff gambit doesn’t help the picture. Hours after brokering the ceasefire that sparked the rally, he threatened 50% tariffs on all goods from any country supplying weapons to Iran. China and Russia sit squarely in the crosshairs, though legal enforceability remains murky — the Supreme Court struck down his IEEPA tariff authority back in February.
NUPL, a gauge of aggregate unrealized profit and loss across the network, sits at 0.238. It’s clawing back from the 0.178 capitulation zone it scraped in late March — but 0.5+ conviction territory is still a distant planet.
Fear & Greed has been parked at Extreme Fear for 48 consecutive days. That’s the longest streak since FTX.
One constructive signal deserves mention, though. Miner reserves held dead flat at 1,804,944 BTC across the entire two-week window.
Despite the Puell Multiple, a ratio comparing daily miner revenue to its yearly average, dipping as low as 0.571 — meaning miners earned 43% below normal — they didn’t sell a single coin. Diamond hands from the people closest to Bitcoin’s production cost isn’t nothing. It might even be the most bullish datapoint hiding inside an otherwise grim picture.
If LTH-SOPR stabilizes above 1.0 while exchange reserves resume their decline, the setup begins to rhyme with the post-FTX recovery of early 2023. But until SOPR holds above break-even for more than a single session — and the Fear & Greed index escapes its 48-day prison — the ceasefire rally looks more like a fire sale than a foundation.
This analysis is part of our daily Bitcoin price tracking. See all previous analyses and key metrics on our hub page.
The 187% profit-takers already left. The holders who survived FTX, Luna, and COVID are selling at losses again. Which side of this trade ends up right will define Q2.
This is not financial advice. DYOR. Data as of April 9, 2026.
Sources
- CryptoQuant API: LTH-SOPR, SOPR, CDD, NUPL, MVRV, exchange reserves, netflow, miner reserves, Puell Multiple (accessed April 9, 2026)
- CoinGecko API: BTC price $71,009, ETH price $2,182, market data (accessed April 9, 2026)
- CryptoQuant API: ETH exchange reserves and netflow data (accessed April 9, 2026)
Leave a Reply