
🕑 5 min read
For three straight days, sellers threw $309 million worth of ETH at the market.
The price didn’t flinch.
Ethereum trades at $2,217 as of Thursday morning – up 1.7% in 24 hours, 7.6% on the week, and sitting comfortably above the $2,200 level that everyone expected to crack. But the real story isn’t price. It’s what’s happening on-chain: average exchange deposit sizes plunged 70% from their April 6 peak, a collapse so sharp it suggests the whales simply ran out of ETH to dump. Short sellers paid even more dearly – $274 million in liquidations over 24 hours. And derivatives markets flipped to net buying for the first time since 2023.
Something structural changed this week.
Whale deposits collapsed – the timing says everything
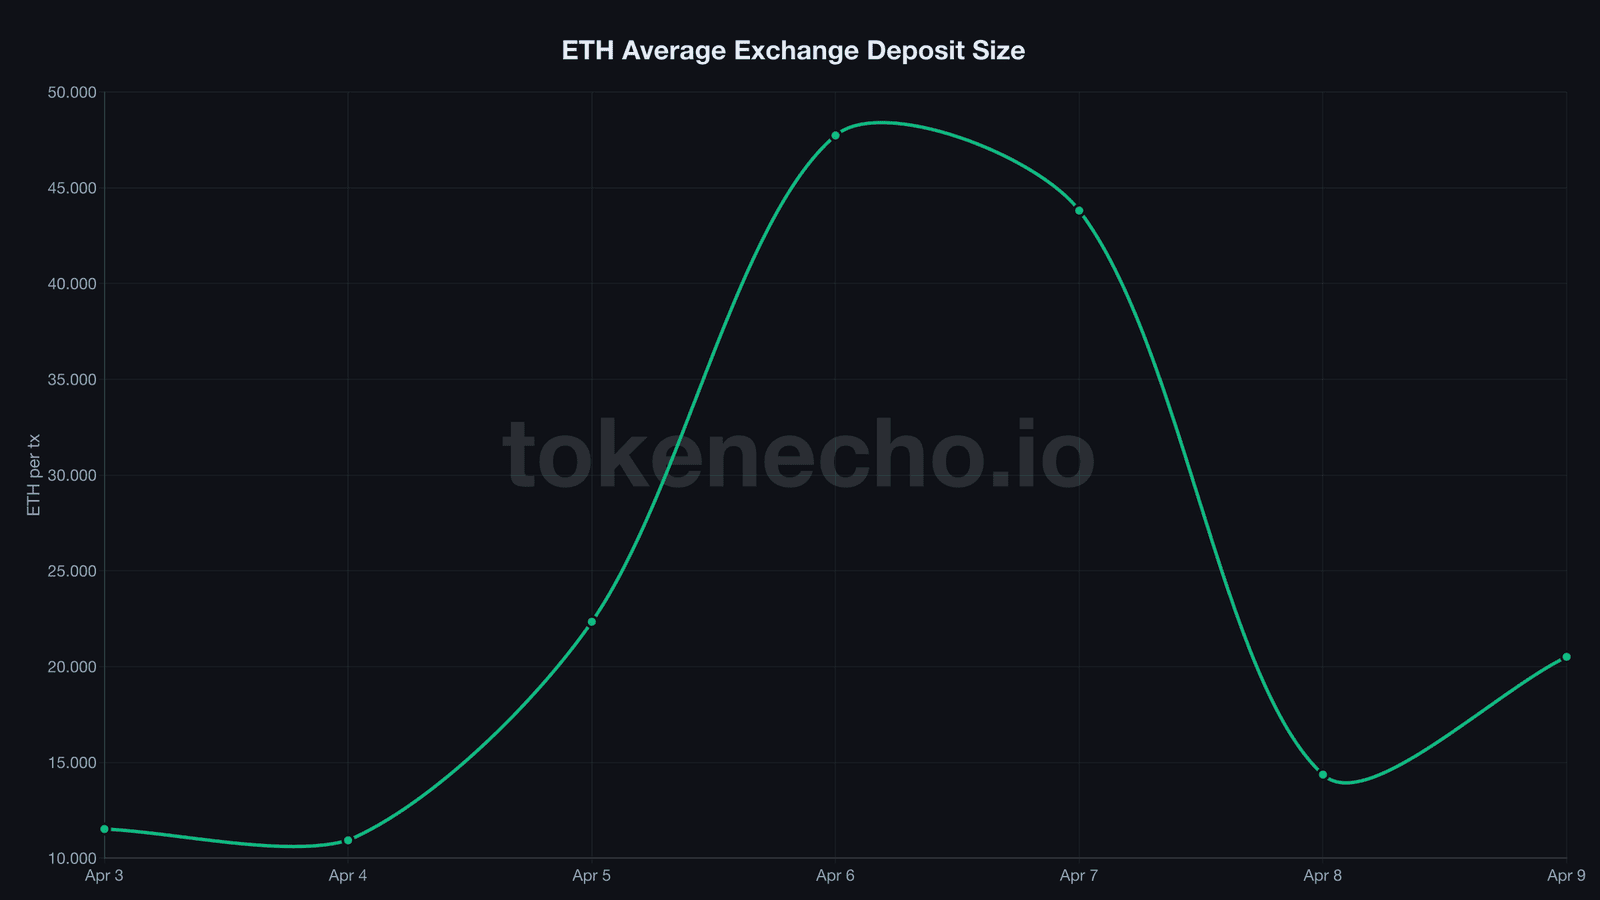
$47.7 ETH per transaction. That was the average deposit size hitting exchanges on April 6 – roughly four times the normal level and a dead giveaway of whale-level selling pressure.
By April 8, that figure had cratered to 14.4 ETH. A 70% collapse in 48 hours.
What caught our attention wasn’t the total volume – 141,000 ETH ($309 million) moved onto exchanges between April 6 and 8, a selling wave we covered in yesterday’s analysis. It’s that the sellers vanished almost overnight.
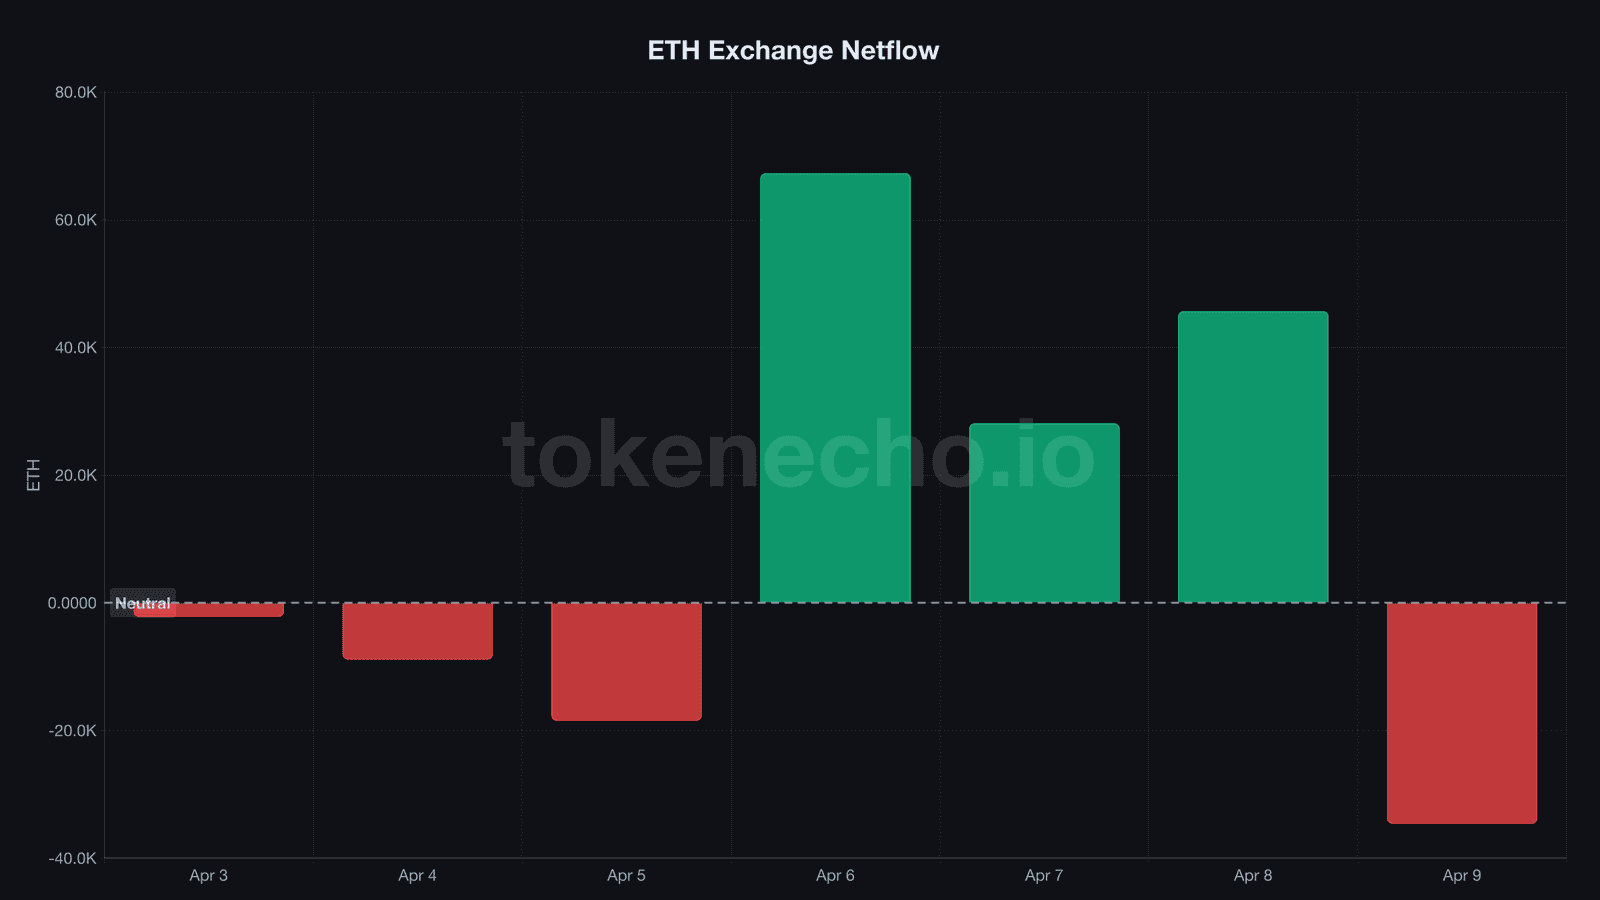
Average deposit size normalized to 20.5 ETH on April 9, and exchange netflow, the difference between deposits and withdrawals on tracked exchanges, flipped negative: 34,609 ETH left exchanges in a single day. First net outflow in four days.
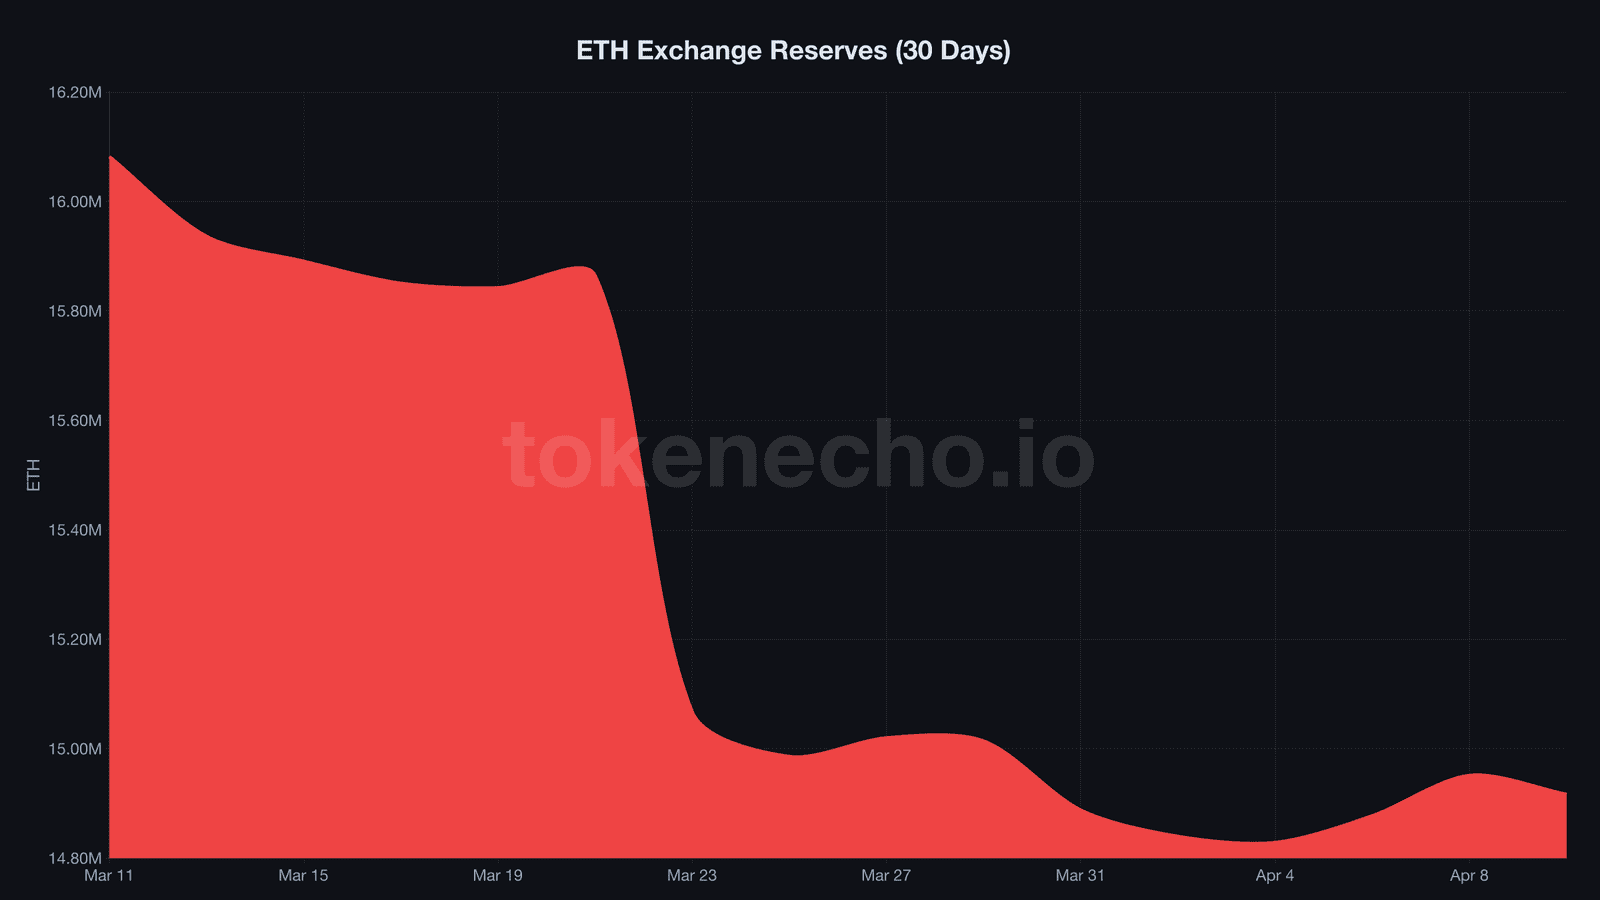
Exchange reserves tell the same story. They spiked from a monthly low of 14.81 million ETH on April 5 to 14.95 million on April 8 – then immediately started bleeding again. The 3-day selling wave barely scratched the surface.
The whole episode resembled a load test on a suspension bridge – engineers stack maximum weight on it, watch for structural failure, find nothing. ETH’s $2,160 floor (today’s 24-hour low) held without breaking a sweat, and buyers stepped right back in.
The selling wave lasted three days. The bounce took one.
Short sellers lost $274M – and derivatives just flipped
The last time Ethereum’s derivatives market posted net buying volume was 2023. That drought just ended.
CryptoQuant analyst Darkfost flagged what he called a structural shift: $104 million in net buying across ETH derivatives, part of a broader $6.64 billion inflow over the past 60 days. For perspective – and this is where the scale gets almost absurd – the prior 12 months saw roughly $132.5 billion in net outflows from ETH derivatives. Not a blip. A regime change.
And the shorts got demolished in the process. $274 million in ETH positions liquidated in 24 hours, with shorts outnumbering longs nearly 3:1. That’s the ratio you see when a crowded trade blows up – too many bears piled into the same bet, and the exit jammed when price ripped the other way.
“Crypto has started to act as a wartime store of value,” Fundstrat’s Tom Lee said, pointing to ETH’s 1,130-basis-point outperformance versus the S&P 500 so far in April. Whether that framing sticks remains an open question – but the derivatives market seems to agree, at least for now.
BlackRock’s staked ETH fund, ETHB, pulled in $44.2 million on April 8 even as broader ETH ETFs posted $18.6 million in net outflows. Smart money isn’t just buying ETH. It’s locking it up for yield.
So the sellers dried up, the shorts got rekt, and institutional capital kept flowing in. But where did all that ETH actually go?
1.16 million ETH drained in 30 days – where to next?
Since March 11, a total of 1.16 million ETH – roughly $2.57 billion at current prices – has been pulled off exchanges, and the three-day selling wave that brought 141,000 ETH back represented barely 12% of that total outflow. A rounding error in what’s shaping up to be one of the largest monthly exchange drains this year.
Some of it landed in DeFi. Ethereum’s total value locked, the aggregate dollar value of assets deposited in decentralized protocols, sits near $68-70 billion with a record 25.3 million ETH parked in smart contracts – more than 20% of circulating supply doing something productive rather than sitting on exchange order books.
Lido alone holds $27.5 billion. And the protocol just launched instant stETH exits on April 9 – removing the last friction point for liquid staking.
Some went to institutions. BitMine debuted on the NYSE this week holding 4.8 million ETH (3.98% of total supply) – the kind of holder that doesn’t panic-sell on a 3% dip. Morgan Stanley launched its MSBT ETF on April 9 and filed for ETH and SOL trusts. TradFi isn’t waiting for permission anymore.
But ETH/BTC hasn’t budged. The ratio sits at 0.0307 – pinned near its five-year low despite all this bullish on-chain activity. Bitcoin dominance at 57.2% continues to compress ETH’s relative performance, and until that ratio cracks above 0.035, Ethereum stays trapped in Bitcoin’s gravity well regardless of what the flow data says.
One wildcard today: the U.S. CPI print. A cool reading could fuel a push toward $2,265 resistance. A hot number risks retesting that $2,160 support – and next time, the whales might not hold their fire.
If whale deposit sizes stay compressed below 25 ETH while derivatives maintain net buying flow, the setup rhymes with the January 2025 accumulation phase that preceded ETH’s run toward its August all-time high near $4,946. But that ETH/BTC ratio at 0.0307 won’t let anyone get too comfortable – Ethereum still has something to prove against the only asset that matters more.
This analysis is part of our daily Ethereum price tracking. See all previous analyses and key metrics on our hub page.
Sellers threw $309 million at ETH and the market absorbed every dollar. The derivatives market flipped bullish for the first time in years. Yet the ETH/BTC ratio hasn’t moved an inch. Something has to give – and today’s CPI print might decide which side blinks first.
This is not financial advice. DYOR. Data as of April 10, 2026.
Sources
- CoinGecko API – ETH price, market cap, supply, volume data
- CryptoQuant – Exchange reserves, netflow, deposit size (inflow mean)
- CryptoQuant (Darkfost) – ETH derivatives net buying analysis
- CoinGlass – ETH futures liquidation data
- DefiLlama – Ethereum DeFi TVL
Leave a Reply