
🕑 5 min read
Bitcoin sellers are disappearing from exchanges at the fastest rate this cycle – and miners can barely afford to keep the lights on.
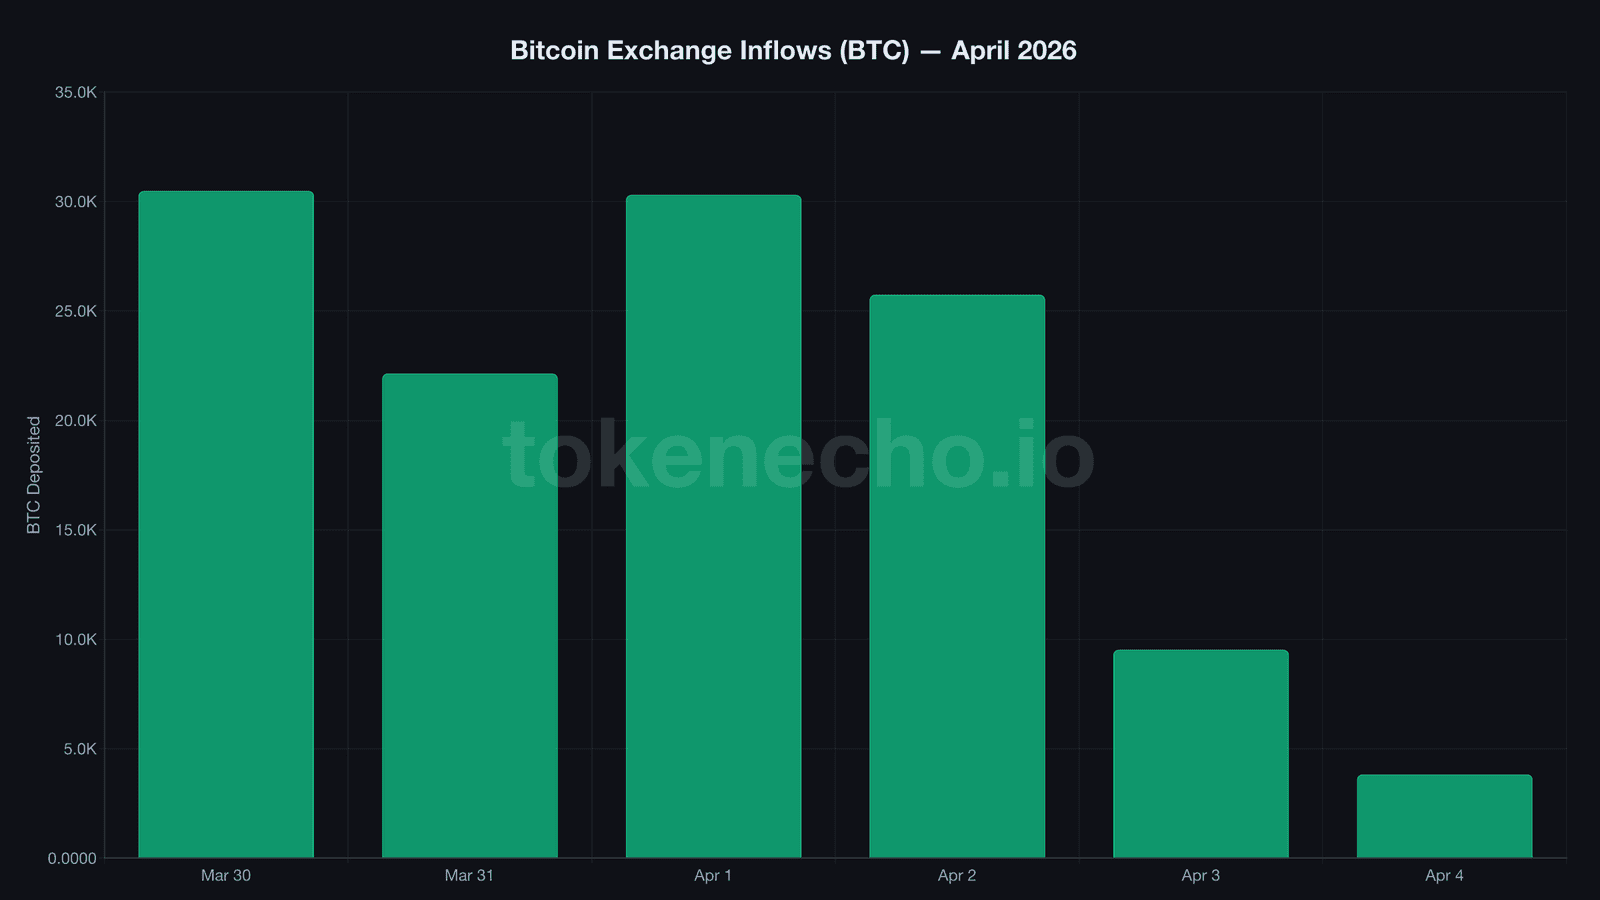
Exchange deposits to Bitcoin exchanges dropped from 30,298 BTC on April 1 to just 3,821 BTC by April 4. An 87% collapse in 72 hours.
Bitcoin trades at $66,854 as of April 5, 2026, essentially flat over the last 24 hours and still 47% below its $126,080 all-time high from October 2025. But this bitcoin price analysis isn’t about what the price did. It’s about what stopped happening underneath it – and why the silence across three separate on-chain metrics should concern bears more than any rally would.
Exchange Deposits Crashed 87% – And Nobody Noticed
The selloff didn’t end with a bang. It ended with silence.
On April 1, exchanges absorbed 30,298 BTC in deposits – a normal day for a market in distress. Then the faucet shut off.
April 2 still looked reasonable at 25,739 BTC. By April 3, deposits cratered to 9,520.
And April 4? Just 3,821. That’s less than half the daily average during the March capitulation flush, the worst single-day wipeout of this cycle.
Exchange reserves confirm it. Since March 31, roughly 5,592 BTC have left exchanges entirely – about $374 million at current prices.
Total reserves now sit at 2,704,352 BTC, dripping lower while the price refuses to budge.
CDD, a metric tracking how many “coin-days” are destroyed when long-held BTC finally moves, collapsed in parallel. The March 31 redistribution spike reached 23.9 million – old coins flushing out in panic.
By April 4, CDD had dropped to 2.5 million. Long-term holders stopped moving entirely.
Any equity trader who’s watched a blue-chip go quiet on vanishing volume knows the pattern. The spring coils. When sellers exhaust themselves before buyers do, the next directional move tends to be fast, decisive, and usually catches the consensus leaning the wrong way.
Miners Haven’t Earned This Little All Cycle
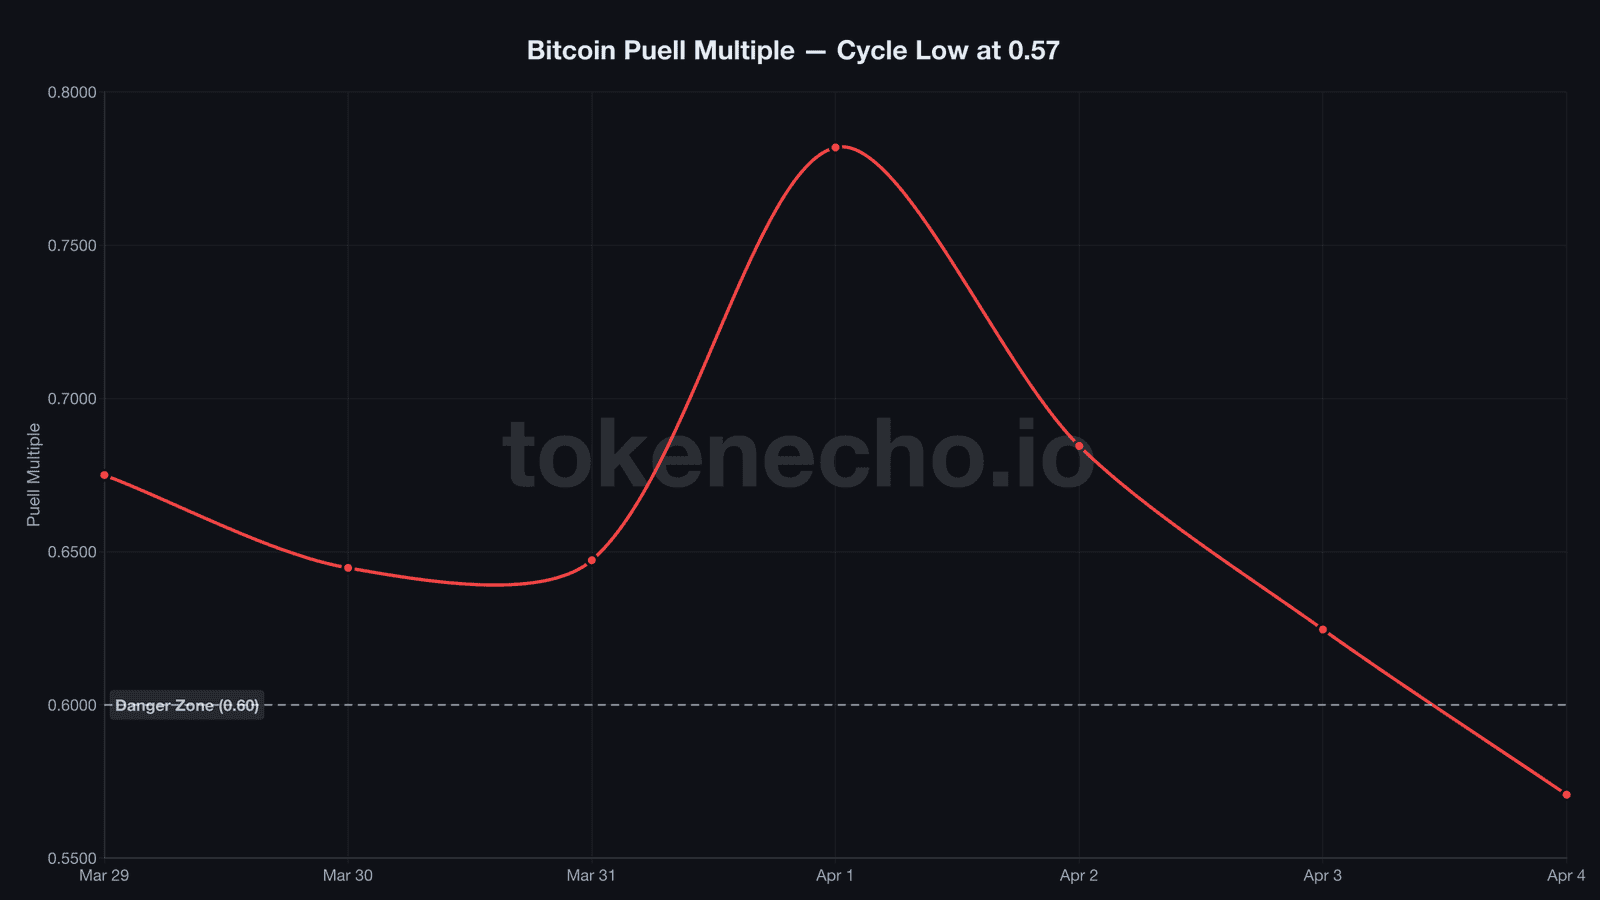
The last time the Puell Multiple, a ratio comparing daily miner revenue to its 365-day average, dropped below 0.60 was during the FTX aftermath in late 2022. Bitcoin sat near $16,000 then.
Today’s reading: 0.5707.
Three days ago it was 0.78. A 27% collapse in the ratio over 72 hours – the steepest we’ve tracked since the cycle began.
Miners aren’t just earning less. They’re earning less faster than at any point this year.
Miner reserves dipped 188 BTC over the week to 1,804,843 BTC. Not a mass exodus – but enough to signal some operators selling production to cover costs rather than stockpiling.
And the realized price, Bitcoin’s aggregate on-chain cost basis, sits at $54,126. The market trades 23.5% above that level, though the cushion has been shrinking every single week since January.
Is that gap sustainable with miners hemorrhaging revenue? Historically, no. Puell readings below 0.60 have marked some of the most reliable cycle bottoms in Bitcoin’s history.
After FTX, the Puell lingered in this zone for roughly three weeks before Bitcoin started the rally from $16,000 to $73,000 – a run that took about six months to fully play out and left nearly every analyst scrambling to revise their year-end targets upward.
Capitulation selling has an expiration date. When miners bleed money on every coin they produce, the forced selling eventually burns itself out – and what replaces it is usually quiet, persistent accumulation.
ETFs Quietly Added 1,400 BTC While Everyone Panicked
So who’s actually buying during the silence?
ETF holdings ticked up 1,407 BTC between March 30 and April 3. Not a flood of institutional capital – but it’s the first net-positive week for spot Bitcoin ETFs in over a month, a reversal from the steady outflows that defined Q2’s opening days.
“When short-term holder realized losses exceed $1 billion in a single week while long-term holders are simultaneously adding to positions, you’re witnessing the textbook definition of smart-money accumulation,” said James Check, lead analyst at Glassnode.
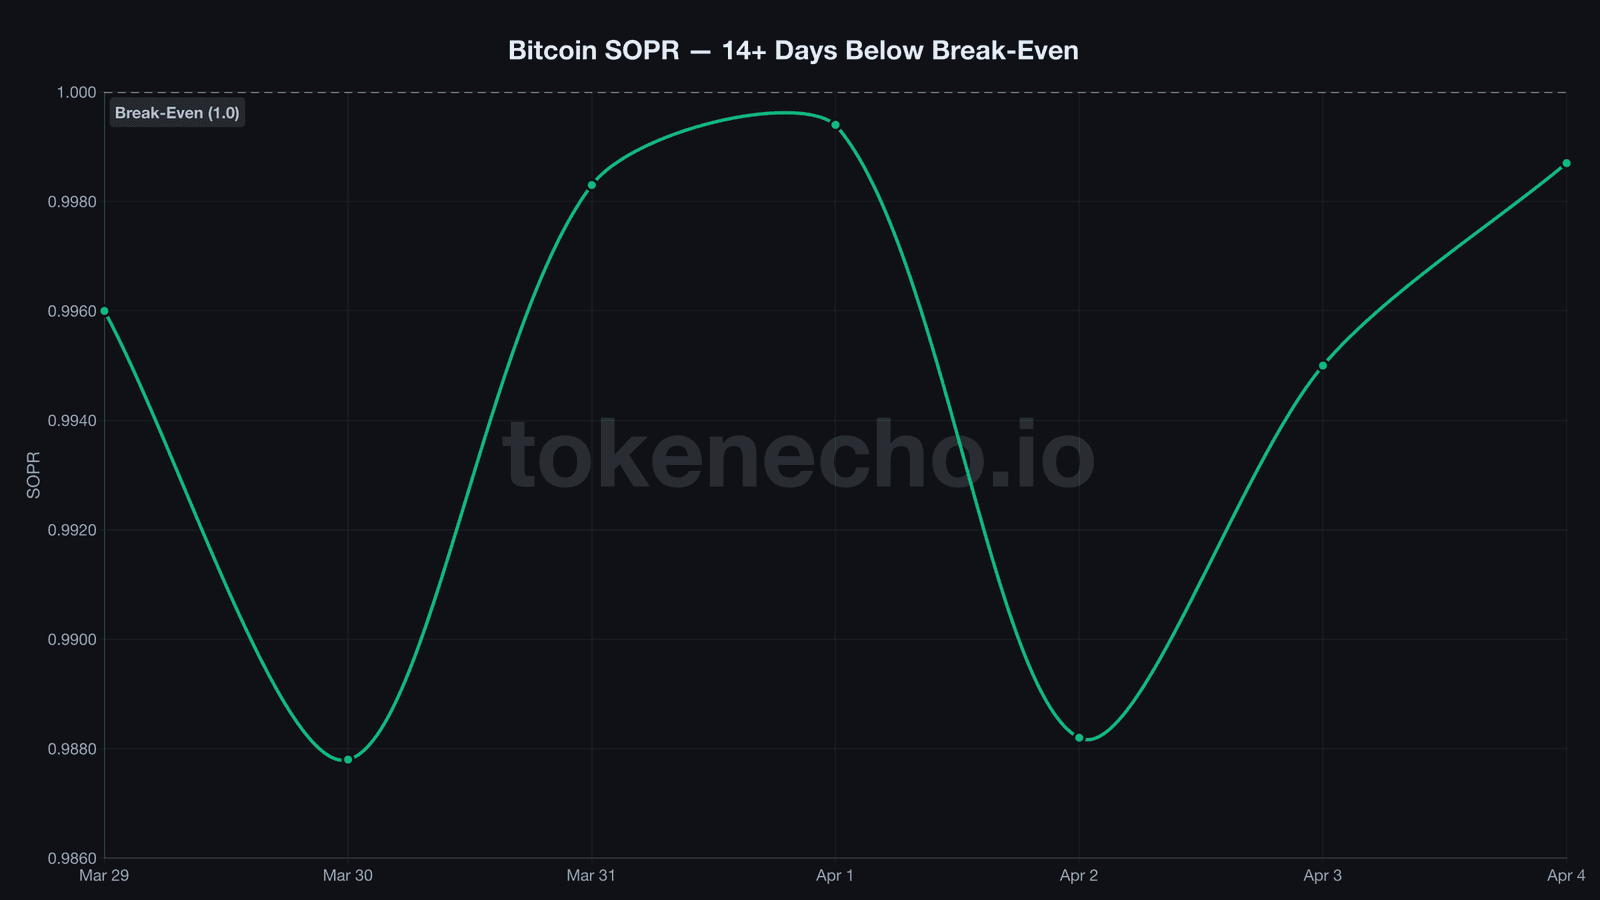
SOPR, the Spent Output Profit Ratio measuring whether sellers book gains or losses, reads 0.999 as of April 4. That’s essentially break-even after 14 consecutive days below 1.0 – every coin sold during that stretch went for less than its purchase price.
The trajectory tells the story. On April 2, SOPR sat at 0.988. Two days later: 0.999.
Sellers are running out of losses to take.
When SOPR crosses back above 1.0 from an extended stint below, it historically marks the inflection from distribution to accumulation.
MVRV, the ratio of market value to realized value, holds at 1.243 – well below overheated territory but still above the fair value floor.
NUPL, which tracks network-wide unrealized profit and loss, sits at 0.196 – anxiety territory, one rung above outright capitulation.
The stablecoin supply ratio reads 9.97, implying roughly $136 billion in stablecoins parked on the sidelines. That dry powder hasn’t deployed yet. But with sellers vanishing and miners at their weakest, the buy side doesn’t need much fuel to tip the balance.
On the flip side: NVT, the network value to transactions ratio, spiked to 46.3 – its highest in weeks. Low on-chain activity also means conviction is thin. One macro shock or regulatory headline could rattle a market where almost nobody is transacting, and there’s barely any organic demand to absorb it.
$66K Holds, But the Coil Won’t Last Forever
Support holds at $66,000, the floor that’s survived multiple retests this week. A break below would expose $64,000 – the March low and a potential acceleration zone.
Resistance starts at $67,500, with $70,000 acting as a round-number magnet above.
But the real test sits at $72,000, where the February breakdown originated.
If SOPR breaks above 1.0 while exchange deposits stay suppressed at current levels, the setup rhymes with the post-FTX quiet period that preceded a 350% rally. Until sellers return and deposit volumes normalize, the price likely grinds higher.
But $66,000 needs to hold. A break below exposes the $64K floor and invalidates the exhaustion thesis entirely.
This analysis is part of our daily Bitcoin price tracking. See all previous analyses and key metrics on our hub page.
Sellers disappeared from exchanges, miners can barely keep the lights on, and ETFs are quietly adding. The price sits dead still at $67K. Something has to break – the question is which direction.
This is not financial advice. DYOR. Data as of April 5, 2026.
Sources
- CryptoQuant API: exchange flows (inflows, outflows, reserves), SOPR, MVRV, NUPL, Puell Multiple, CDD, NVT, SSR, miner reserves, realized price
- CoinGecko API: BTC price, market cap, volume, ATH data
- Glassnode: James Check analyst commentary (March 2026)
Leave a Reply