
🕑 5 min read
CryptoQuant data shows 81% of the exodus came from derivative platforms, not spot markets – and that changes the entire “accumulation” story.
The crypto media spent March celebrating every exchange outflow as proof that whales were stockpiling bitcoin. Sixty thousand BTC left exchanges in April 2026. Four billion dollars’ worth. Must be bullish, right?
They also wrote the wrong story.
When we broke down CryptoQuant’s exchange reserve data by platform type – spot versus derivatives – the narrative collapsed under its own weight.
The $3.3 Billion Nobody Bought – Derivatives Drove the Exodus
Between March 5 and April 3, bitcoin exchange reserves dropped by 60,693 BTC. At $66,765 per coin according to CoinGecko, that’s $4.05 billion – a number that generated “whale accumulation” headlines across every crypto outlet, including ours.
But the devil’s in the breakdown.
CryptoQuant tracks reserves across two categories: spot platforms like Coinbase and Kraken, where people actually buy bitcoin, and derivative platforms like Binance Futures, Bybit, and OKX, where traders bet on price with leverage. The split destroys the buying narrative.
| Exchange Type | BTC Change (30d) | USD Value | Share |
|---|---|---|---|
| Derivative exchanges | -49,303 BTC | $3.29B | 81% |
| Spot exchanges | -11,390 BTC | $760M | 19% |
| Total | -60,693 BTC | $4.05B | 100% |
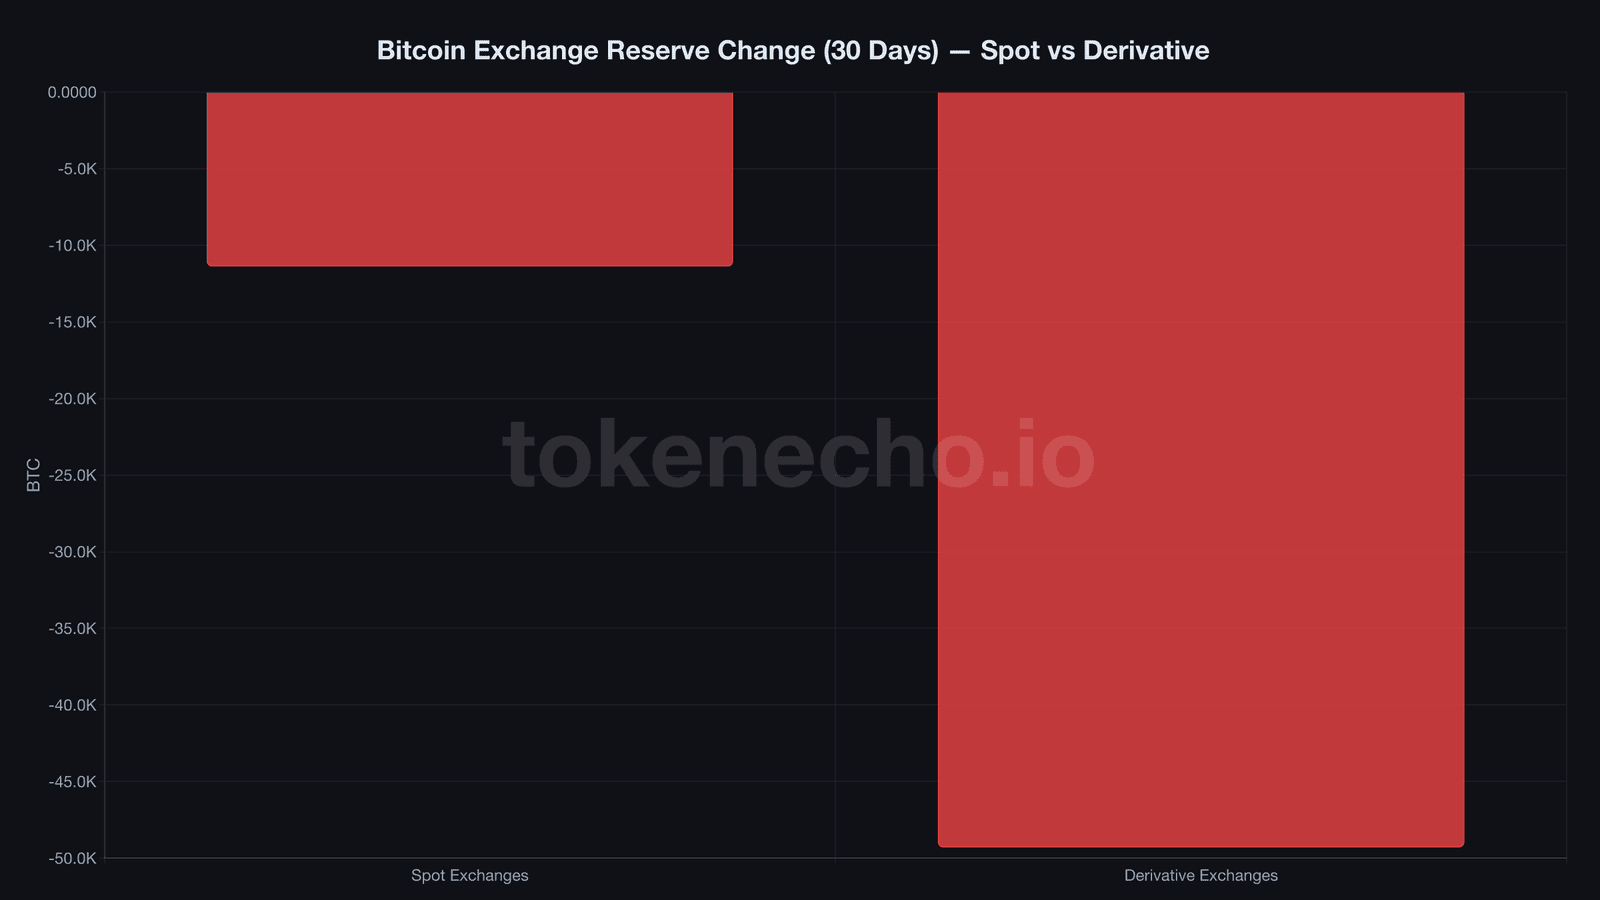
Derivative platforms hemorrhaged bitcoin at 4.3 times the rate of spot. That’s not whale accumulation. That’s leveraged traders closing positions and pulling collateral.
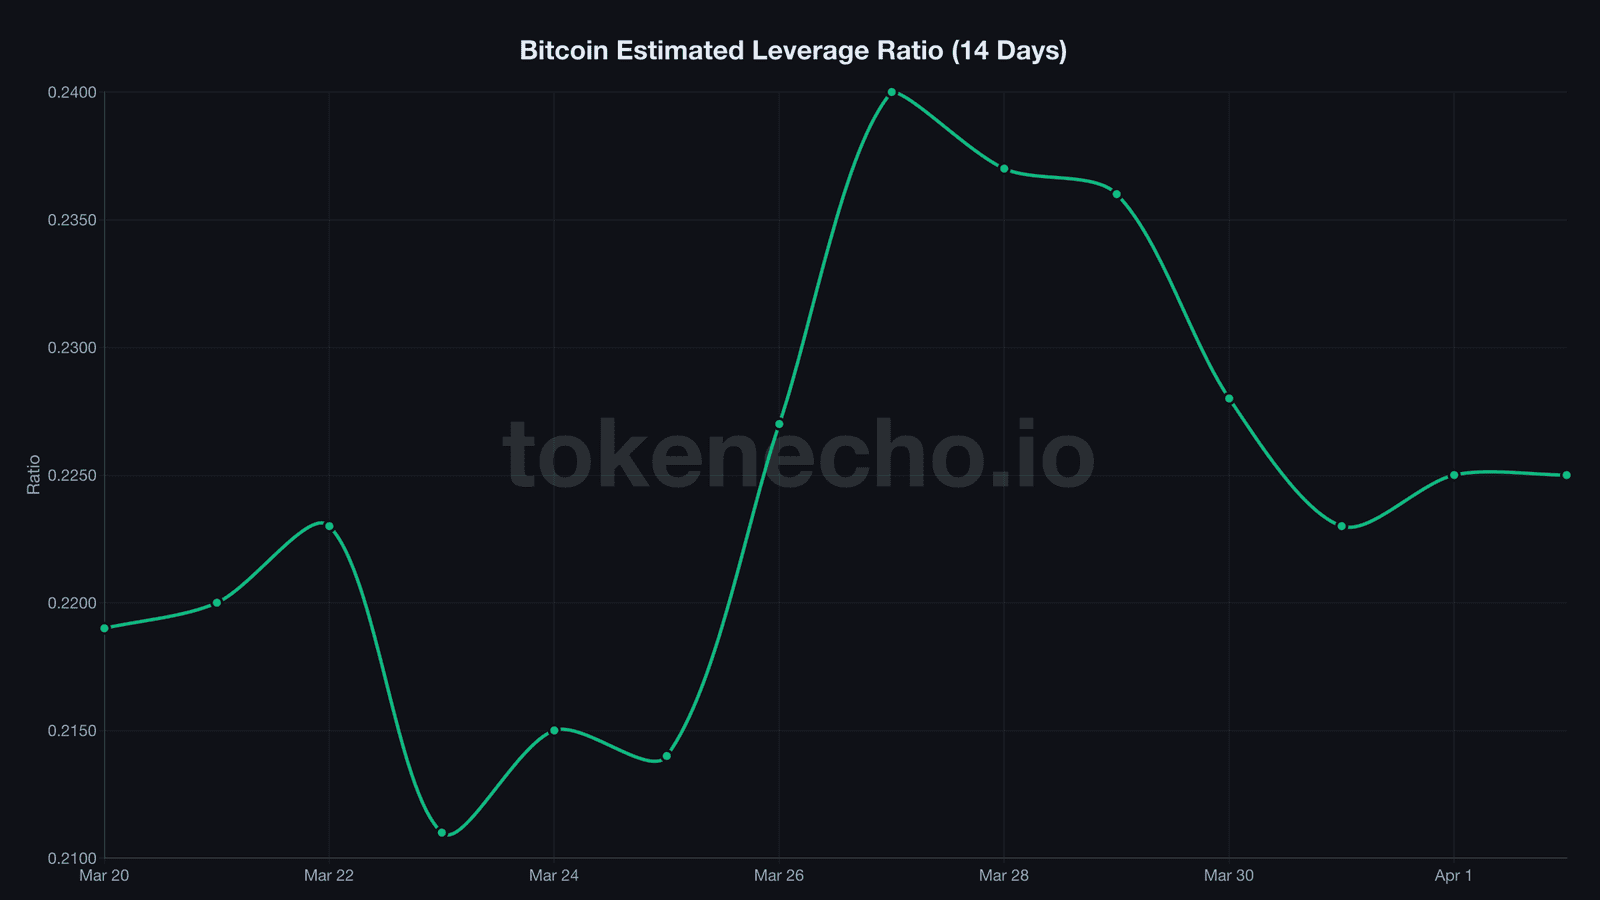
The estimated leverage ratio, which measures open interest relative to exchange-held reserves, confirms the unwind – dropping from 0.240 to 0.225, a 6.3% decline over the same window. Traders didn’t buy $3.3 billion in bitcoin. They unwound futures bets and walked away.
Picture a casino reporting a massive drop in chips on the floor. Sounds like somebody cleaned up. In reality, half the poker room just shut down.
ETFs Stopped Bleeding, Strategy Stopped Buying – So Who’s Left?
If derivative unwinding explains $3.3 billion of the exodus, what about the remaining $760 million from spot exchanges? Somebody withdrew 11,390 BTC from Coinbase, Kraken, and Gemini over 30 days.
6,228 BTC. That’s all Bitcoin ETFs shed from their March 23 peak, leaving total holdings at 1,318,483 BTC as of April 2. Not buying. Not collapsing. Just… idling.
Strategy didn’t touch its wallet. After absorbing 45,000 BTC in a single month through mid-March, Michael Saylor’s company broke its 13-week buying streak. Seven hundred sixty-two thousand BTC in the treasury, zero new coins.
Miners can’t help either. Reserves held flat at 1,800,800 BTC throughout March. The Puell Multiple, a ratio comparing daily miner revenue to its 365-day average, reads 0.685 – miners are earning 68 cents on every historical dollar. Barely enough to cover electricity bills in Texas, let alone stack more sats.
So $760 million in spot bitcoin vanished from exchanges. ETFs didn’t buy it. Strategy didn’t buy it. Miners couldn’t afford to. Where did 11,390 BTC go?
OTC desks. Private wealth offices. Sovereign entities we’ll learn about in quarterly filings six months from now. The actual spot accumulation signal – the only one that matters – works out to roughly $25 million per day. Real, but a whisper compared to the $4.05 billion headline everyone ran with.
“The market is not pumpable for months,” CryptoQuant CEO Ki Young Ju said on X in March, pointing to weak spot demand beneath the surface. The derivative unwind data shows exactly why – what looked like a wall of buying was mostly a wall of closing.
Deleveraged, Exhausted, and Sitting on $135 Billion in Dry Powder
So if 81% was unwinding and the real buying signal is modest – is that actually bearish?
Deleveraging isn’t bad news. It’s the market pouring a concrete foundation where there used to be sand.
A leverage ratio of 0.225 means the cleanest positioning in over a month. Fewer leveraged longs means fewer cascading liquidations on the next downtick. And whenever the next directional move comes – up or down – it’ll be driven by genuine spot conviction, not paper bets that evaporate at the first sign of volatility.
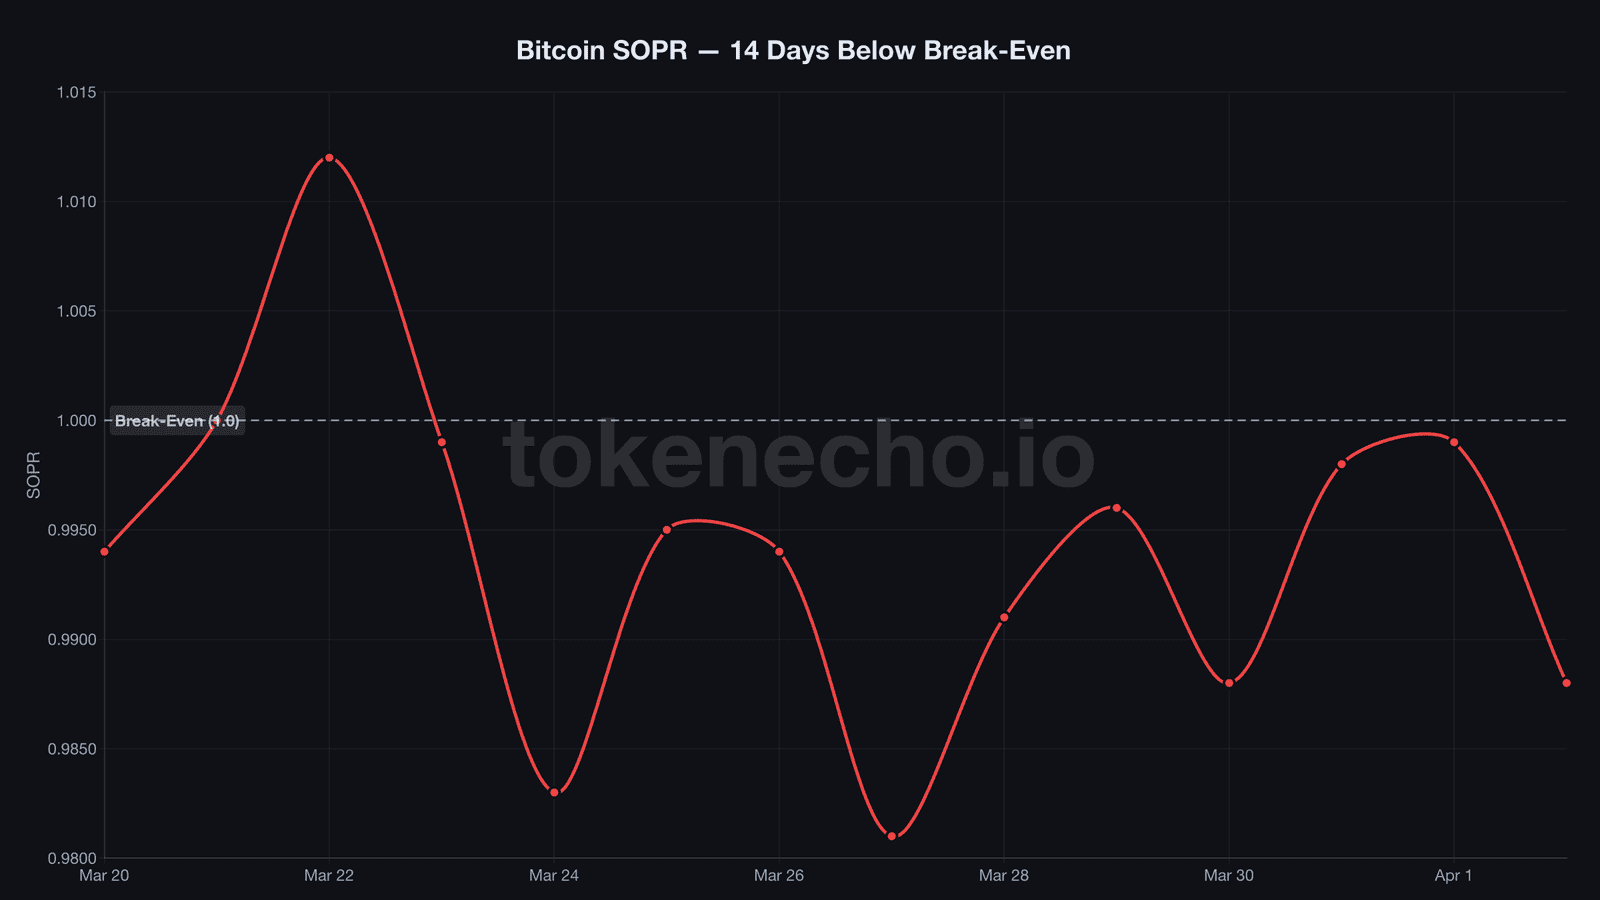
The sell side, meanwhile, looks gutted. SOPR, the spent output profit ratio measuring whether bitcoin sellers transact at a profit or loss, has clung below 1.0 for 11 straight days. Every seller is locking in losses. The last stretch this long was November 2022, when BTC sat at $16,000 right after FTX collapsed. It tripled within 90 days.
NUPL, net unrealized profit and loss tracking the market’s aggregate paper gain, sits at 0.191 – one notch above the capitulation threshold. Not FTX-level despair. But uncomfortably close.
And nobody’s touched the powder keg. The Stablecoin Supply Ratio, which divides bitcoin’s market cap by total stablecoin supply on exchanges, reads 9.91 – translating to roughly $135 billion in USDT, USDC, and a growing roster of alternatives parked on exchanges, doing absolutely nothing while sellers exhaust themselves day after day. Bitcoin’s entire 24-hour volume is $36.5 billion. That sidelined cash could swallow almost four full trading days in a single wave.
Bitcoin isn’t alone in this exodus. Ethereum shed 1,106,000 ETH – $2.27 billion according to CryptoQuant – from exchange wallets over the same 30 days. Exchanges are getting lighter across the board.
When seven bottom signals aligned simultaneously in early April, the market barely flinched. A deleveraged derivatives market, exhausted sellers, near-capitulation sentiment, and $135 billion on the sideline – traders watching this setup will recognize it doesn’t appear often.
If SOPR breaks above 1.0 while stablecoin reserves hold steady, the setup rhymes with Q4 2022. If exchange reserves keep declining into a deleveraged market, the math for a spot-driven supply squeeze gets harder to dismiss each week. But until real spot demand proves itself – not derivative unwinds masquerading as accumulation, but genuine buy-and-withdraw conviction – the ceiling stays low.
This analysis is part of our daily Bitcoin price tracking. See all previous analyses and key metrics on our hub page.
The data says deleveraging. The headlines say accumulation. Figuring out which story $135 billion believes will define the next move.
This is not financial advice. DYOR. Data as of April 3, 2026.
Sources:
- CryptoQuant – BTC Exchange Reserves (Spot vs Derivative), Estimated Leverage Ratio, SOPR, NUPL, Puell Multiple, Stablecoin Supply Ratio, ETH Exchange Reserves, BTC Fund Data
- CoinGecko – BTC price $66,765, 24h volume $36.5B, market cap $1.336T
Leave a Reply