🕑 4 min read
Bitcoin’s price says sell. The blockchain says someone disagrees.
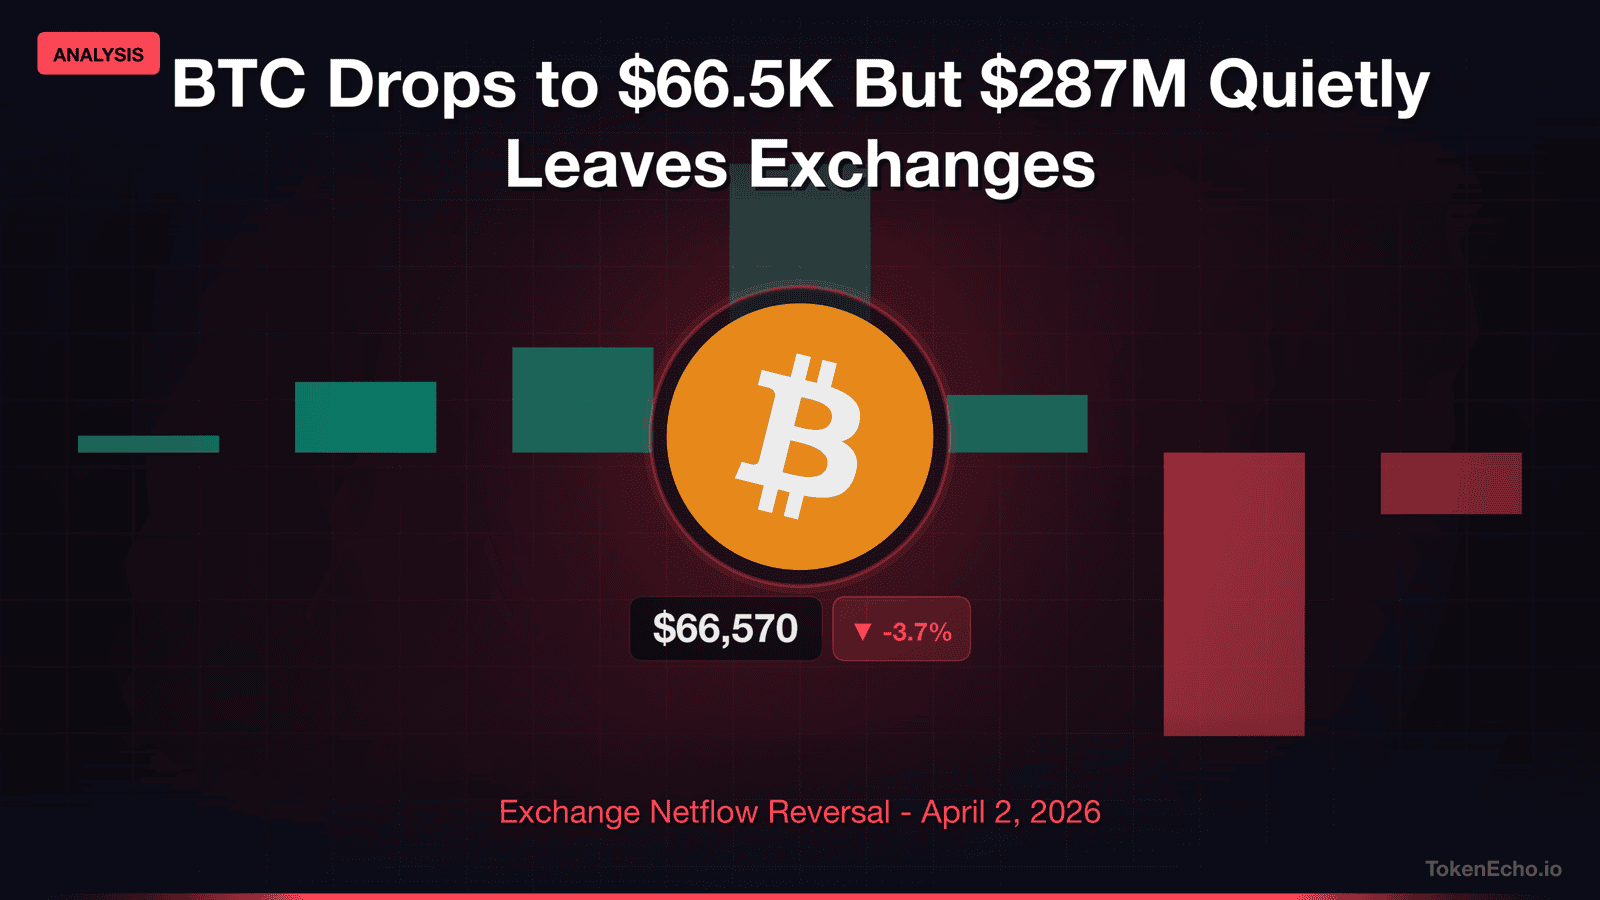
Bitcoin price analysis for April 2 reveals one of the sharpest on-chain reversals we’ve tracked in weeks. BTC slid 3.7% to $66,570, carving out a $2,556 range between its intraday high of $69,126 and the session low of $66,250. That marks seven straight days below $70,000 – and a 47.2% distance from the October 2025 all-time high of $126,080.
But the on-chain picture just flipped upside down.
$287M in BTC Left Exchanges While the Price Dropped $2,500
After six consecutive days of exchange inflows totaling over 6,700 BTC, netflow – the difference between deposits and withdrawals across all platforms – reversed overnight. On April 1 alone, exchanges hemorrhaged 3,549 BTC. April 2 has extended the bleed with another 771 BTC withdrawn before the day’s half over.
That’s $287 million in Bitcoin pulled into cold storage in 48 hours. And it happened while the price was falling – not rallying.
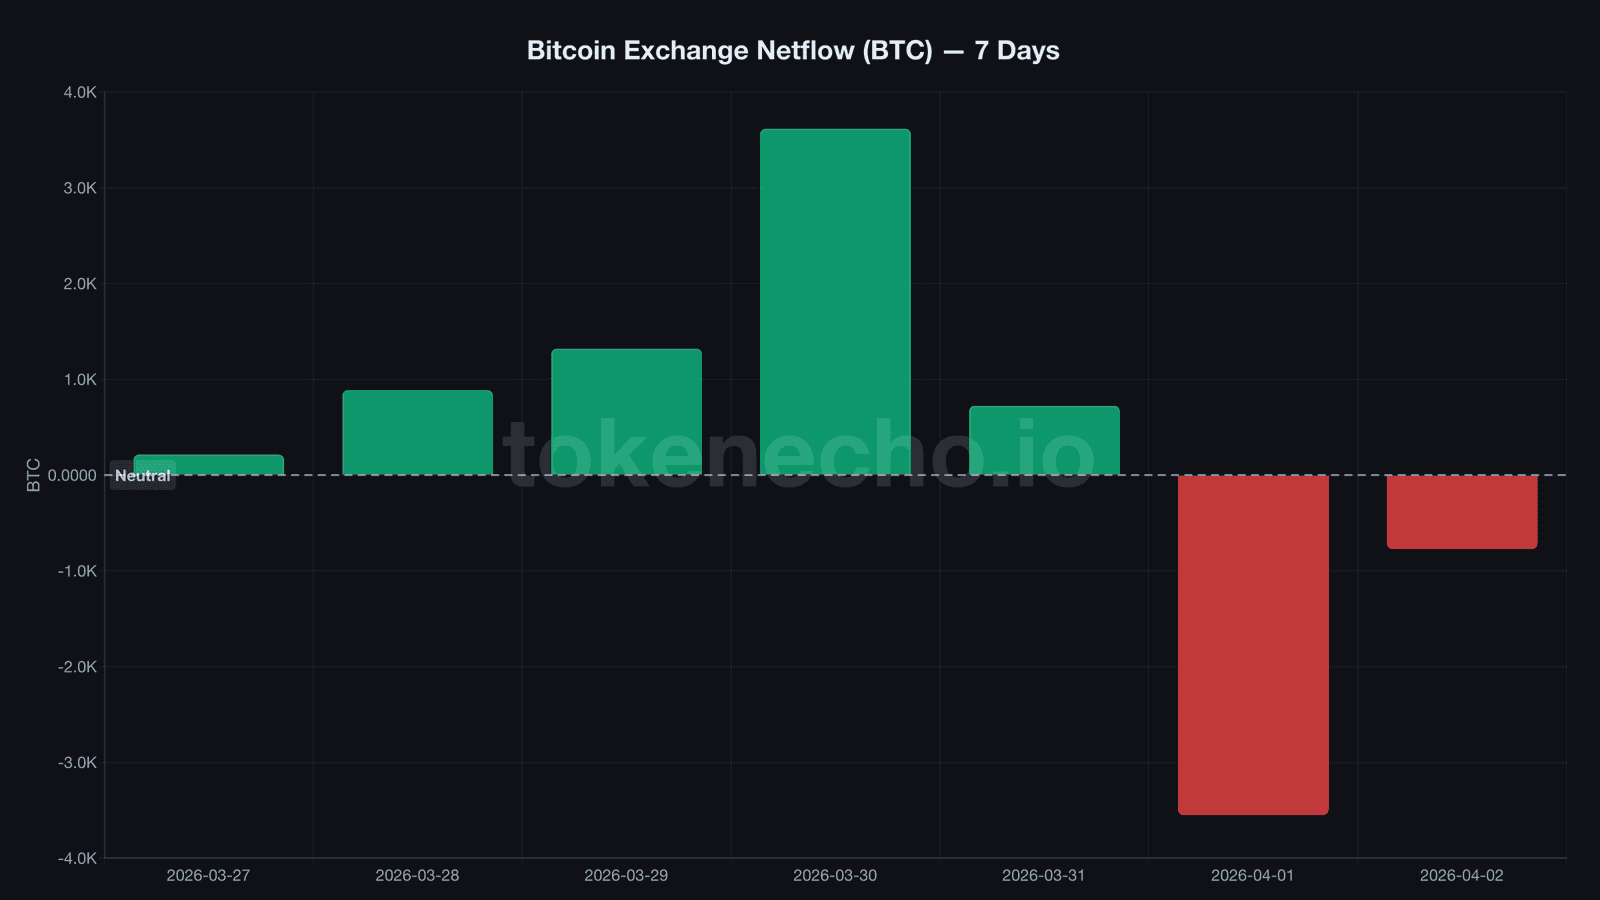
Total exchange reserves now sit at 2,705,624 BTC, down over 4,300 from their March 31 local peak of 2,709,944. We flagged the exact opposite pattern yesterday – 4,645 BTC flooding INTO exchanges over 72 hours. The reversal is whiplash-fast.
“This persistent outflow suggests genuine accumulation by investors, who continue to buy and withdraw their BTC from exchange platforms,” said Darkfost, a CryptoQuant analyst.
Price down, coins off exchanges. Someone with deep pockets doesn’t think $66.5K is expensive.
It’s like watching someone stack sandbags while the forecast still calls for rain. The flood hasn’t arrived – but someone’s preparing for what comes after.
SOPR Hits 0.999 – The 11-Day Loss Streak’s Breaking Point
The last time SOPR, a ratio measuring whether sellers lock in gains or losses on every coin they move, spent 11+ consecutive days below 1.0 was during the FTX collapse in November 2022. Bitcoin sat at $16,000 back then. What followed: a 350% rally over the next 14 months.
Today’s reading: 0.999. Practically kissing break-even.
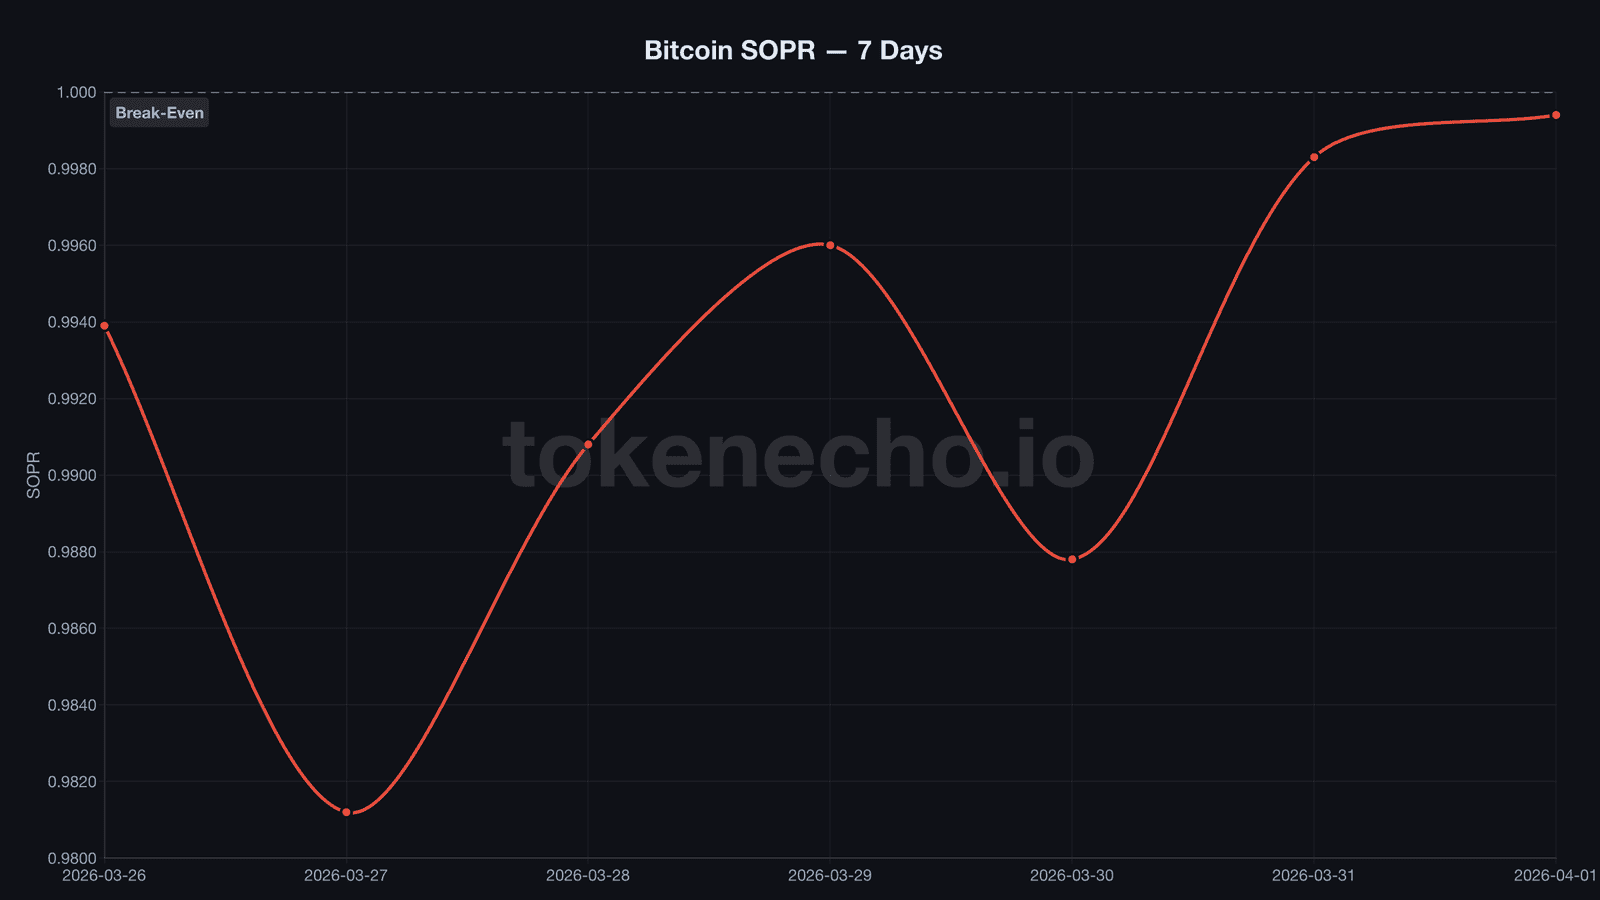
What caught our attention isn’t the number – it’s the trajectory. SOPR has climbed steadily from 0.981 on March 27 to 0.999 today. The loss-selling is drying up, day by day.
NUPL, a gauge of aggregate unrealized profit and loss across all holders, backs the same read. It’s recovered to 0.204 from the March 29 low of 0.178 – a level that sat uncomfortably close to the capitulation zone. MVRV, which compares market value to the cost basis of all coins on-chain, holds at 1.257. With a realized price of $54,173, the average holder still sits on roughly a 23% unrealized gain.
Thin – but positive. The last time that profit margin compressed this far, Bitcoin eventually tripled.
The market’s quietly resetting itself while headlines scream panic. That disconnect rarely lasts.
Leverage Flushed, Miners Recovering – A Cleaner Setup for Q2
This might be the healthiest part of the entire selloff.
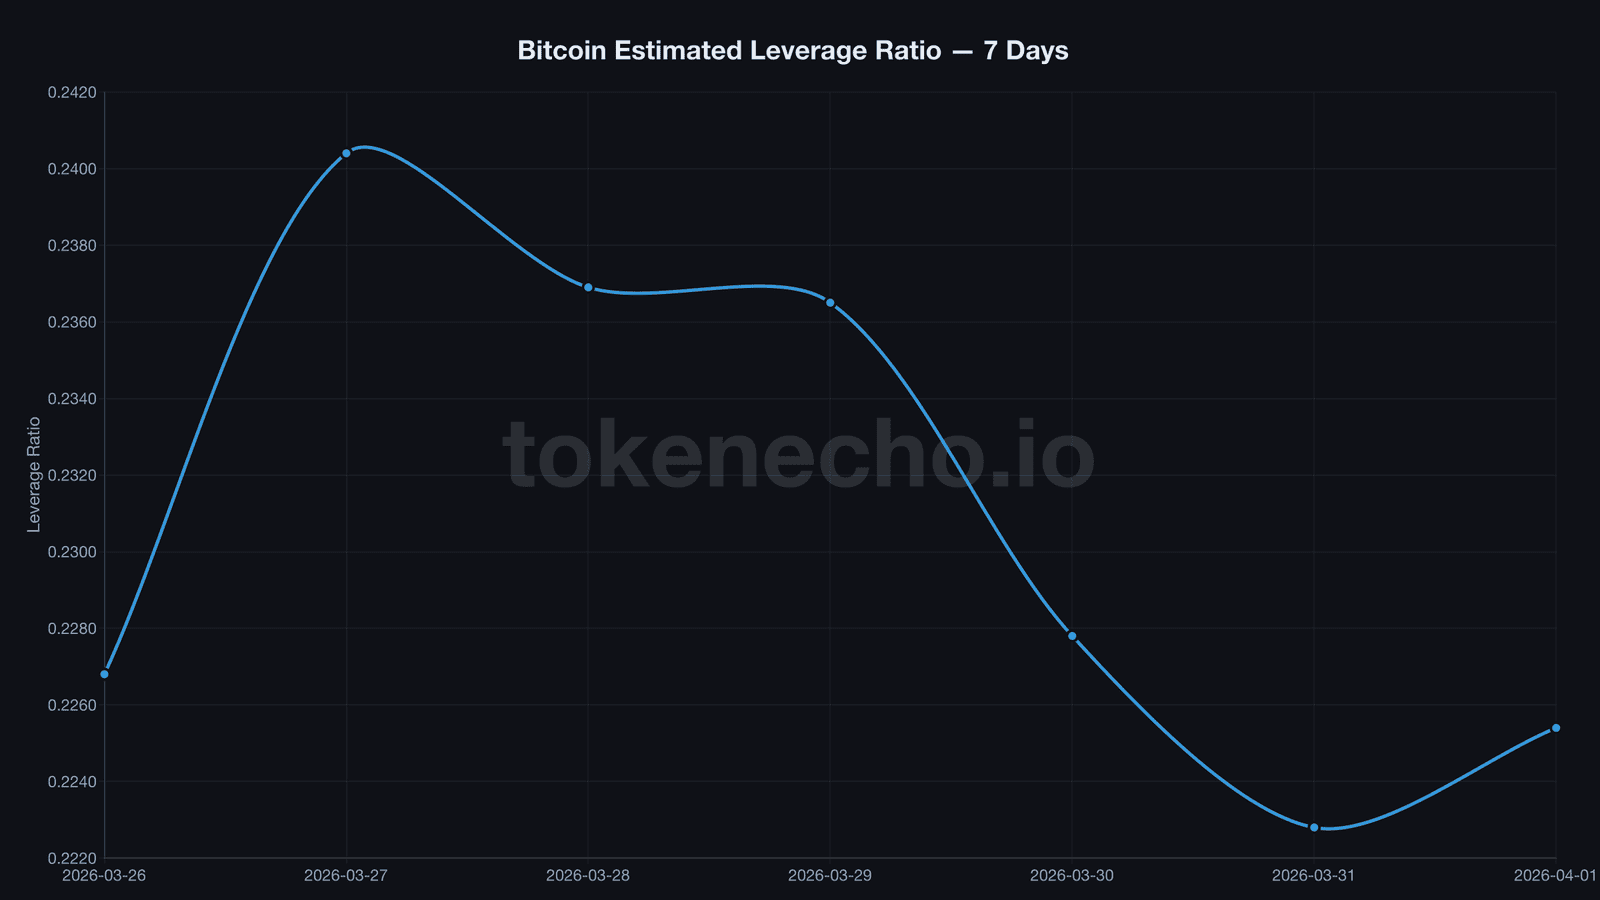
The estimated leverage ratio across all exchanges dropped to 0.225, down from its March 28 peak of 0.237. That’s a 5% reduction in speculative positioning in under a week. Derivatives traders who got overleveraged during March volatility? Flushed.
And miners are showing signs of life. The Puell Multiple, which measures daily miner revenue relative to the 365-day average, jumped 21% from 0.645 to 0.782 in a single day. Still below the 1.0 “healthy” threshold, but the direction matters more than the absolute level right now. Miners aren’t dumping. They’re starting to breathe.
So where does all the stablecoin dry powder go? The Stablecoin Supply Ratio sits at 10.07, which translates to roughly $136 billion in purchasing power parked on the sidelines relative to Bitcoin’s market cap. It hasn’t deployed yet.
One risk worth flagging: the 6-day inflow streak before this reversal (March 27-31) pushed reserves up by nearly 6,500 BTC. We’ve seen this pattern before – reversal, partial withdrawal, then another wave of deposits. If netflows turn positive again, $66,000 support gets tested fast.
Key Levels to Watch
| Level | Price | Significance |
|---|---|---|
| Immediate support | $66,000 | April 2 low, psychological floor |
| Strong support | $64,000 | February-March base |
| Immediate resistance | $69,100 | Today’s rejected high |
| Key resistance | $70,000 | Psychological, 7-day ceiling |
| Major resistance | $72,000 | March cluster zone |
If exchange outflows hold above 1,000 BTC/day while SOPR crosses and sustains above 1.0, the setup rhymes with the post-FTX accumulation phase – a period that preceded Bitcoin’s longest sustained rally in two years. But if netflows flip positive again and leverage starts rebuilding above 0.235, the $66K floor becomes Q2’s first real battleground.
We’ve seen this alignment before. It doesn’t guarantee direction. But it narrows the possibilities considerably.
This analysis is part of our daily Bitcoin price tracking. See all previous analyses and key metrics on our hub page.
Exchange outflows say one thing, the price says another. Whether SOPR finally crosses 1.0 this week could settle the argument.
This is not financial advice. DYOR. Data as of April 2, 2026.
Leave a Reply