
🕑 4 min read
Bitcoin’s unrealized profits are shrinking fast — but a record wall of stablecoin capital hasn’t moved yet.
The Quiet Bleed Nobody’s Watching
Bitcoin traded at $67,269 on Sunday morning, up a deceptive 1% over 24 hours. Zoom out a week and the picture flattens — BTC lost 0.8% over seven days, barely registering a pulse while sitting 46.6% below its October 2025 all-time high of $126,080.
But the real story isn’t the price. It’s what’s happening underneath it.
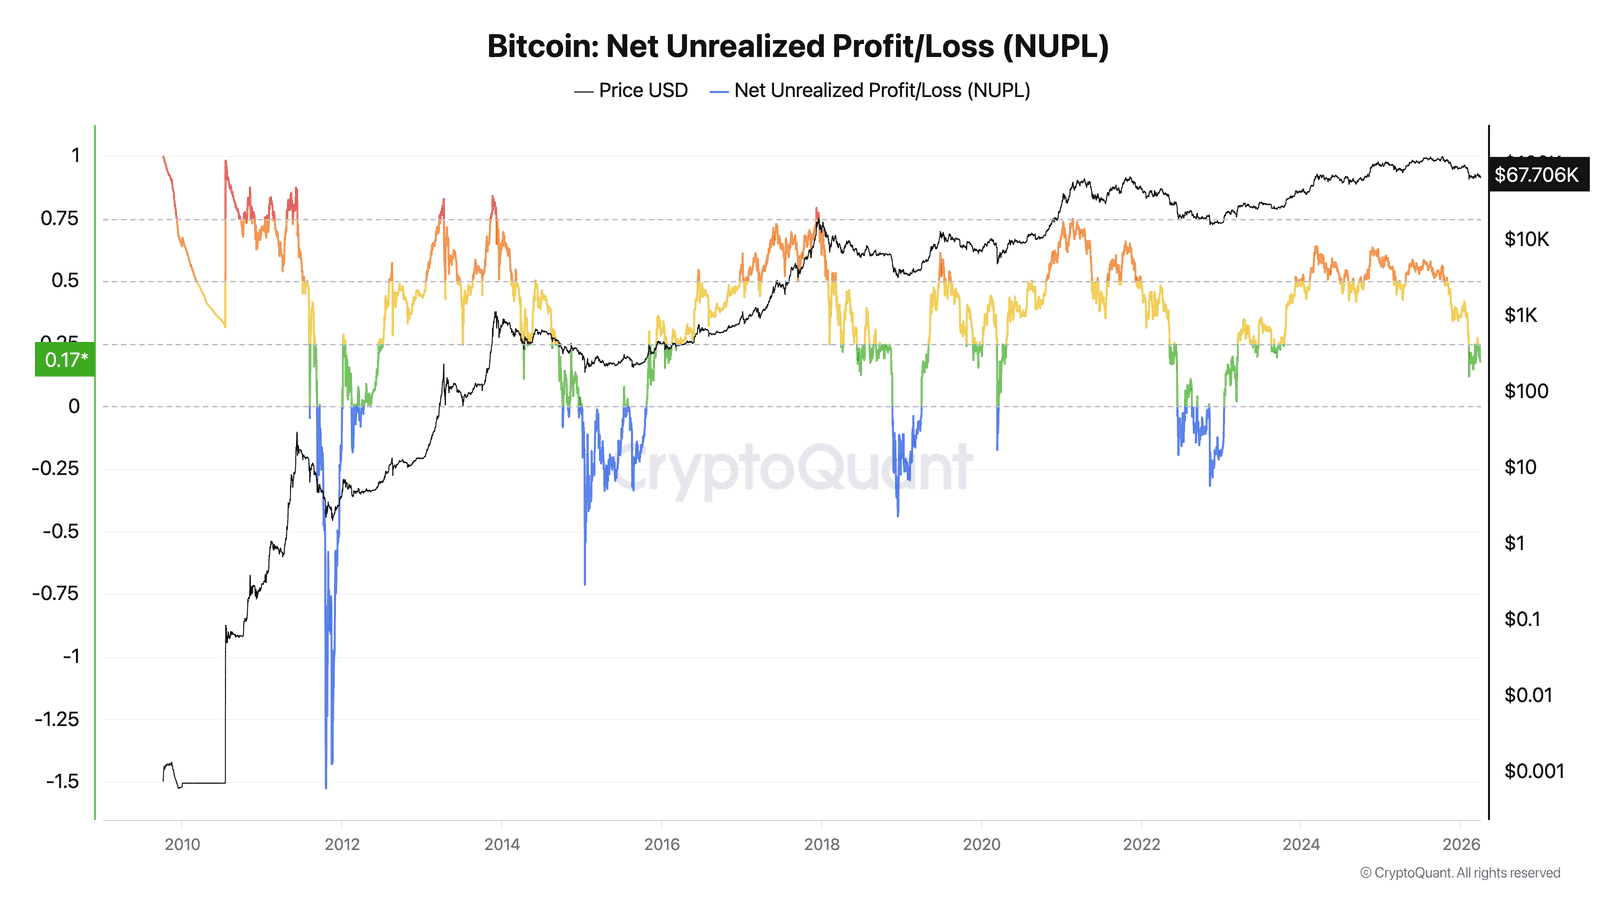
NUPL — Net Unrealized Profit/Loss, the metric that tracks how much profit or loss is sitting in wallets that haven’t sold yet — dropped to 0.178. That’s down from 0.233 just seven days ago. A 24% decline in a single week.
Why does that matter? Because NUPL below 0.0 is capitulation territory. We’re not there yet, but at this pace, we could be within two weeks.
Everyone’s Selling at a Loss – Again
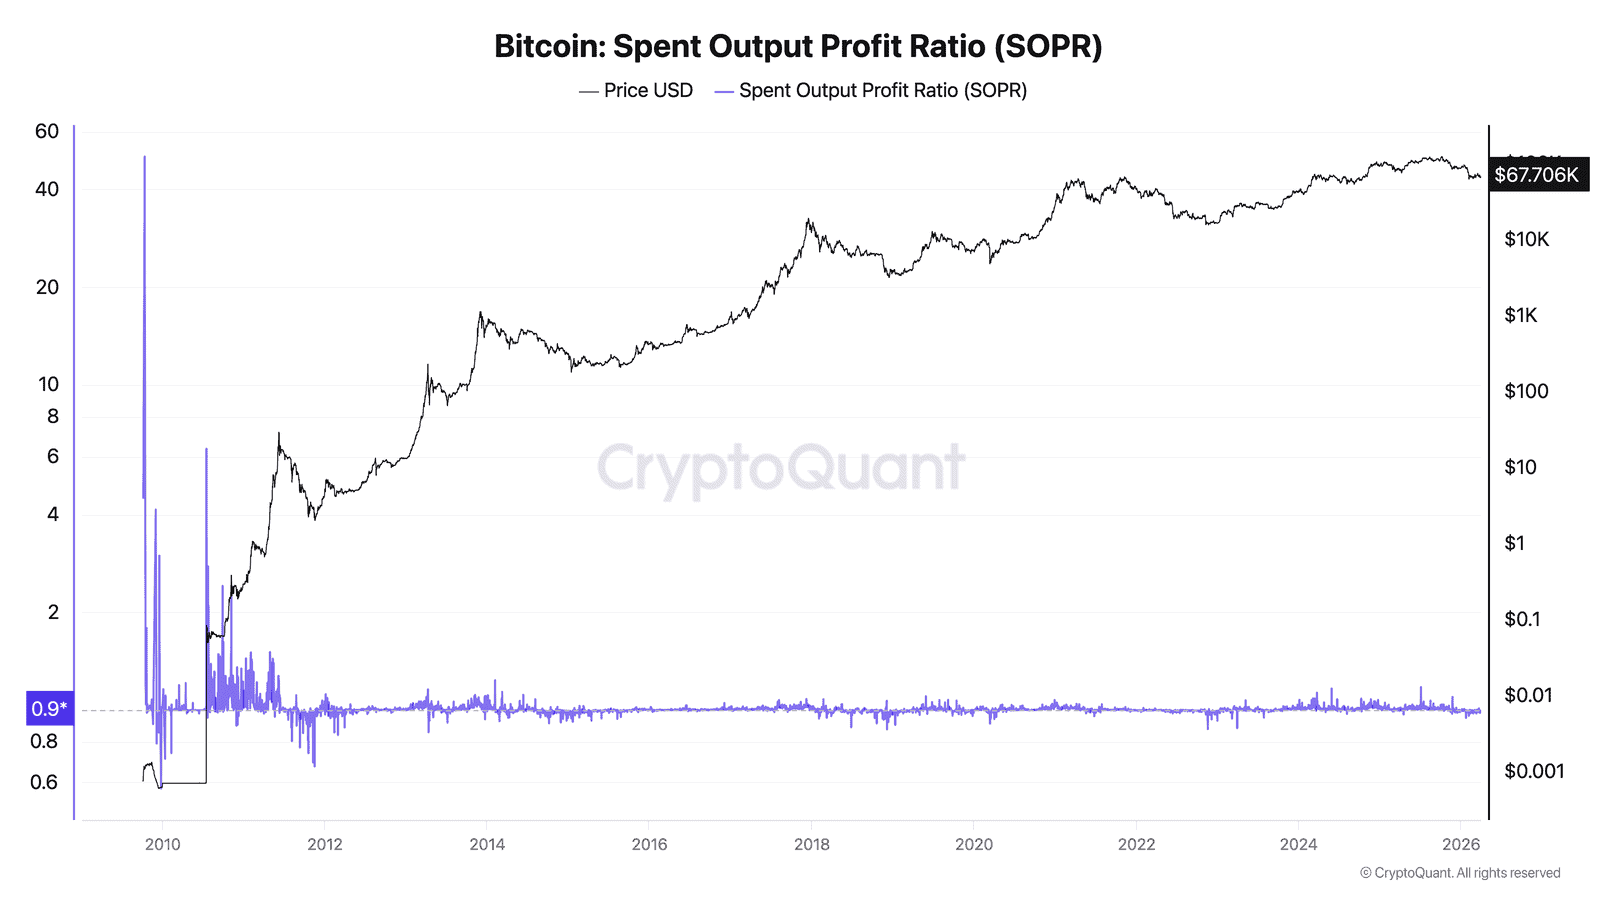
SOPR, the Spent Output Profit Ratio, printed 0.996 on March 29. That’s the eighth consecutive day below 1.0, meaning every coin that moved on-chain was sold at a loss on average. Eight straight days. The last time SOPR stayed negative this long was during the FTX collapse.
Long-term holders haven’t been spared either. LTH-SOPR crashed to 0.723 on March 28 — meaning holders who survived FTX, Luna, and COVID sold at a 28% average loss. It bounced to 0.866 by March 29, but don’t mistake exhaustion for recovery. These are diamond hands finally cracking.
MVRV sits at 1.217, down from 1.304 a week ago. Still above 1.0, so the average holder is technically in profit — but barely. That margin is thinning fast.
The Supply Squeeze That Wasn’t
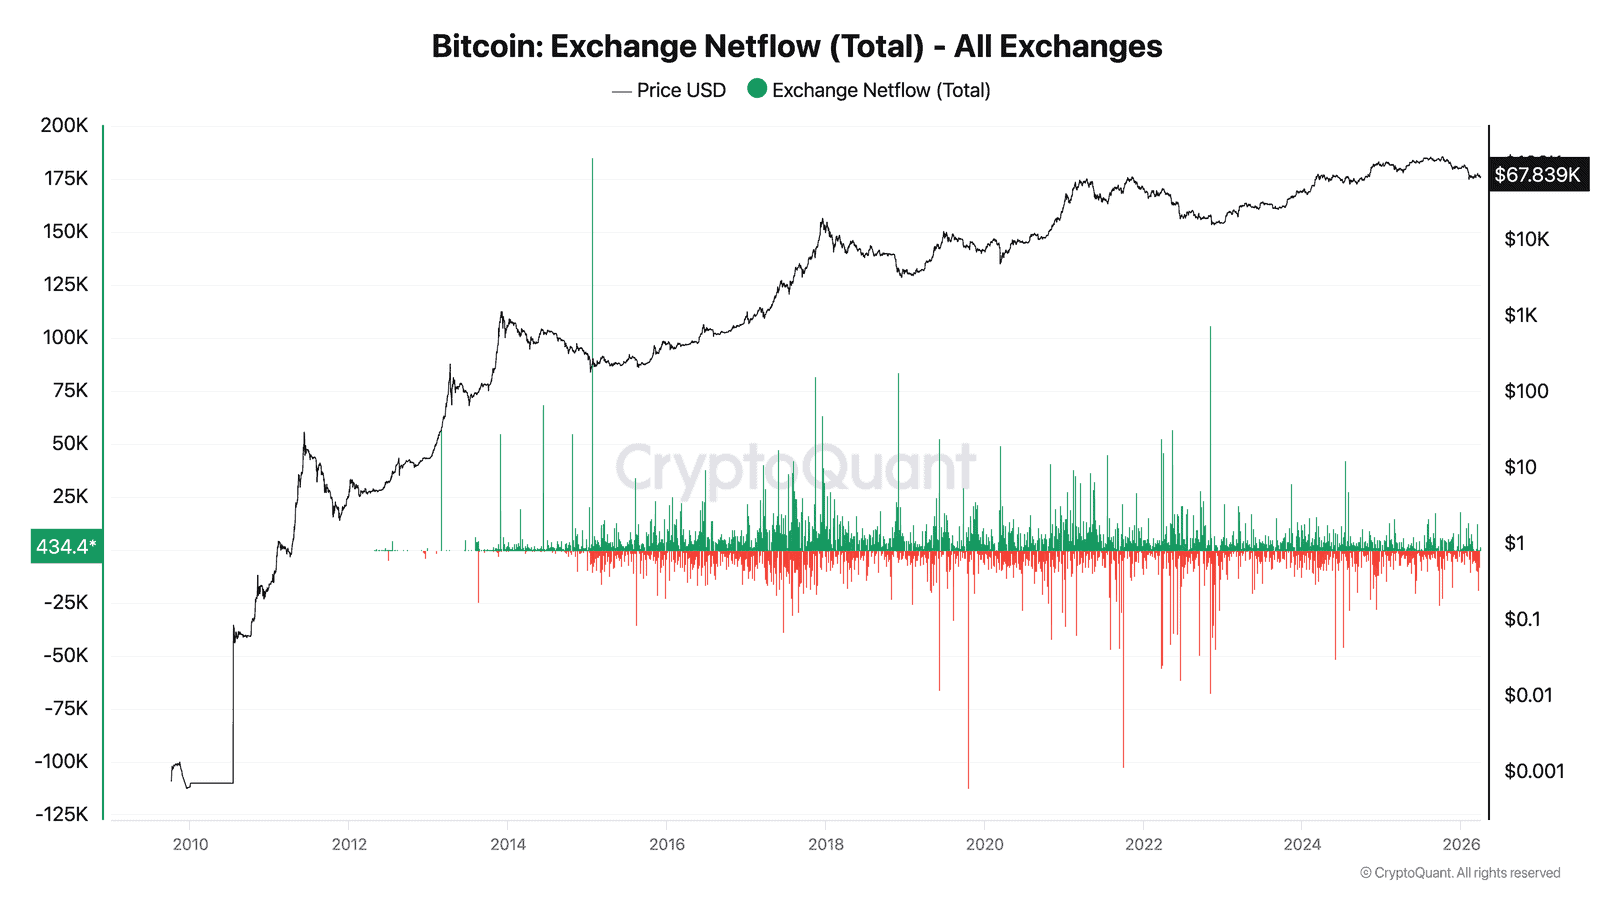
On March 25, 4,954 BTC flooded off exchanges in a single day. That looked bullish — classic accumulation signal. Smart money pulling coins into cold storage.
Five days later? Every single bitcoin came back.
Exchange netflows flipped positive for five consecutive days: +213 BTC on March 27, +885 on March 28, +1,319 on March 29, and +434 on March 30. Total inflow: 4,544 BTC. Exchange reserves climbed from 2,701,496 to 2,706,041 — almost exactly where they started on March 24.
That “supply squeeze” was a head fake. And it’s not the only one.
$139 Billion Sitting in the Parking Lot
So if NUPL is sliding, SOPR is negative, and coins are returning to exchanges — where’s the bull case?
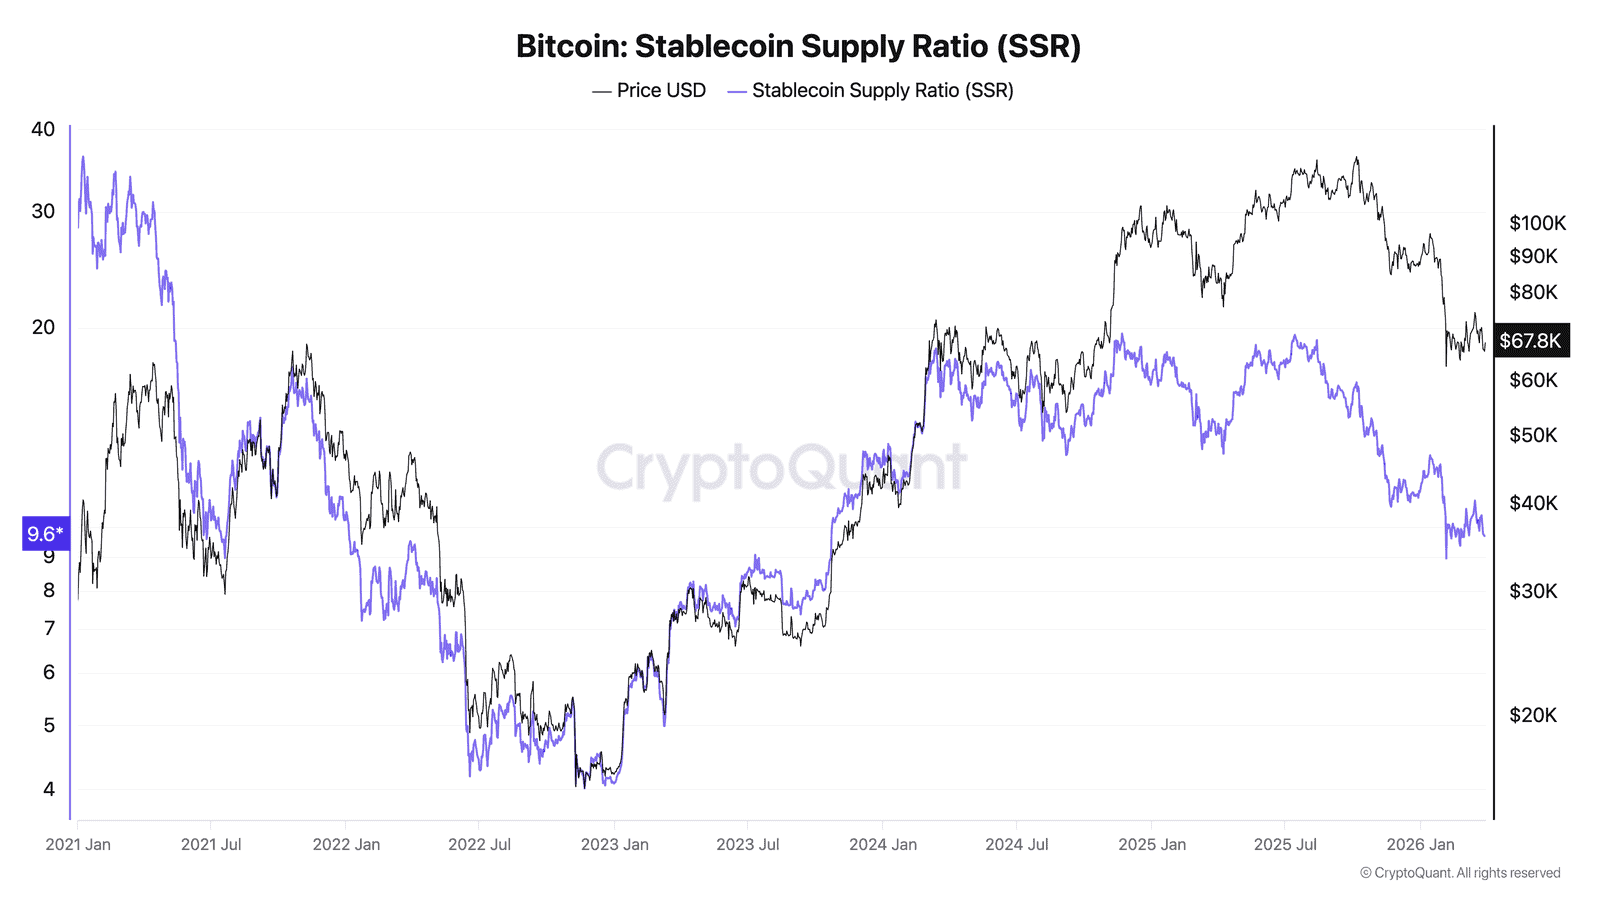
Look at the Stablecoin Supply Ratio. SSR dropped from 10.32 on March 23 to 9.68 on March 29. That’s a 6.2% decline in seven days. Lower SSR means more stablecoin purchasing power relative to Bitcoin’s market cap.
Do the math: BTC market cap of $1.346 trillion divided by SSR of 9.68 equals roughly $139 billion in stablecoin dry powder. That capital is parked. It hasn’t rotated into BTC yet. But it’s there, and it’s growing relative to Bitcoin’s shrinking valuation.
The last time SSR dropped this fast while NUPL approached capitulation? November 2022, right after FTX imploded. BTC bottomed at $15,500 within three weeks.
Miners Bleeding, Traders Leveraging Up
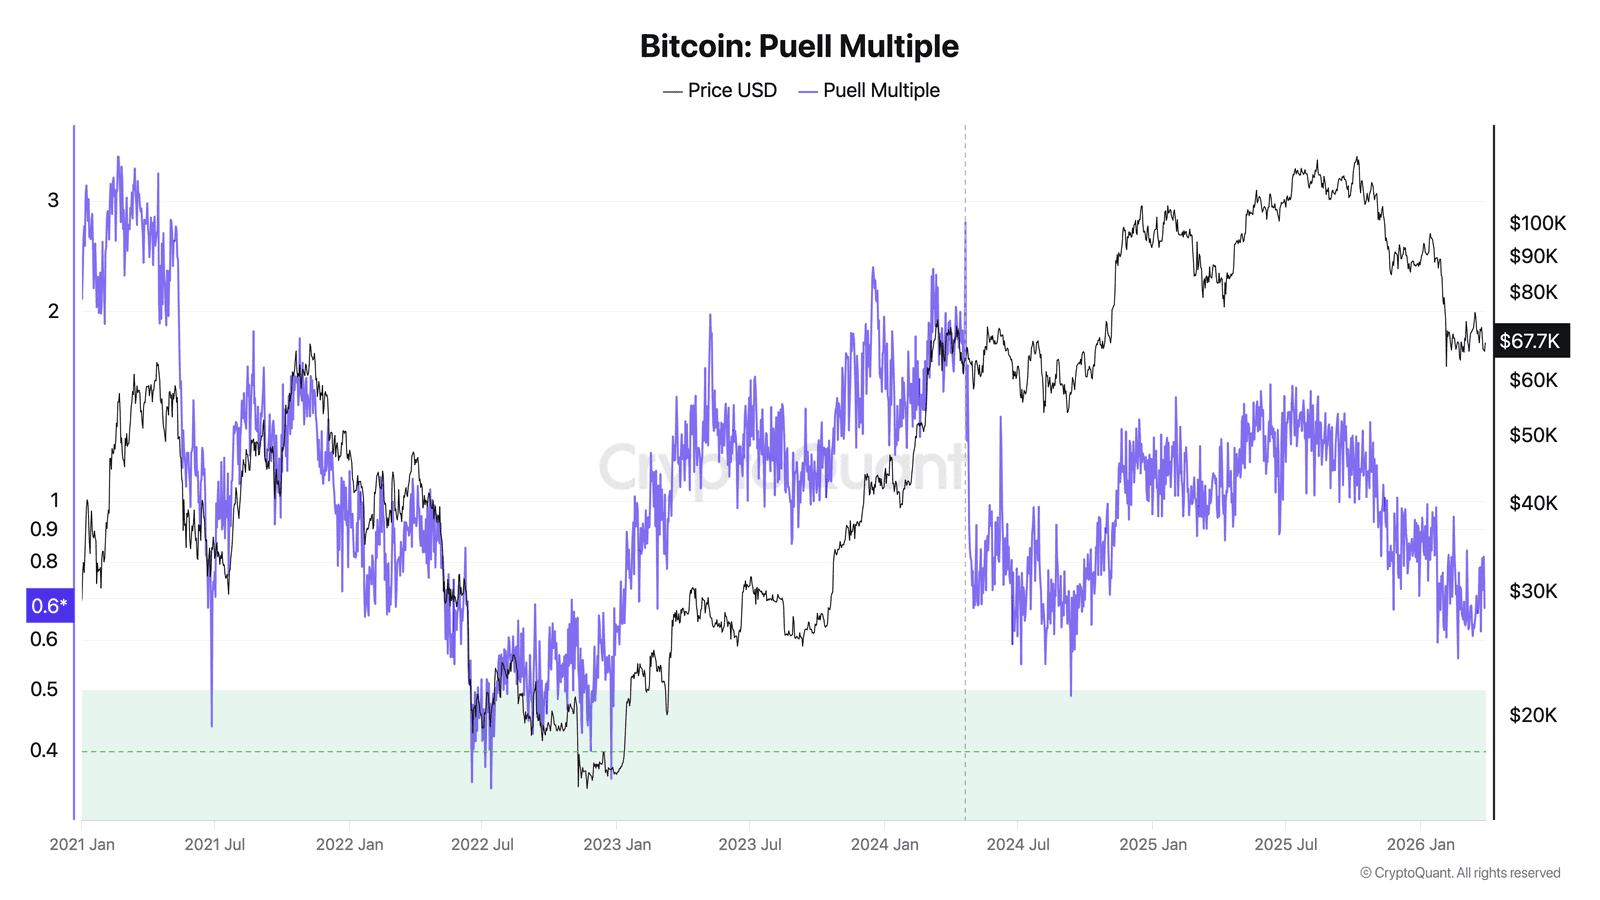
The Puell Multiple fell to 0.675 — well below 1.0, signaling miners earn significantly less revenue than their annual average. At current difficulty levels, production cost per BTC exceeds $86,000 for most public miners. They’re selling at $67K. That’s a $19,000 loss per coin produced, a dynamic we covered last week.
And traders? They’re doing the opposite of what you’d expect in a bleeding market. Estimated leverage ratio climbed from 0.211 on March 23 to 0.236 — a 12% increase in seven days. More leverage during a loss-making market is a recipe for a liquidation cascade. Or a violent short squeeze. Probably both.
ETF institutional holders shed 5,978 BTC over the past week, bringing total holdings to 1,318,733 BTC. Not panic selling, but a steady drip of redemptions that shows institutions aren’t rushing to buy this dip — at least not yet.
What the Divergence Tells Us
Strip away the noise and two metrics are screaming at each other. NUPL trends toward capitulation — the market is running out of unrealized profit. SSR trends toward maximum buying power — stablecoins are piling up.
This divergence has appeared exactly three times in Bitcoin’s history: March 2020, November 2022, and now. Both previous instances marked generational bottoms. That doesn’t guarantee anything — but it means the setup is forming whether or not the market recognizes it.
Support levels to watch: $66,000 (current range floor), $64,000 (200-day moving average), and $54,233 (realized price — the nuclear option).
Resistance sits at $67,500 (local high), $70,000 (psychological), and $72,000 (pre-selloff level from March 25).
“Bitcoin near or at the bottom of its correction,” said CryptoQuant CEO Ki Young Ju in a March 28 post on X. “But the question is timing. The market can stay irrational longer than bears expect.”
If SSR keeps declining while NUPL crosses below 0.1, expect violent repricing — in either direction. The $139 billion in stablecoins won’t sit on the sidelines forever.
This analysis is part of our daily Bitcoin price tracking. See all previous analyses and key metrics on our hub page.
This is not financial advice. DYOR. Data as of March 30, 2026.
Sources
- CoinGecko Bitcoin data: coingecko.com/en/coins/bitcoin
- CryptoQuant NUPL: cryptoquant.com
- CryptoQuant SOPR: cryptoquant.com
- CryptoQuant Exchange Netflow: cryptoquant.com
- CryptoQuant SSR: cryptoquant.com
- CryptoQuant Puell Multiple: cryptoquant.com
Leave a Reply