
🕑 6 min read
BTC climbed $6,000 in one week, but the on-chain damage from 14 days of seller losses runs deeper than the price chart shows.
$6,000 in seven days. Bitcoin jumped from $66.9K to $72,201 as of Thursday morning – and somehow, nobody seems impressed.
The Fear & Greed Index still reads 11. That’s 49 consecutive days in Extreme Fear, the longest streak since the 2022 bear market. And yet BTC keeps grinding higher, quietly posting its best weekly gain since late February.
This bitcoin price analysis digs into why the rally isn’t getting credit – and what the on-chain data says about who’s actually accumulating.
SOPR barely crossed 1.0 – and long-term holders are still bleeding
BTC rallied 8%. Sellers should be celebrating.
They’re not.
SOPR, the metric that tracks whether coins move at a profit or loss, just barely crossed 1.0 on April 9 – landing at 1.00006. That’s not a recovery. That’s a flatline. For the previous 14 days, SOPR sat below 1.0, which meant that every single day for two solid weeks the average Bitcoin seller was locking in a loss – a streak we haven’t seen since the depths of the FTX collapse in November 2022.
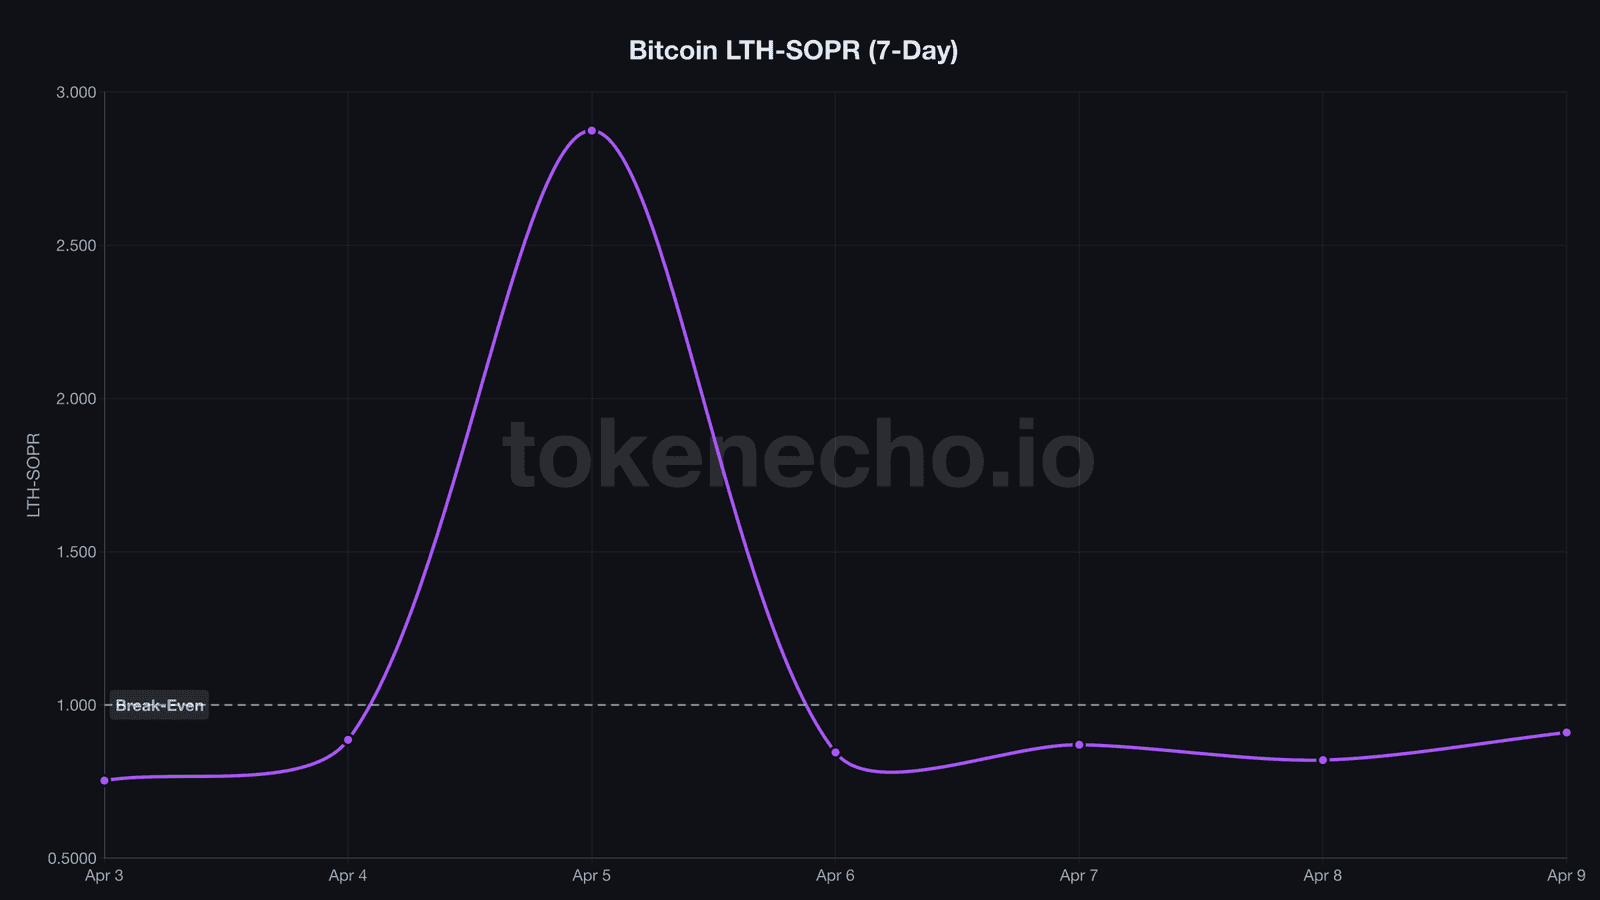
But the uglier picture sits with long-term holders. LTH-SOPR, which isolates coins held for 155+ days, printed 0.910 on April 9. Long-term holders who sold that day took a 9% loss on average – even with BTC at $72K.
One day earlier? LTH-SOPR hit 0.820. An 18% haircut.
You hold Bitcoin for five months, watch it crash 43% from $126K, and when you finally sell into an 8% relief rally – you’re still underwater. That’s the kind of damage that doesn’t heal in a week.
Traders watching this breakeven zone will note that the last time SOPR oscillated around 1.0 for this long was late 2022, right before BTC’s January 2023 rally from $16K to $25K.
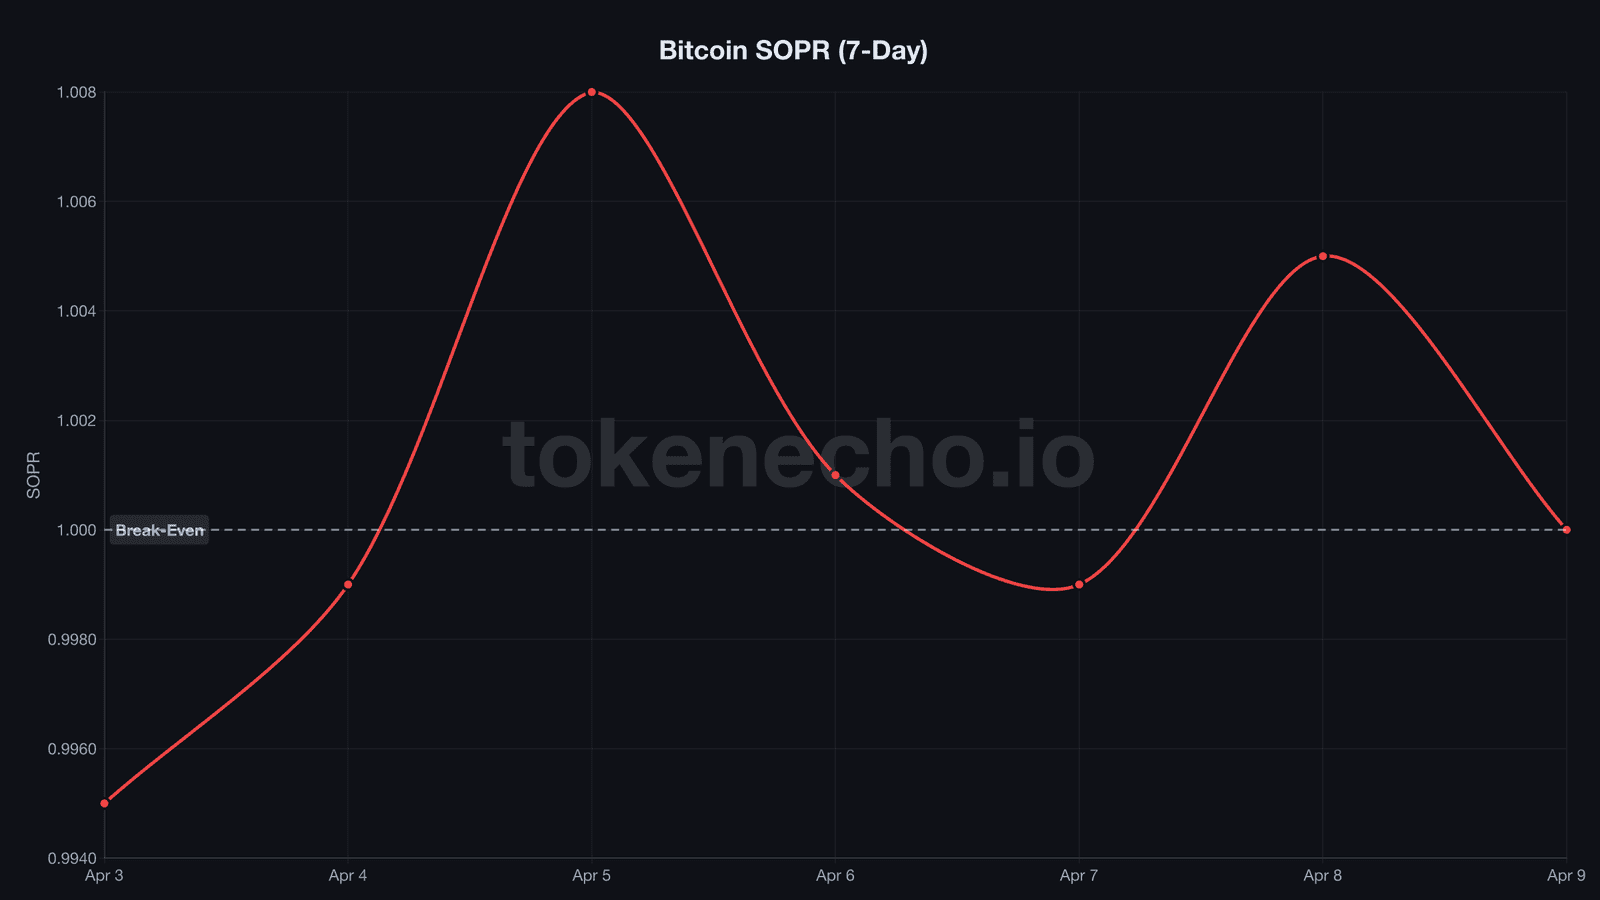
It’s the financial equivalent of a patient whose vital signs stabilize but who hasn’t opened their eyes yet. The bleeding stopped. Recovery? Not yet.
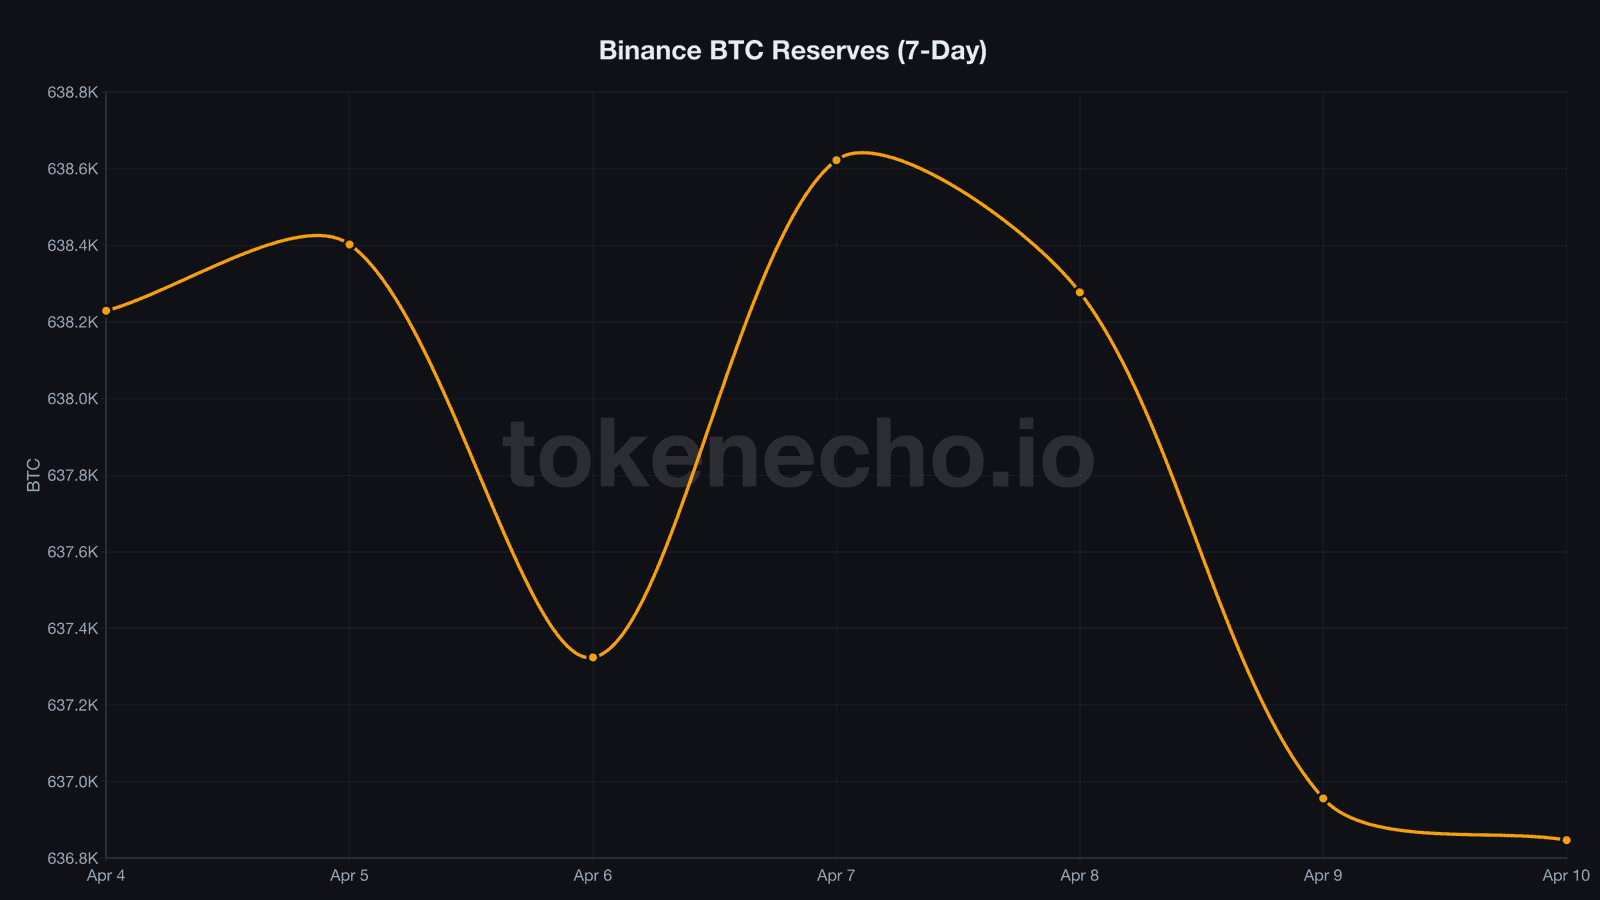
1,775 BTC quietly left Binance in three days
1,775 BTC. Roughly $128 million.
That’s how much Bitcoin left Binance between April 8 and April 10 – and it barely made a headline. Binance reserves dropped from 638,622 BTC on April 7 to 636,847 BTC by Thursday morning. Coins leaving exchanges typically signals accumulation: somebody’s moving BTC to cold storage, not preparing to dump.
So who’s doing the buying?
CDD, the metric tracking how many coin-days are destroyed when dormant coins move, stayed subdued at 6.4 million on April 9. Well below the supply-adjusted average. Old coins aren’t budging.
MVRV, the ratio comparing market value to realized value, climbed from 1.237 on April 3 to 1.326 by April 9. Still modest – at the October 2025 ATH, MVRV sat above 2.29 – but the direction is unmistakable.
What caught our attention: roughly 2,140 whale addresses accumulated 270,000 BTC – about $23 billion – over the past 30 days. Harvard’s endowment increased its BlackRock IBIT position by 257%, making it the fund’s largest disclosed U.S. equity holding at $442.8 million.
Smart money doesn’t buy into panic unless it sees something the crowd doesn’t.
Wall Street calls this a “wall of worry.” Price grinds higher while everyone expects collapse. Historically, it ends one of two ways: the worry was right, or the skeptics capitulate and buy. No third option.
49 days of Extreme Fear, and the price keeps climbing
The last time the Fear & Greed Index stayed below 25 for this long was during the Terra/Luna implosion in mid-2022. BTC sat at $20K then. Nine months later, it had doubled.
Today the index reads 11. An Iran ceasefire on April 7 sent BTC surging past $72K and triggered $425 million in short liquidations – but the mood barely shifted. Two days later, the rally cooled to +1.5% as Iran cited “technical limitations” to reopening the Strait of Hormuz.
“Bitcoin is in a bear market that could extend through the third quarter of 2026. First of all, you have to accept this – we are in a bear market. So plan accordingly,” said Julio Moreno, Head of Research at CryptoQuant.
He’s not wrong about the macro picture. But something is happening beneath the headlines.
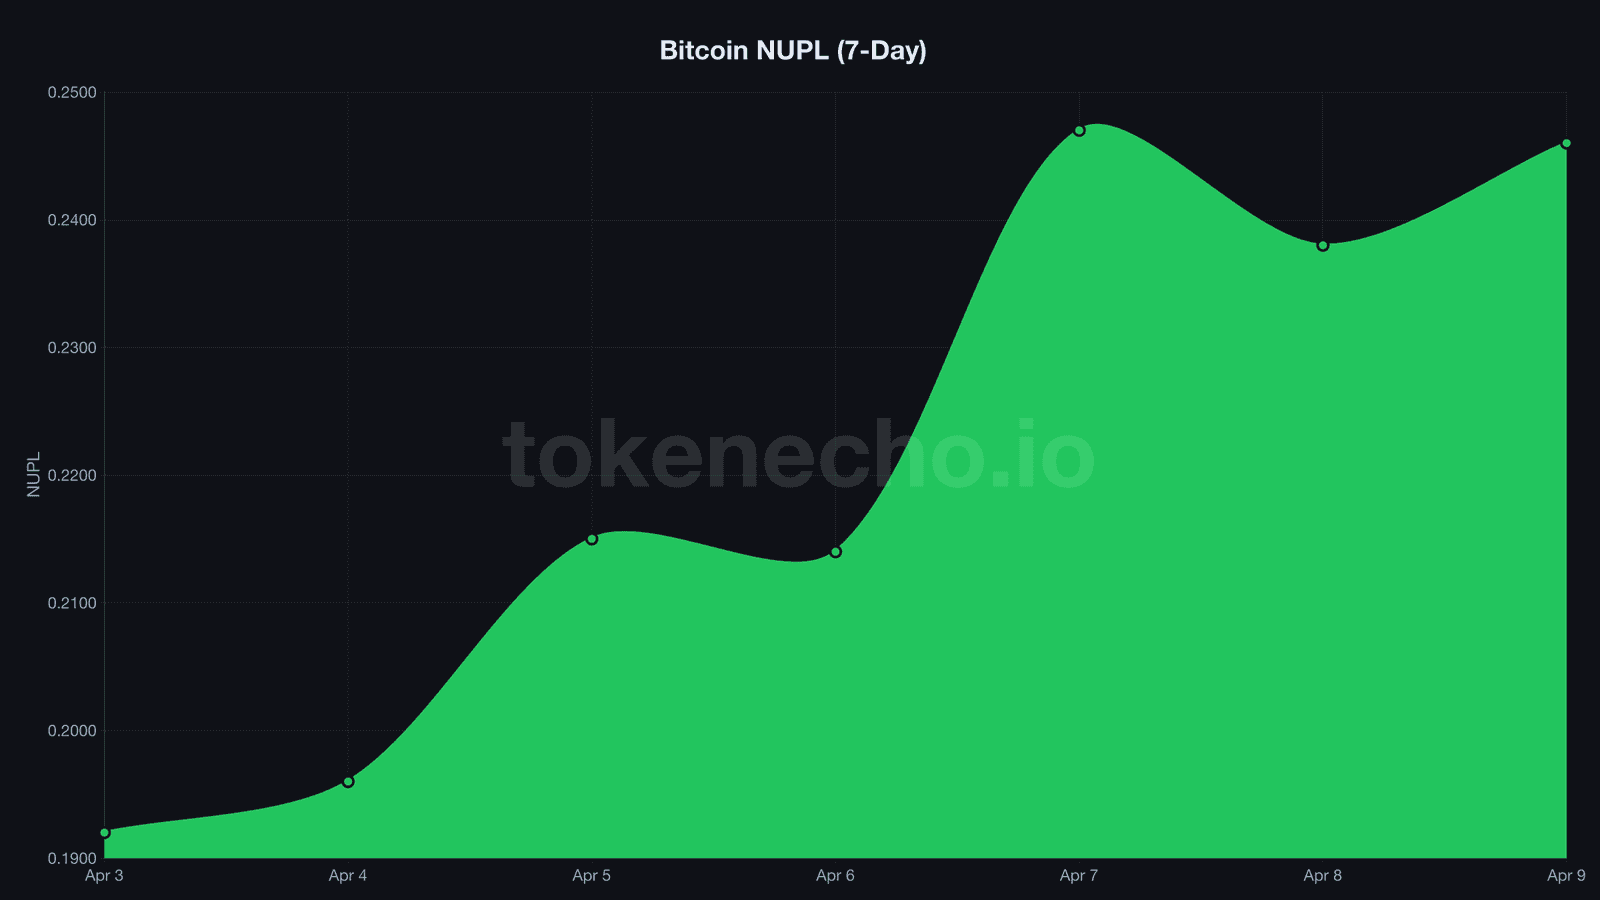
NUPL, the metric measuring aggregate unrealized profit and loss across the network, recovered from 0.192 on April 3 to 0.246 by April 9. That’s a jump from the edge of capitulation back into the hope/fear boundary. Not euphoria – but the direction matters.
ETF flows tell a split story. April 6 brought $471 million in inflows – the strongest single day since February. Then institutions sold into the rally: -$159 million on April 7, -$125 million on April 8.
Morgan Stanley launched its MSBT fund on April 8 with a rock-bottom 0.14% fee that undercuts BlackRock’s IBIT at 0.25%, pulled in $33.9 million on its very first day, and gave 16,000 financial advisors across its wealth management network direct access to offer Bitcoin exposure to their clients.
“If the conflict were to de-escalate, the immediate effect would likely come through lower oil prices and reduced inflation pressure, increasing the probability of easier monetary policy, which tends to support Bitcoin,” said James Butterfill, Head of Research at CoinShares.
And one bearish flag that shouldn’t be ignored: ETFs bought aggressively on April 6 but flipped to sellers the next two days, dumping $284 million into the rally. If institutional conviction were real, you’d expect sustained inflows – not a one-day spike followed by profit-taking.
The Puell Multiple, which compares daily miner revenue to its yearly average, rebounded from a cycle low of 0.571 on April 4 to 0.730. Miners still earn 27% below their 365-day average – but the worst squeeze appears over.
If SOPR holds above 1.0 for a sustained period while exchange outflows continue, the setup rhymes with January 2023 – when BTC broke out of a prolonged sub-1.0 SOPR range and rallied 56% in two months. But if sellers flood back below break-even and ETF outflows persist, $70K becomes a ceiling rather than a floor.
The key threshold: MVRV reclaiming 1.5 while Fear & Greed exits single digits. Until both flip, this remains a rally built on thin ice – the bears are exhausted but the bulls haven’t shown up.
This analysis is part of our daily Bitcoin price tracking. See all previous analyses and key metrics on our hub page.
Sellers just broke even for the first time in two weeks. Whales keep stacking. Something has to give – and 49 days of fear says the breaking point is close.
This is not financial advice. DYOR. Data as of April 10, 2026.
Sources:
- CoinGecko API – BTC price, market cap, ATH data (accessed April 10, 2026)
- CryptoQuant API – SOPR, LTH-SOPR, MVRV, NUPL, CDD, Puell Multiple, Binance exchange reserves and netflow (accessed April 10, 2026)
- CoinShares Weekly Digital Asset Flows report – ETF flow data
- Alternative.me – Crypto Fear & Greed Index
Leave a Reply