
🕑 6 min read
Yesterday, Bitcoin surged past $72K on the Iran ceasefire and Morgan Stanley’s ETF launch. Twenty-four hours later, that ceasefire is unraveling – Israel hit Lebanon with 50 fighter jets, killing 254 people, and Iran is threatening to re-close the Strait of Hormuz.
BTC barely flinched. Down 0.27%.
That disconnect between the headlines and the price chart isn’t random. The on-chain structure under $71K has quietly shifted over the past week – and today’s bitcoin price analysis shows why this market refuses to crack.
A ceasefire, 254 dead in Lebanon, and $71K that won’t budge
Bitcoin trades at $71,445 as of Wednesday morning. Tight range – $70,522 to $72,698. Weekly gains sit at a healthy 7.54%, though the 30-day picture is essentially flat at 0.55%.
The geopolitical backdrop, on the other hand, is a train wreck.
Trump’s ceasefire lasted exactly one news cycle before Israel’s Lebanon offensive torpedoed the agreement. Iran warned it would withdraw. Two Chinese oil tankers are approaching Hormuz right now, testing whether the passage is actually open. And 800 ships remain trapped in the waterway, per Bloomberg.
Then came the tariff threat: 50% on any country supplying weapons to Iran, “effective immediately.” “There’s no immediate policy lever and authorisation available for the US,” said Rachel Ziemba, adjunct senior fellow at the Center for a New American Security. The Supreme Court killed IEEPA tariff authority back in February – so for now, it’s a tweet, not a policy.
Through all of this, BTC moved a third of one percent. We’ve seen this before. Last April, “Liberation Day” tariffs wiped $6.6 trillion off global markets and BTC cratered 10.4% in a single session. Within six weeks, it rallied 50% to all-time highs above $111,000. The pattern isn’t that Bitcoin ignores bad news – it’s that Bitcoin absorbs shocks faster than most people expect.
Sellers stuck at breakeven for four days – and can’t break free
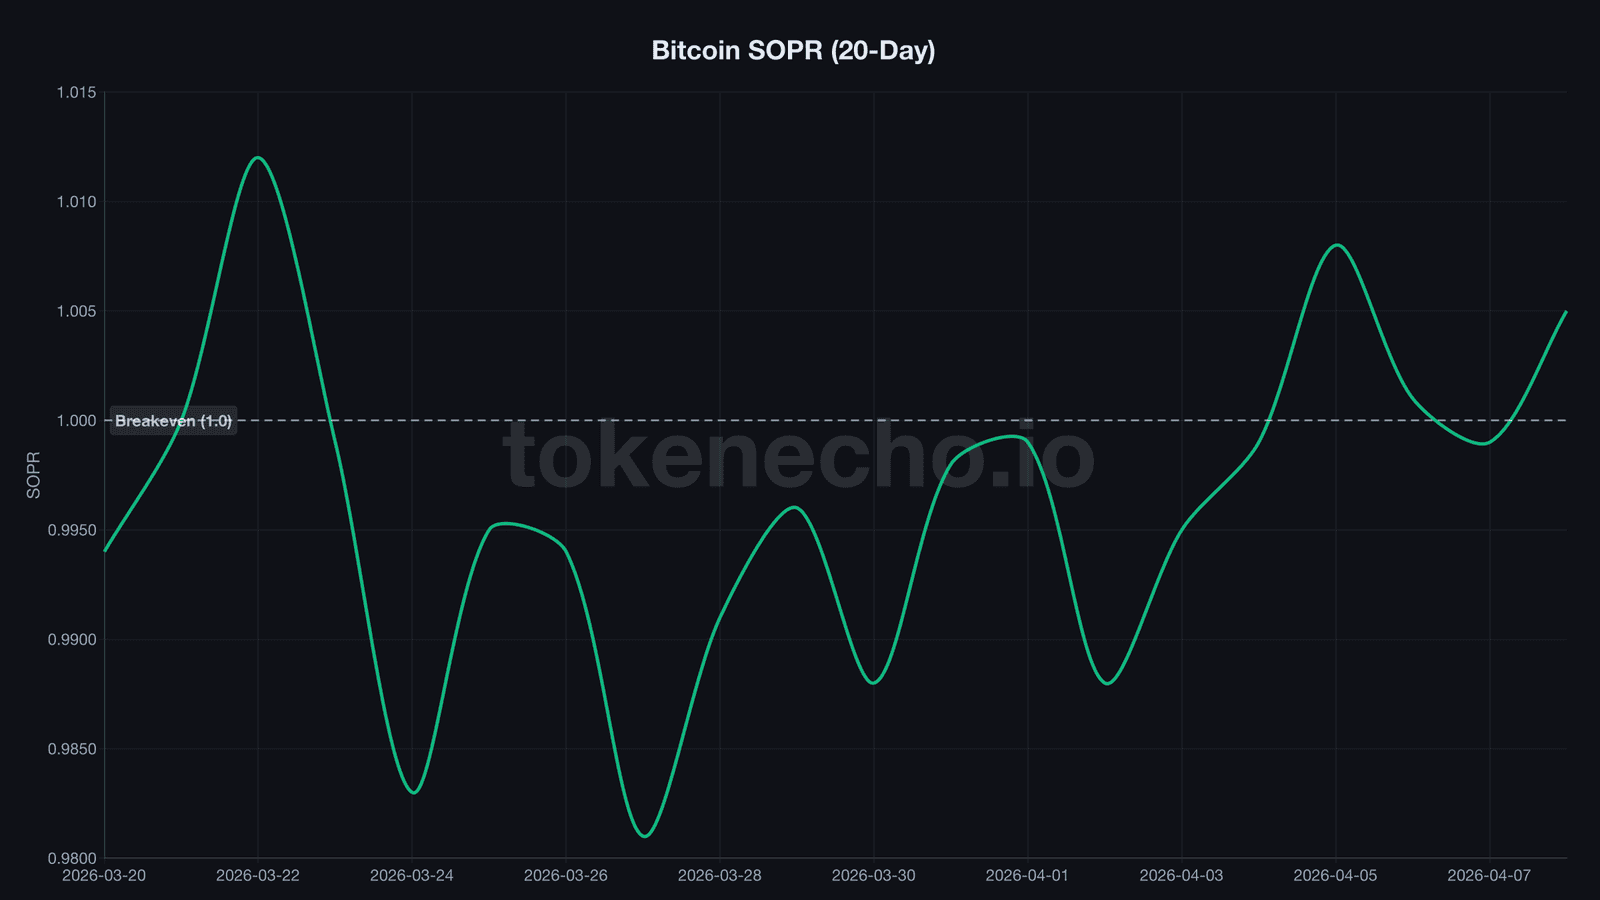
SOPR, the ratio that measures whether Bitcoin sellers are booking profits or losses on each transaction, crossed above 1.0 on April 5 for the first time since March 22. That snapped a 13-day losing streak – the longest uninterrupted stretch since FTX collapsed in November 2022.
But it hasn’t held cleanly. That’s what caught our attention.
April 5: SOPR hit 1.008, the first gasp above breakeven after nearly two weeks underwater. April 6: 1.001 – barely above the line.
Then April 7 dragged it back to 0.999. And yesterday, 1.005 again. Four days of sellers vibrating on the exact edge between profit and loss.
Why does that matter? When SOPR oscillates at 1.0 after a prolonged dip below, the selling pressure has typically exhausted itself. The sellers who wanted out already took their losses during those 13 grinding days. Whoever remains won’t part with their coins below cost basis.
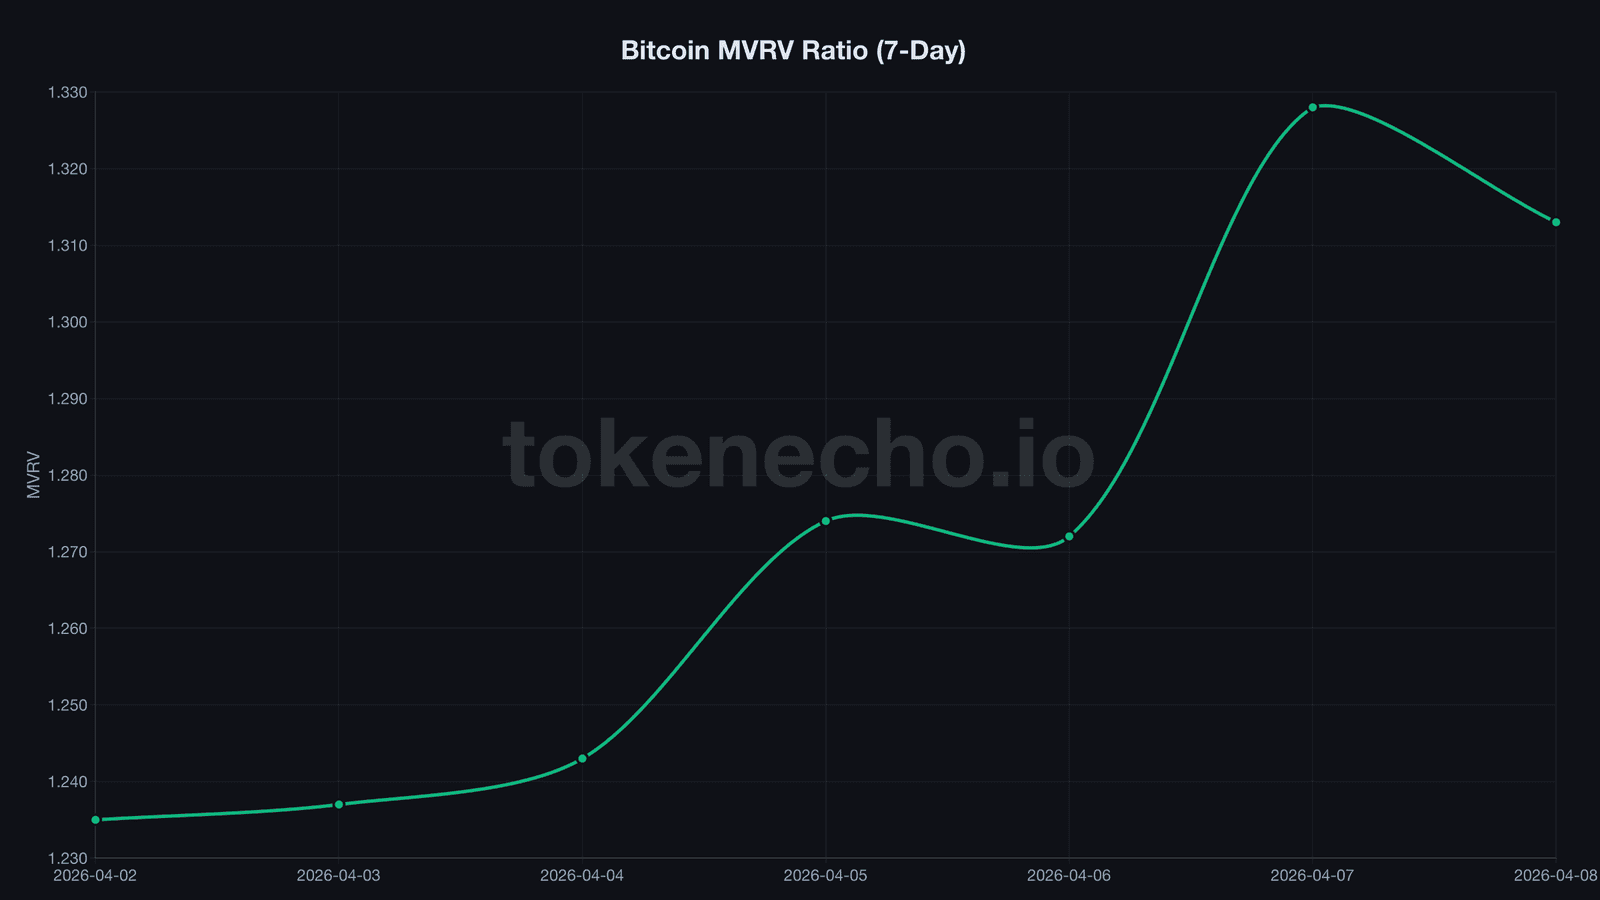
MVRV, which compares Bitcoin’s market cap to its realized value – essentially the network’s aggregate cost basis – climbed to 1.313 on April 8. That’s up from 1.235 just a week ago.
A 6.3% jump in a metric that rarely moves fast is the clearest sign yet that average holder profit margins are finally widening.
CDD, a measure of how many “coin-days” are destroyed when long-held BTC moves, collapsed from 14.8 million on April 5 to 4.3 million by April 8. Long-term holders made their move during the ceasefire spike. And then they went quiet.
The old coins aren’t moving.
Thirteen rounds of body shots. The fighter’s still standing, hasn’t thrown a knockout punch – but the bleeding stopped. What happens next depends on whether the bell rings or the referee steps in.
The structural floor under $71K – and the crack that could break it
So what’s actually holding this price level?
Leverage, for starters. The estimated leverage ratio sits at 0.226, down from the 0.240 peak in late March – a decline that means traders have spent two full weeks unwinding leveraged positions, systematically reducing the risk of a cascading liquidation event. A deleveraged market doesn’t cascade. It absorbs.
Exchange reserves are flat at 2.706 million BTC. No panic selling into the rally. No massive withdrawals either. The supply side is neutral – just waiting.
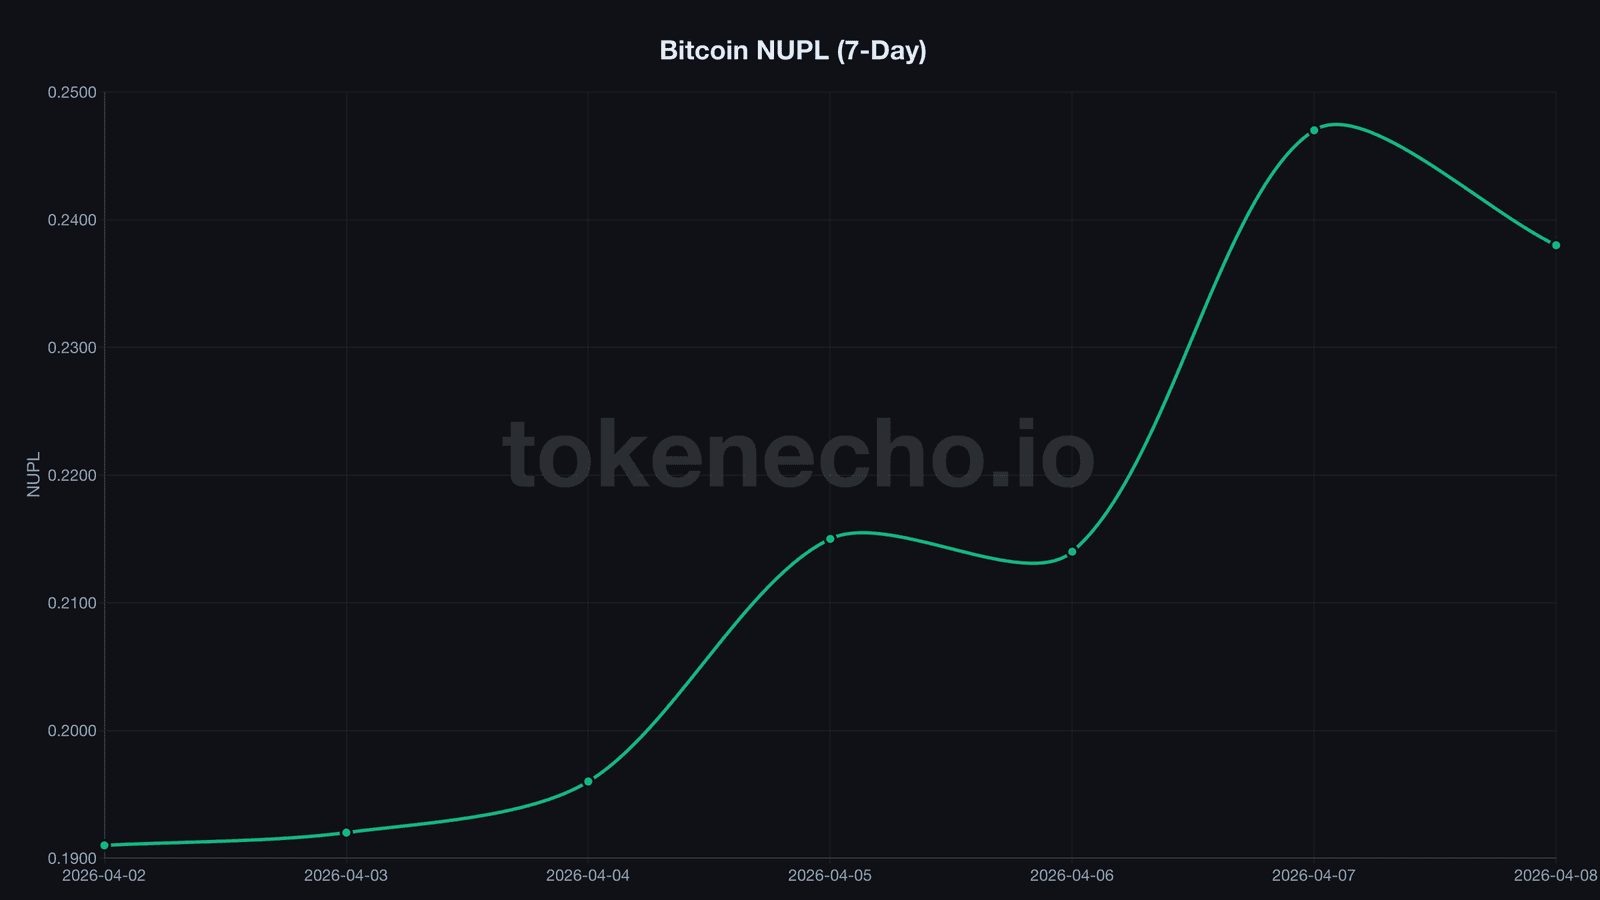
NUPL, a measure of aggregate unrealized profit and loss across the network, recovered to 0.238 from its 0.190 low two weeks ago – the closest Bitcoin had come to full capitulation since the FTX collapse. The recovery isn’t dramatic, but the direction matters. NUPL is pulling away from the danger zone, not sliding into it.
Institutional flows are backing up the on-chain picture. Spot Bitcoin ETFs attracted $471 million on April 6 – the sixth-largest single-day inflow of 2026. Not exactly capitulation behavior.
And then Morgan Stanley lit the fuse. The bank’s MSBT fund launched April 8 at 0.14%, undercutting BlackRock’s IBIT by 44% and becoming the cheapest spot BTC ETF on the market. Behind that fee sits 16,000 financial advisors and $6.2 trillion in client assets – a distribution pipeline that didn’t exist a week ago.
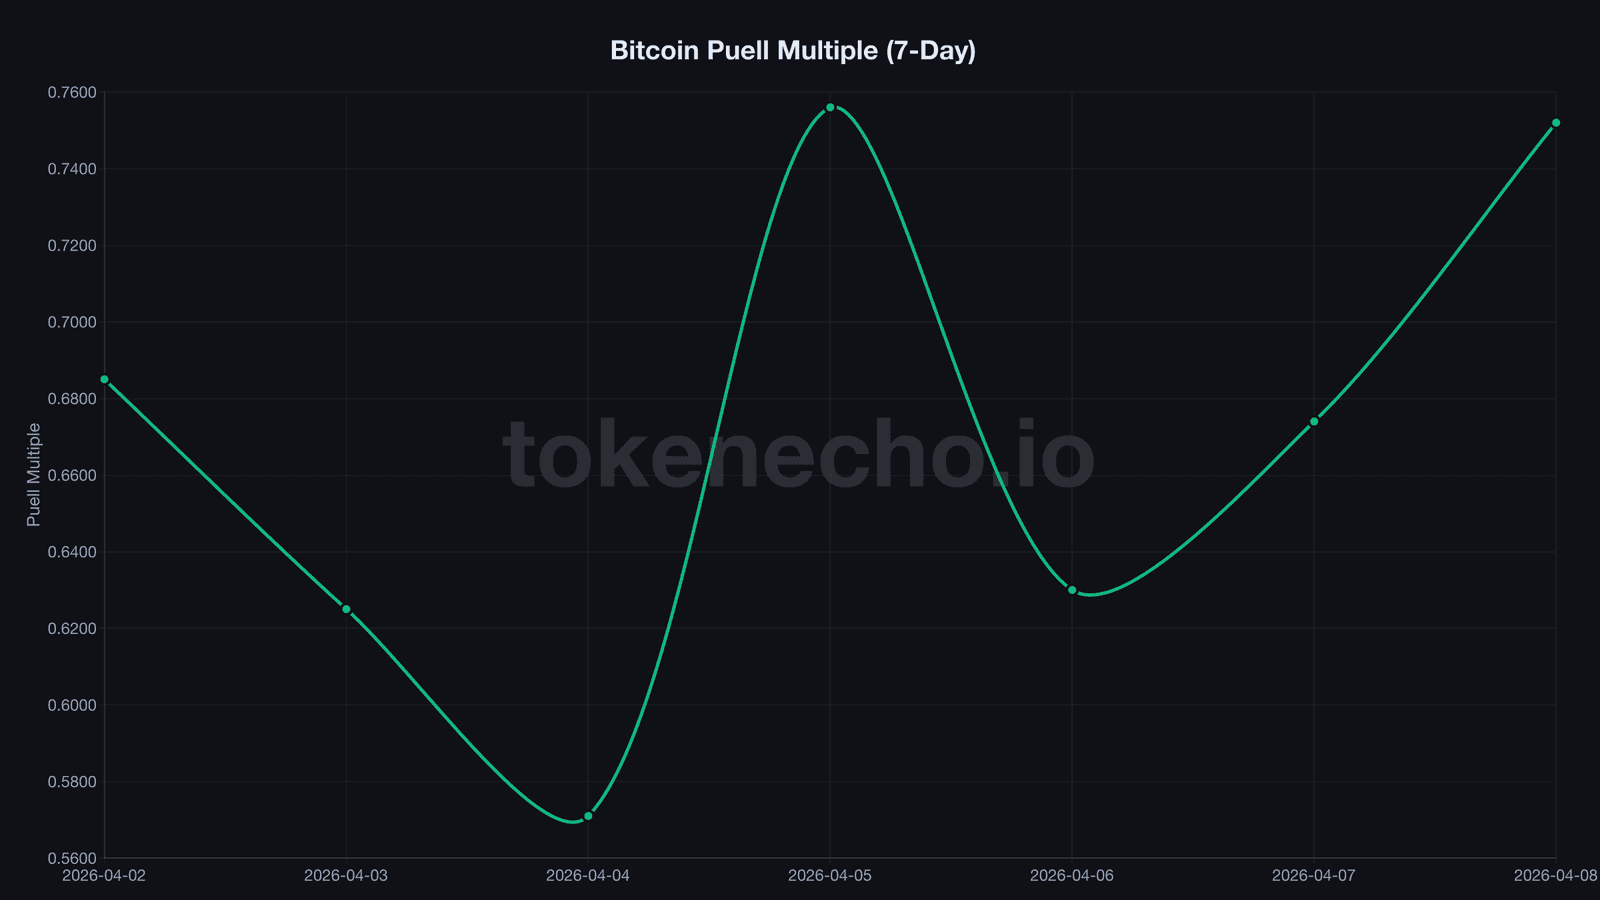
The Puell Multiple, which measures miner revenue relative to its yearly average, bounced to 0.752 from a cycle low of 0.571 on April 4. Miners aren’t thriving. But they’ve stopped hemorrhaging – and the last time Puell recovered from sub-0.6 territory was early 2023, before BTC tripled over the following six months.
Now the crack. Fear & Greed still reads 14, locked in Extreme Fear for 48 straight days – the longest such streak since mid-2022. Can markets stay fearful longer than investors can stay solvent? History says yes. And with Hormuz potentially re-closing, oil whipsawing, and a ceasefire that lasted shorter than a Bitcoin block confirmation, the macro catalysts for a sustained breakout aren’t here yet.
If CDD spikes again – if long-term holders start dumping rather than sitting – that’s the trap door under this floor.
Support: $70,500 / $68,600 / $66,000. Resistance: $72,700 / $74,500 / $76,000.
If SOPR holds above 1.0 through the tariff noise and Hormuz re-closure threats, the 13-day capitulation streak becomes a confirmed bottom – rhyming with November 2022, a period that preceded a 300% rally taking BTC from $16,000 to its eventual all-time high near $73,000. But if sellers slip back below breakeven while CDD climbs, the $66K floor from early April comes back into focus fast.
This analysis is part of our daily Bitcoin price tracking. See all previous analyses and key metrics on our hub page.
SOPR is fighting the breakeven line. Institutional money is pouring in. But the ceasefire just died – and the market hasn’t fully priced that in yet. Which force breaks first defines the rest of April.
This is not financial advice. DYOR. Data as of April 9, 2026.
Sources
- CoinGecko Bitcoin API data (accessed April 9, 2026)
- CryptoQuant: SOPR, MVRV, NUPL, Puell Multiple, CDD, exchange reserves, leverage ratio (accessed April 9, 2026)
- Bloomberg: “Shipowners eye Hormuz ceasefire window for 800 trapped vessels” (April 8, 2026)
- CoinDesk: “Morgan Stanley’s bitcoin ETF draws $34M on day one” (April 8, 2026)
- Al Jazeera: “Israeli attacks across Lebanon kill at least 254” (April 8, 2026)
Leave a Reply