
🕑 6 min read
Forty-six straight days of extreme fear – and Bitcoin still holds $68,500. The sellers might be the ones running out of time.
Forty-six consecutive days. That’s how long the Bitcoin Fear & Greed Index has sat in “Extreme Fear” territory – the longest unbroken stretch since the 2022 crypto winter that followed FTX’s collapse. Back then, with the index at 6, Bitcoin traded at $17,800.
Today it reads 11. And BTC sits at $68,500.
Something doesn’t add up. Either the fear is manufactured, or the price is lying. The on-chain picture points squarely at the former – and Monday’s bitcoin price analysis reveals a market where the sellers, not the buyers, are running out of ammunition.
$197M in shorts liquidated – and the fear index didn’t flinch
Iran threw markets a curveball on Monday. Reports of a 45-day ceasefire proposal pushed BTC briefly to $70,243 – its highest print since March 25. Shorts got obliterated.
$196.7 million in short positions evaporated overnight.
That’s nearly three times the long-side damage – the kind of lopsided wipeout that usually clears overleveraged bears for weeks. But Iran rejected the ceasefire within hours, and Bitcoin slid back to $68,500.
What’s remarkable isn’t the spike or the rejection. It’s what DIDN’T happen afterward. The Fear & Greed Index barely moved – still 11, still extreme. The estimated leverage ratio, a gauge of how much borrowed money sits in derivatives relative to exchange reserves, held steady at 0.226. No panic. No cascade.
It’s the financial equivalent of a building’s fire alarm blaring every morning for six weeks. At some point, people stop running for the exits – even if there’s actually smoke.
For context, the last sustained extreme fear streak of this magnitude ended in June 2022. Bitcoin was $17,800. Within seven months, it had doubled past $35,000. Fear of that duration tends to burn itself out – not because conditions improve, but because everyone who wanted to sell already has.
Long-term holders took 187% gains at $70K, then went dark
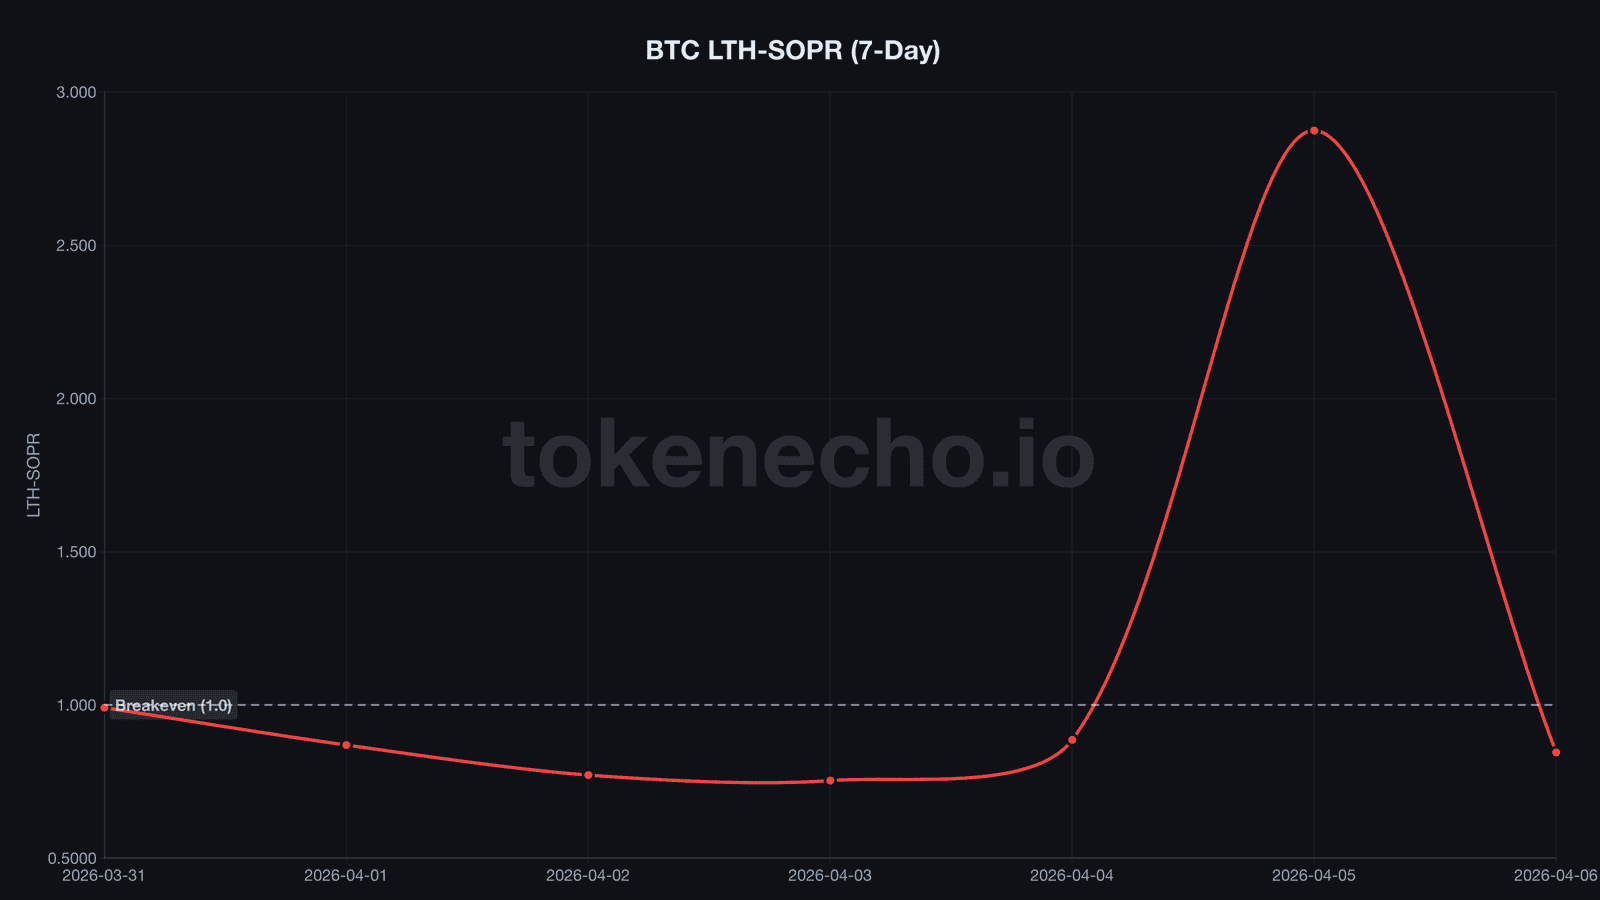
The last time LTH-SOPR, a metric tracking whether long-term holders sell at a profit or loss, swung this violently was the Luna collapse in May 2022. That crash took three days to unfold. This one? Twenty-four hours.
On April 5, LTH-SOPR printed 2.874. In plain English: the old coins moving that day sold at an average 187% profit. Someone – or many someones – cashed out at $70K and walked away.
By April 6, it crashed to 0.845. The coins moving now were underwater, 15.5% below their cost basis. The profitable supply had been exhausted in a single day.
CDD, coin days destroyed – a measure of how many old, dormant coins get spent – confirms the picture. It plunged from 14.8 million to 5.5 million overnight.
That’s a 63% collapse. The profit-takers are gone.
And what caught our attention: aggregate SOPR, the spent output profit ratio measuring whether the broader market sells at a profit or loss, sits at 1.001. Right at breakeven. As we covered in our previous analysis of the 13-day SOPR losing streak, SOPR crossing back above 1.0 marked a potential inflection.
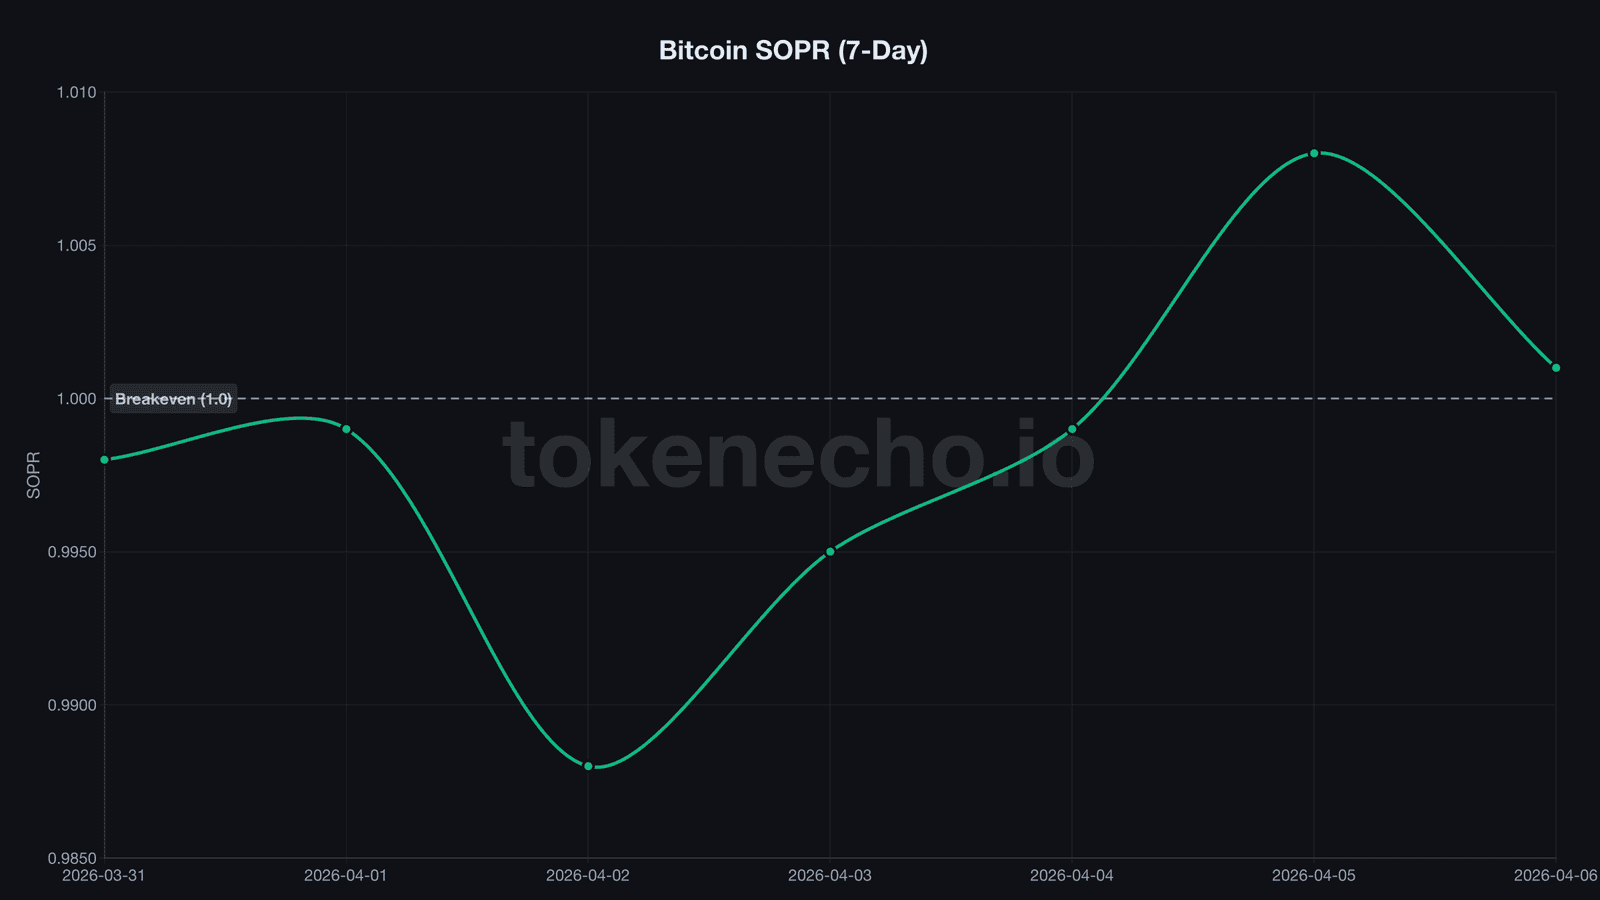
Now it clings to that line. Historically, when SOPR holds above 1.0 after a prolonged stretch below it, the worst of the selling is over. If it slips back under, that’s a different conversation entirely.
But seller exhaustion isn’t the same as buying pressure. The fire alarm stopped ringing. Nobody’s shown up with a hose yet.
Miners losing money on every block – but won’t let go
If Bitcoin miners can’t cover their electricity costs, why aren’t they dumping their reserves?
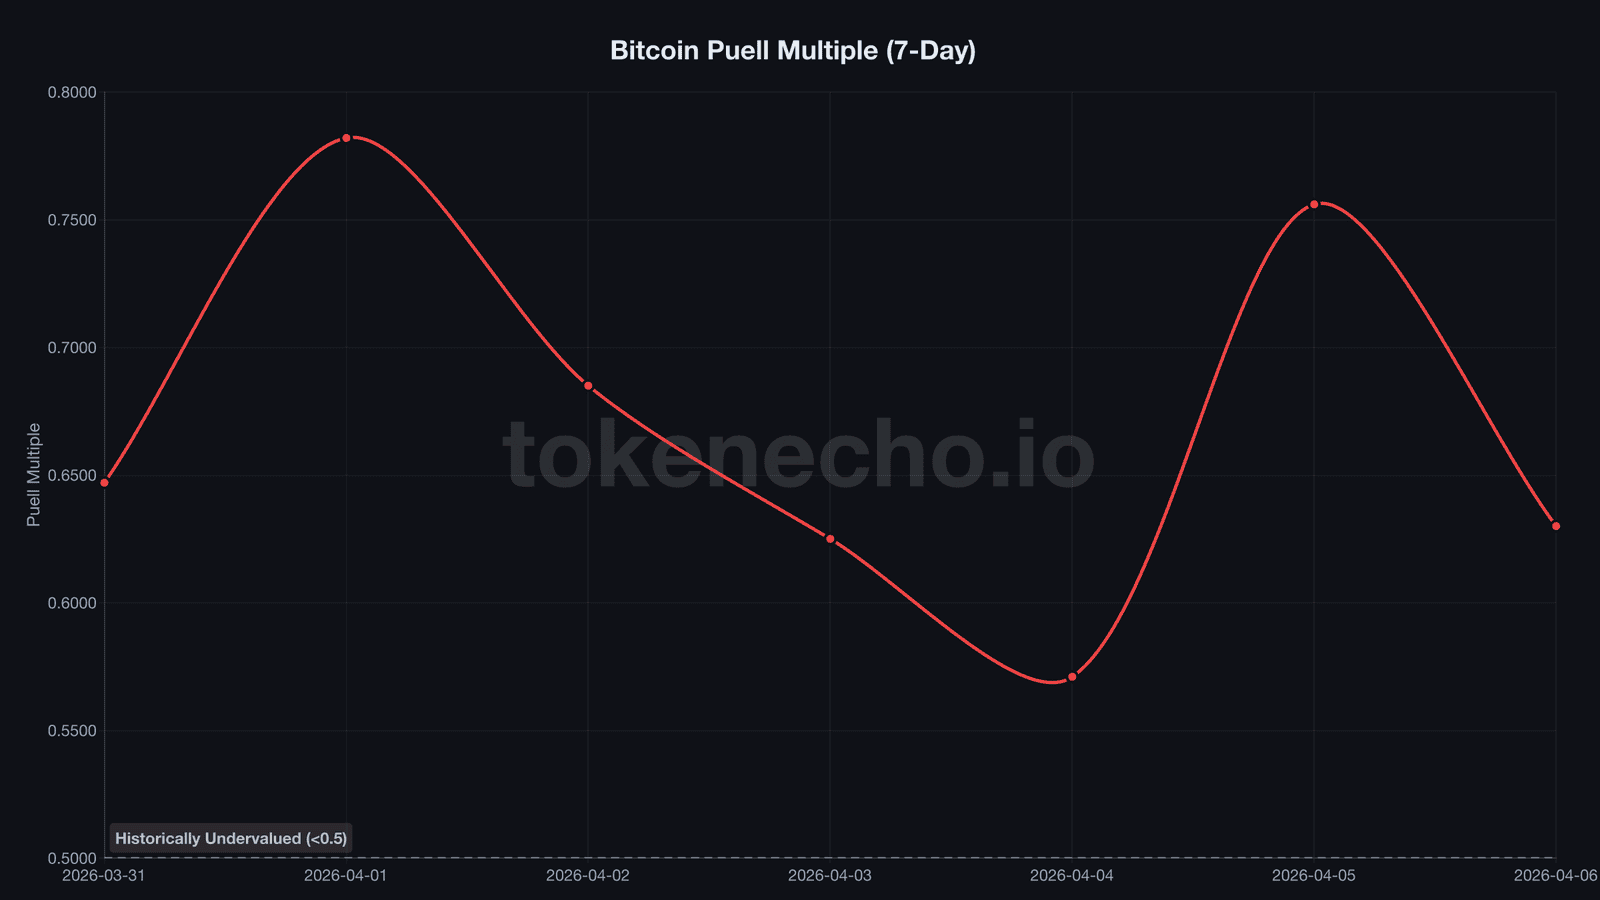
The Puell Multiple, which compares daily miner revenue to its 365-day moving average, dropped to 0.630 on April 6. That’s down from 0.756 just one day earlier – miners are earning roughly a third less than their yearly average per block.
At current difficulty levels, the average operation is dangerously close to breakeven.
Yet miner reserves sit at 1,804,797 BTC. Flat. Barely changed all week.
“2026 will be a tale of two halves,” said Tom Lee, head of research at Fundstrat. “The painful first half sets up the second-half rally.”
Miners seem to agree – they’re eating the losses rather than selling. That behavioral pattern last appeared in late 2022 before the post-FTX recovery. MVRV, the ratio between market value and realized value, reads 1.27. Bitcoin trades just 27% above its aggregate cost basis. That’s hardly euphoric – and historically, MVRV below 1.5 has marked accumulation zones, not distribution.
NUPL, net unrealized profit and loss, sits at 0.214. The market hovers in “hope” territory, barely above “anxiety.” Cycle tops typically push NUPL above 0.7. We’re nowhere close.
The $67K-$70K cage match that defines Q2
ETF flows paint the macro picture. April has logged just $69.6 million in net inflows – a fraction of March’s $1.32 billion.
The week ending April 2 barely scraped positive at $22.3 million. Institutional money isn’t fleeing, but it’s not exactly rushing in either.
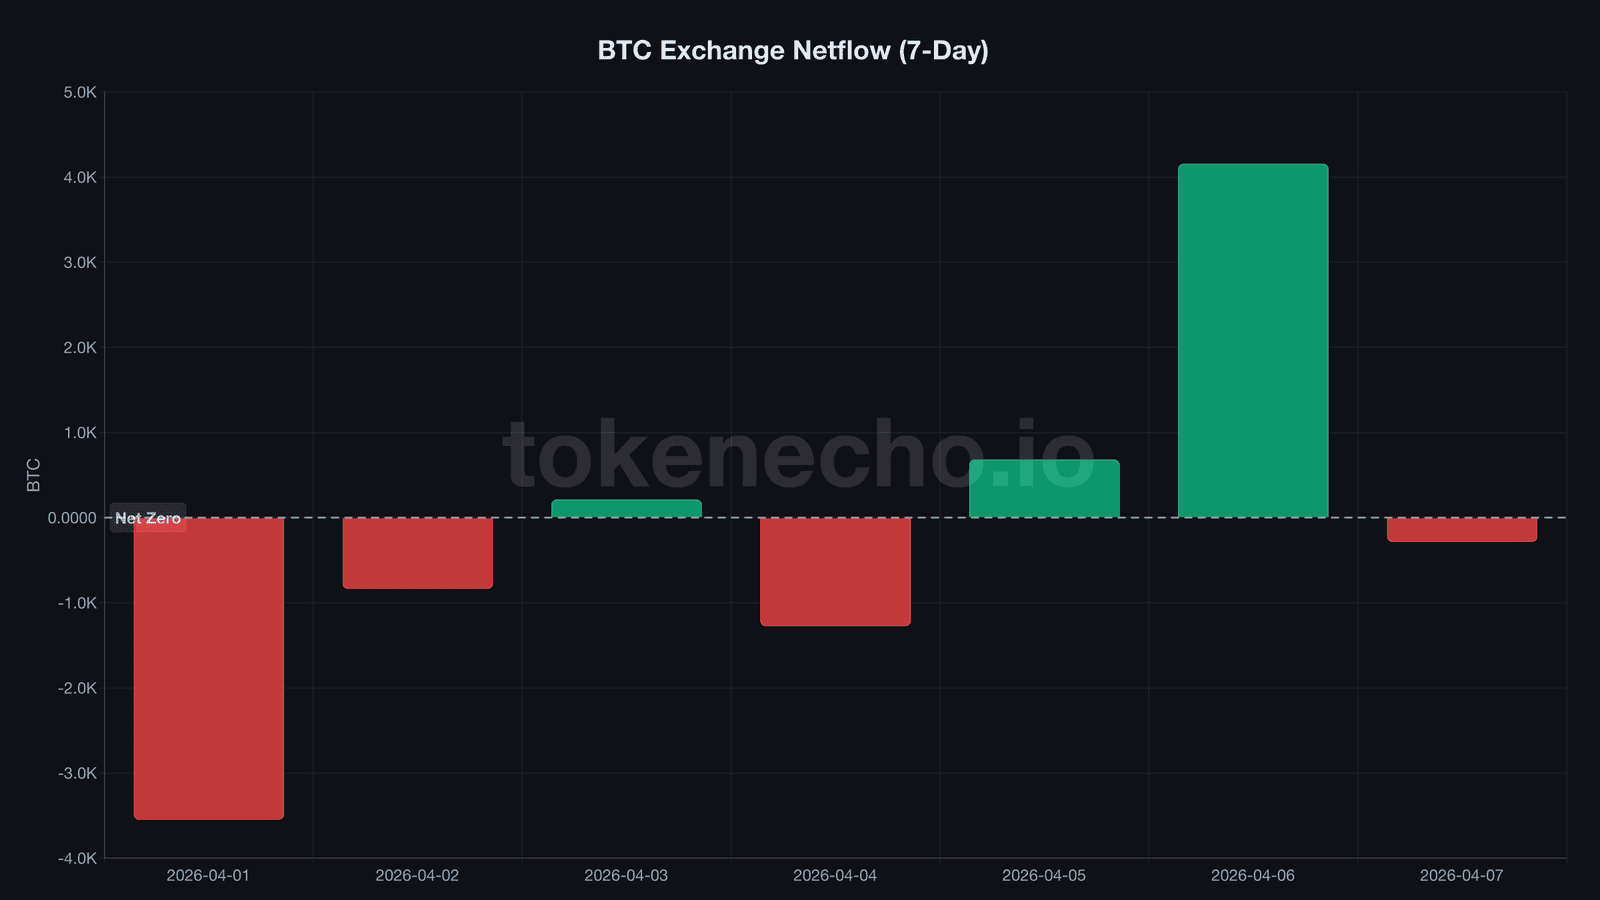
Exchange reserves tell a split story. Monday’s reading shows 2,709,050 BTC across all exchanges – essentially flat for the week, with large daily swings canceling each other out. A 3,549 BTC outflow on April 1 was offset by a 4,157 BTC inflow on April 6, likely tied to the $70K profit-taking wave.
Support: $68,000 (current floor, Monday low $68,382), $67,200 (weekly structure), $66,000 (multi-test base from early April).
Resistance: $70,000 (psychological wall + Monday rejection), $70,243 (intraday high), $72,000 (gap-fill target from the March breakdown).
If SOPR holds above 1.0 while MVRV stays compressed near 1.27, the setup rhymes with Q4 2022’s accumulation range. But a break below $66K with SOPR slipping under 0.98 reopens the path to $60K – a level Bloomberg Intelligence’s Mike McGlone has flagged as realistic if broader risk appetite collapses.
For a longer-term view of where BTC could head from these levels, see our Bitcoin price prediction through 2030.
The market hasn’t decided yet. But the shorts who tried to force the answer just lost $197 million learning that lesson.
This analysis is part of our daily Bitcoin price tracking. See all previous analyses and key metrics on our hub page.
Forty-six days of extreme fear, $197M in liquidated shorts, and a price floor that won’t crack. Either this base is real – or we’re about to find out what’s underneath it.
This is not financial advice. DYOR. Data as of April 7, 2026.
Sources
- CoinGecko API – BTC price, market cap, ATH, volume, supply
- CryptoQuant – SOPR, LTH-SOPR, MVRV, NUPL, Puell Multiple, CDD, exchange reserves, miner reserves, leverage ratio, exchange flows
- Alternative.me – Bitcoin Fear & Greed Index
- CoinGlass – Futures liquidation data
- Farside Investors – Bitcoin ETF flow data
Leave a Reply