
🕑 5 min read
Exchange deposits spiked 254% in one day as leverage rebuilds ahead of Trump’s Iran and tariff deadlines.
ETH fell 2.9% to $2,087 on Monday. That’s not what this Ethereum price analysis is about.
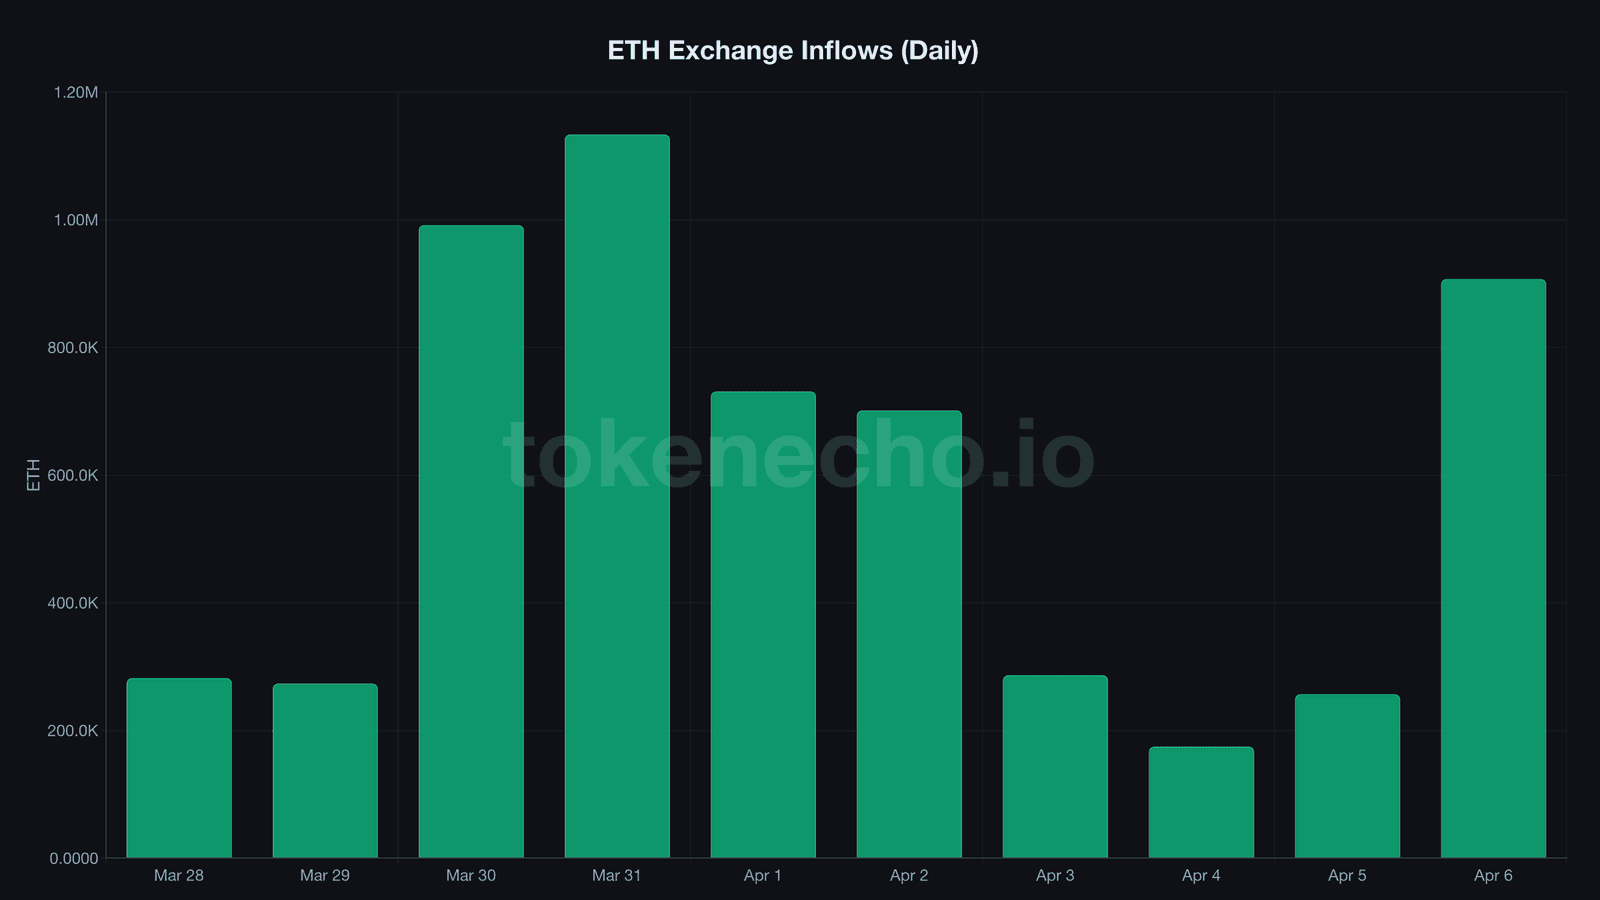
The real story played out on exchanges over the weekend. After four days of near-total silence, deposits exploded to 907,000 ETH in a single session – roughly $1.9 billion hitting trading platforms on April 6.
The day before? Just 257,000. That’s a 254% spike overnight.
And most of it wasn’t buying.
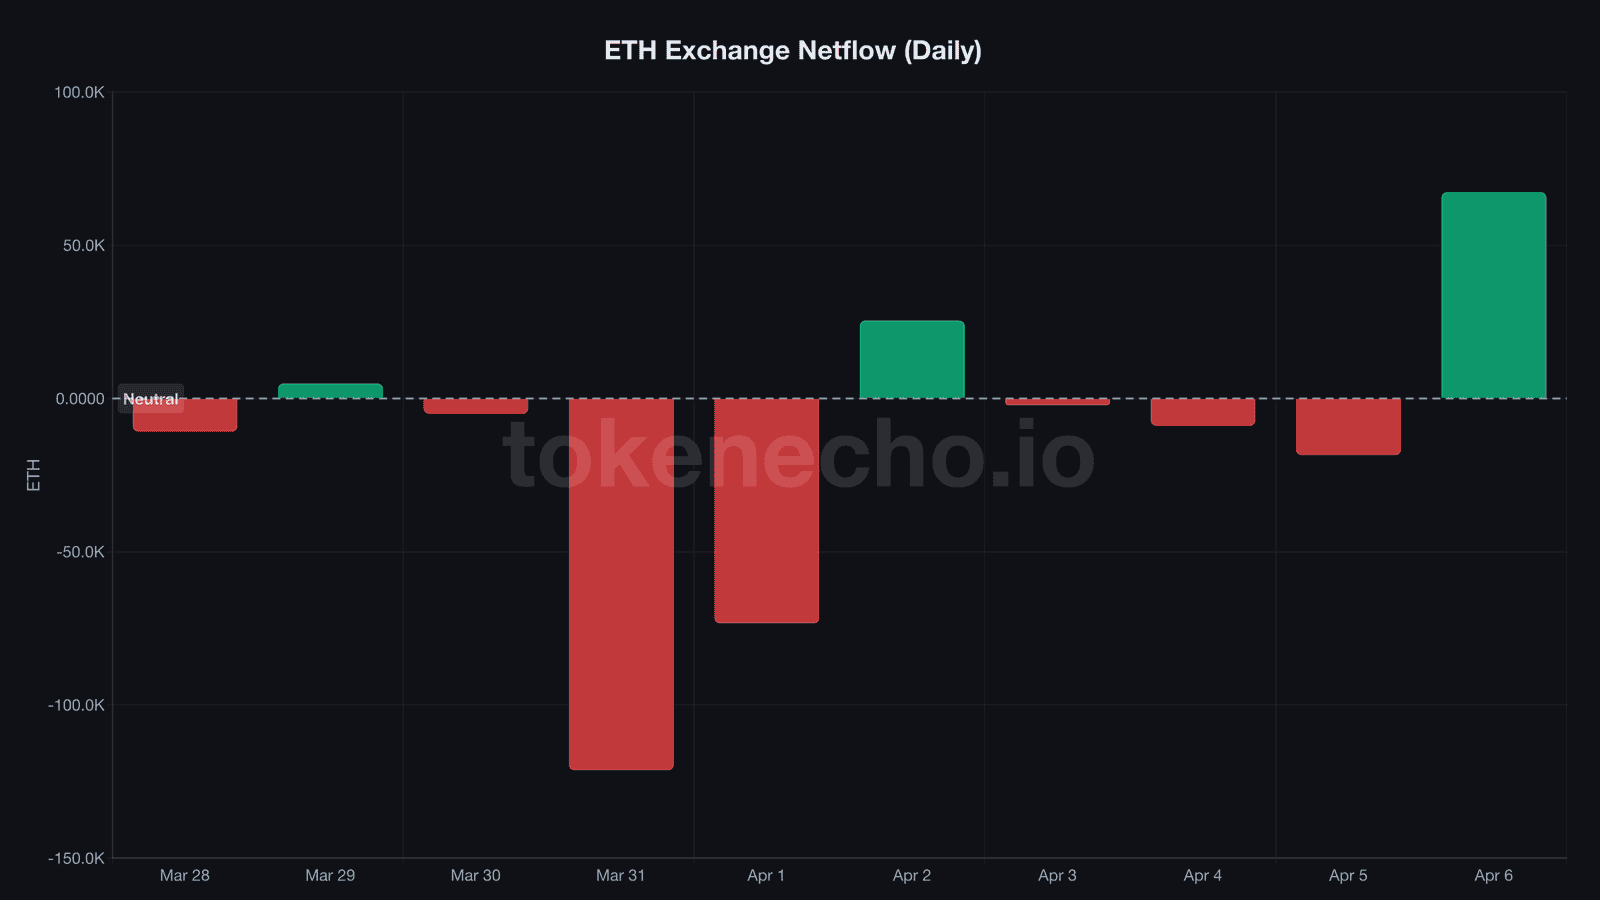
Net flows flipped to +67,280 ETH, approximately $140 million worth. The first significant net inflow since April 2.
Reserves bounced from their April 5 low of 14.81 million ETH to 14.88 million. Someone sold the rally.
$1.9 billion in deposits shatter four days of silence
For four days, ETH exchanges looked abandoned.
Deposits crashed from 1.13 million ETH on March 31 to just 175,000 by April 4 – a collapse we flagged last week. That’s a 75% evaporation in four days.
Outflows dried up equally. Both sides simply stopped showing up.
Then Sunday happened.
Inflows surged to 907,000 ETH. Outflows ran almost as hot at 840,000.
But sellers edged out buyers by 67,000 ETH – roughly $140 million in net selling pressure that doesn’t appear randomly.
It’s like a dormant volcano in the middle of a busy coastal city – four days of absolute stillness where everyone assumes the danger has passed, then everything erupts at once, and you can’t tell whether the lava’s flowing toward you or away until the ash clears.
The top-10 deposit transactions totaled 108,620 ETH, about $227 million. That’s up from 94,345 the day before – whale-sized repositioning, not retail panic.
Why sell into a rally? ETH had just surged 4.83% to $2,136 on April 6, its best session in weeks.
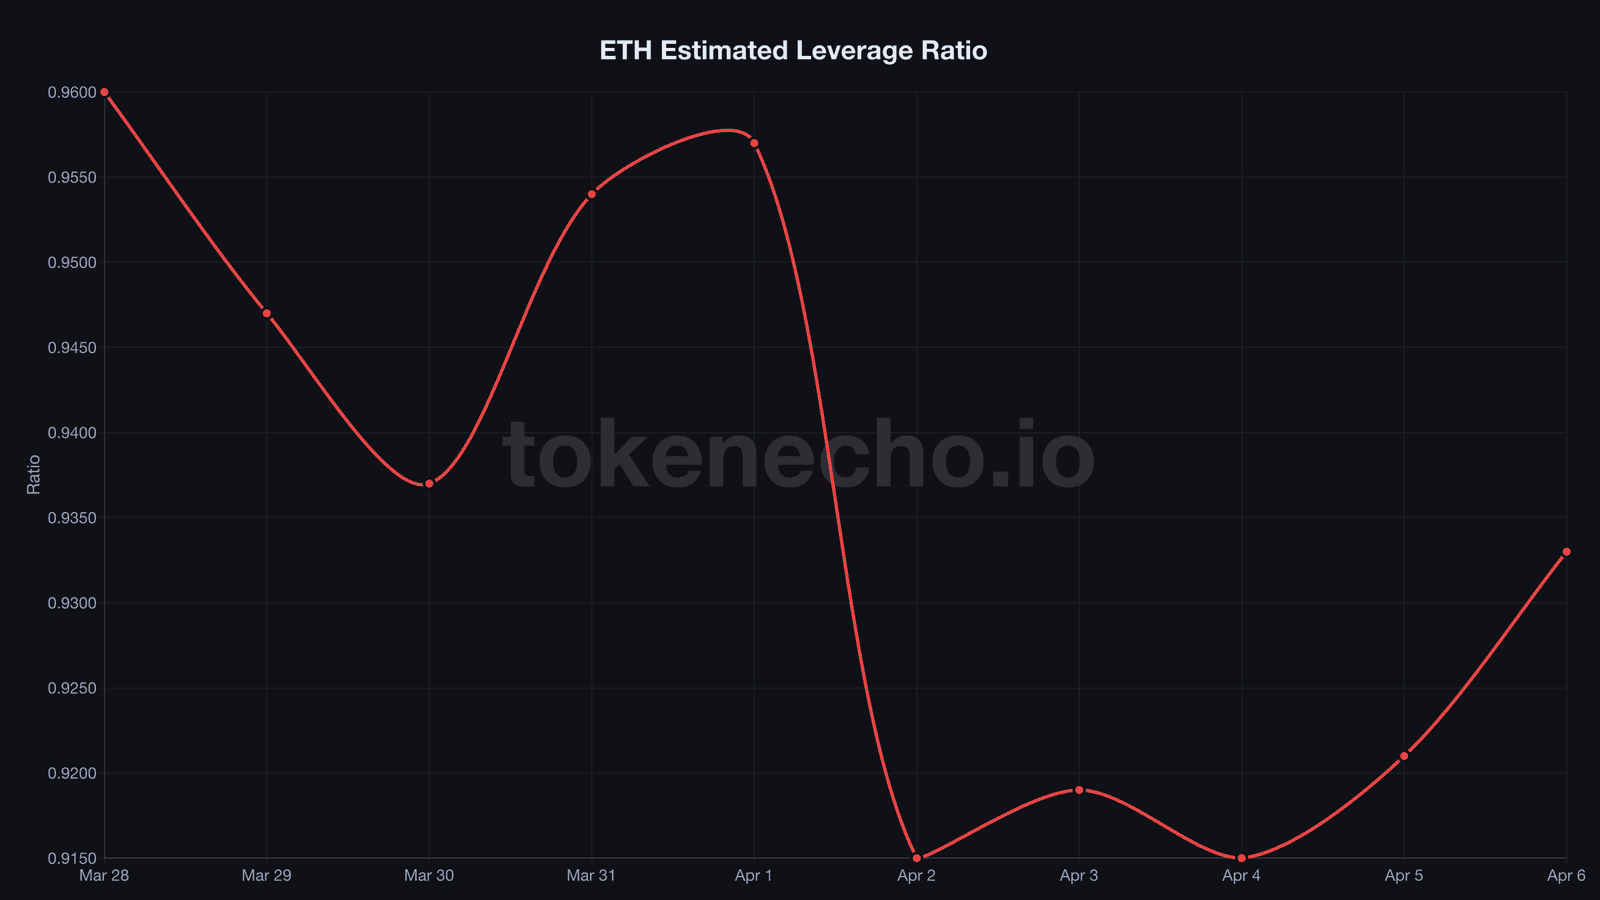
Historically, that’s exactly when profit-takers strike. The estimated leverage ratio, a measure of derivative exposure relative to exchange reserves, jumped from 0.921 to 0.933 alongside those deposits. Traders aren’t just dumping spot – they’re re-leveraging.
For context, the last time leverage spiked alongside positive exchange netflows was April 2. ETH lost 4.2% within 24 hours.
Leverage climbs back – and two Trump deadlines loom
Liberation Day, April 2025. Trump’s original tariff package wiped $6.6 trillion from global markets.
BTC crashed 10.4% in a single session. ETH dropped even harder.
Six weeks later, Bitcoin hit a new all-time high. That rhyme matters because two similar catalysts land within 48 hours.
Trump’s Iran ceasefire ultimatum expires Tuesday evening. Polymarket prices a deal at roughly 1% – essentially zero.
If diplomacy fails, the threat of U.S. strikes on Iranian infrastructure could hammer risk assets across the board, including crypto with its increasingly tight correlation to geopolitical headlines since February’s tariff shock that triggered $770 million in liquidations across digital assets.
Wednesday brings 50% reciprocal tariffs. Different mechanism, same risk-off instinct.
ETH currently trades 57.8% below its August 2025 all-time high of $4,946.
ETH/BTC lingers at 0.0306 – five-year-low territory.
And while the 30-day return reads +5.83%, nearly all of that gain came from last week’s bounce off $2,015. Fragile ground for a week this loaded with catalysts.
Schwab’s $11.9 trillion and BitMine’s quiet accumulation
There’s a bull case building underneath the noise. It just hasn’t shown up in the price yet.
Charles Schwab opened its waitlist for spot Ethereum trading on April 6. “Schwab Crypto will offer the ability to buy and sell crypto alongside traditional investments,” the company said.
Schwab manages $11.9 trillion in client assets. That’s not a crypto-native exchange adding another altcoin – it’s one of America’s largest brokerages building a direct on-ramp for millions of traditional investors.
The pilot launches Q2 2026 in all U.S. states except New York and Louisiana.
And then there’s BitMine.
Tom Lee’s Ethereum vehicle bought 71,252 ETH last week – roughly $152 million. That’s its largest single-week purchase since December 2025.
Total holdings now sit at 4.8 million ETH, or 3.98% of circulating supply. Lee calls his framework the “alchemy of 5%” – the thesis that controlling a twentieth of Ethereum’s supply at distressed prices converts into infrastructure-level returns once institutional demand arrives.
BitMine uplists to the NYSE on April 9 – same day as Trump’s tariffs. They’ve staked 69% of their ETH, generating roughly $282 million annually in staking rewards.
Even at these crushed prices, the position throws off serious cash.
But the contrarian signal can’t be ignored.
ETH ETFs bled approximately $46 million in March – net negative for the fourth straight month. Whale cohorts that accumulated aggressively through late March reversed course around March 27-29.
“Generational Buy Zone,” analyst Ali Martinez said on X last week, pointing to ETH’s deep discount from all-time highs. BitMine and Schwab clearly agree with that assessment.
The ETF outflows don’t. Smart money isn’t unanimous.
ETH price outlook – $2,000 support faces its biggest test
Two scenarios. Forty-eight hours to find out which one wins.
Support sits at $2,044, Monday’s session low. The $2,000 psychological floor has held since late March.
Resistance clusters at $2,100 and $2,150 – where sellers capped Sunday’s rally.
If the Iran deadline passes without escalation while leverage stays below 0.95, that $2,100-$2,150 zone could come back into play. But if either Trump catalyst triggers a broad risk-off move, ETH’s thin liquidity makes it vulnerable to a sharp drawdown.
A break below $2,000 opens the door to $1,850, last tested in late February.
The 67,000 ETH that returned to exchanges Sunday was either smart profit-taking after a 4.83% pop – or early positioning for a sell-the-news event that hasn’t landed yet.
We’ll know by Wednesday.
This analysis is part of our daily Ethereum price tracking. See all previous analyses and key metrics on our hub page.
$1.9 billion flooded exchanges after the quietest week all year – and two presidential deadlines will determine whether that was smart selling or the opening act of something worse.
This is not financial advice. DYOR. Data as of April 7, 2026.
Sources
- CoinGecko API – ETH market data (price, volume, market cap, ATH)
- CryptoQuant – exchange reserves, netflows, inflows, outflows, leverage ratio
- Bloomberg – Trump Iran ultimatum reporting
- CoinDesk – Schwab spot crypto trading
- Yahoo Finance – BitMine ETH acquisitions
Leave a Reply