
🕑 5 min read
121,296 ETH vanished from exchange wallets on March 31 – more than the entire previous week combined – while the price jumped 5% to kick off Q2.
One hundred twenty-one thousand Ether. That’s how much left exchange wallets on the last day of Q1 – roughly $258 million at current prices. For context, the entire week before that? About 53,000 ETH total. Someone got very aggressive on March 31.
Ethereum opens Q2 at $2,132, up 5.1% in the past 24 hours and outperforming Bitcoin’s 3% bounce for the first time in weeks. The 24-hour range stretched from $2,015 to $2,154, with volume hitting $22.4 billion. ETH still sits 56.9% below its August 2025 all-time high of $4,946 – but for this ethereum price analysis, the story isn’t where the price is. It’s where the coins went.
121,296 ETH in One Day – and Nobody’s Talking About It
Exchange reserves across all platforms dropped to 14.89 million ETH on March 31. That’s the lowest reading in over a month, and a sharp decline from the 15.01 million recorded just 24 hours earlier.
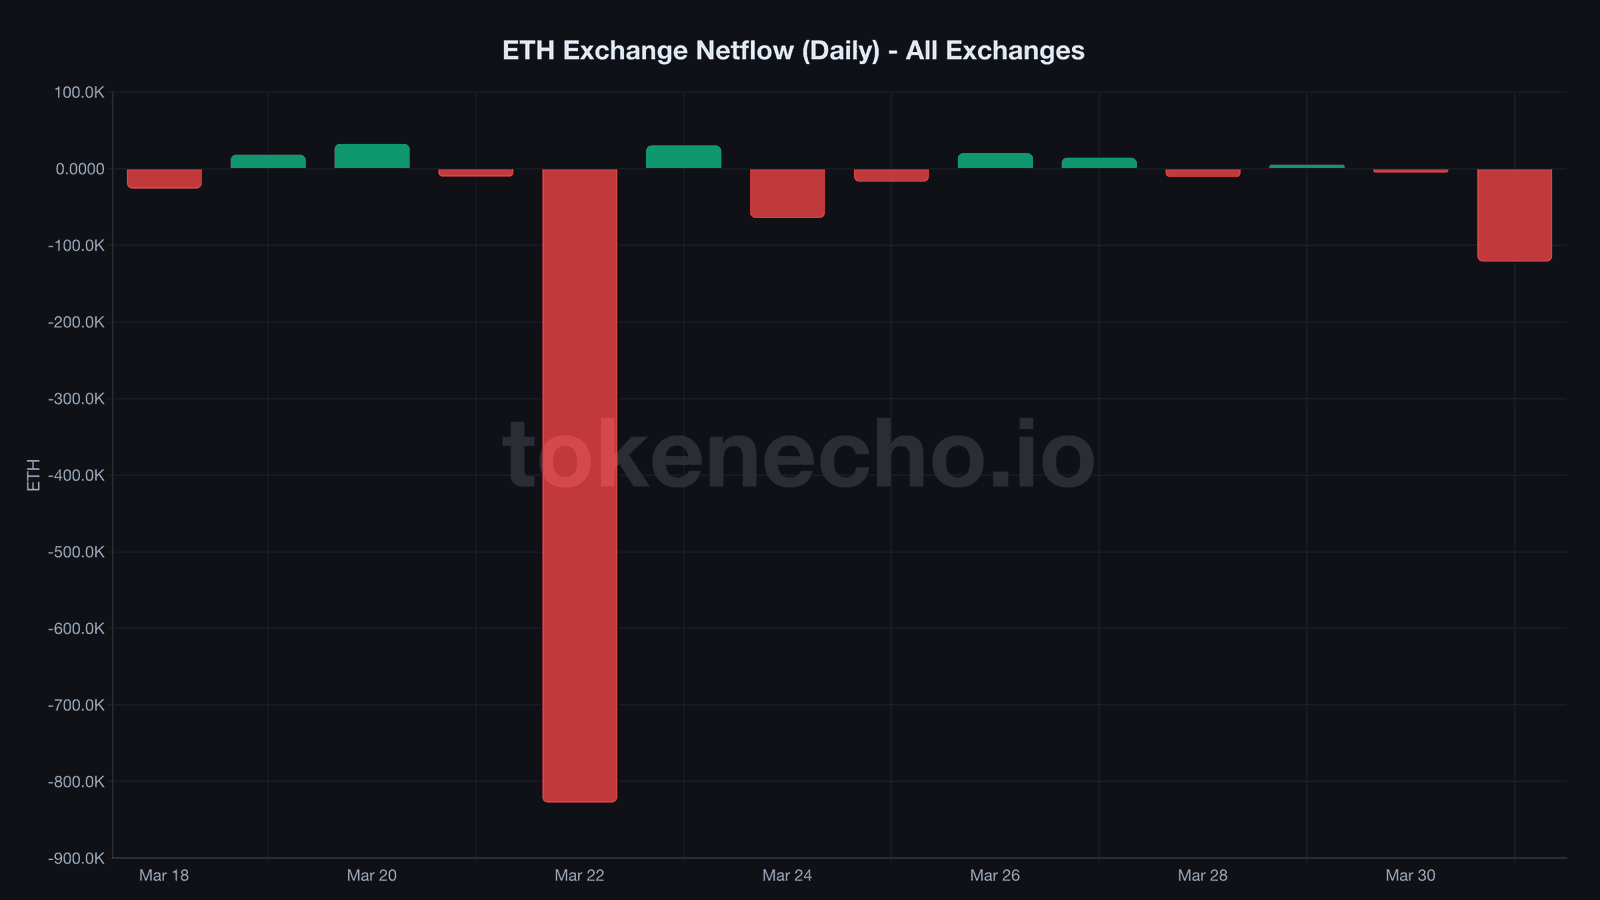
Look at the netflow data. Between March 26-30, daily outflows were modest – a few thousand ETH here and there, mixed with minor inflows. Then March 31 hit like a freight train: -121,296 ETH net outflow.
That single-day withdrawal dwarfs everything we’ve seen since the March 22 capitulation event, when a chaotic -827,364 ETH reshuffled exchange balances during the broader market panic. Strip out that anomaly, and March 31 was the heaviest outflow day in at least two weeks.
“ETH/BTC NUPL hits a new four-year low,” Ki Young Ju, CEO of CryptoQuant, said in late March. Holders are underwater – and yet someone keeps pulling coins off exchanges. That’s not panic. That’s accumulation.
Nearly 1 Million ETH Gone in 10 Days
Zoom out. On March 21, exchanges held 15.86 million ETH. By March 31, that number fell to 14.89 million. That’s 976,583 ETH removed in 10 days – close to a million coins worth roughly $2.08 billion at today’s prices.
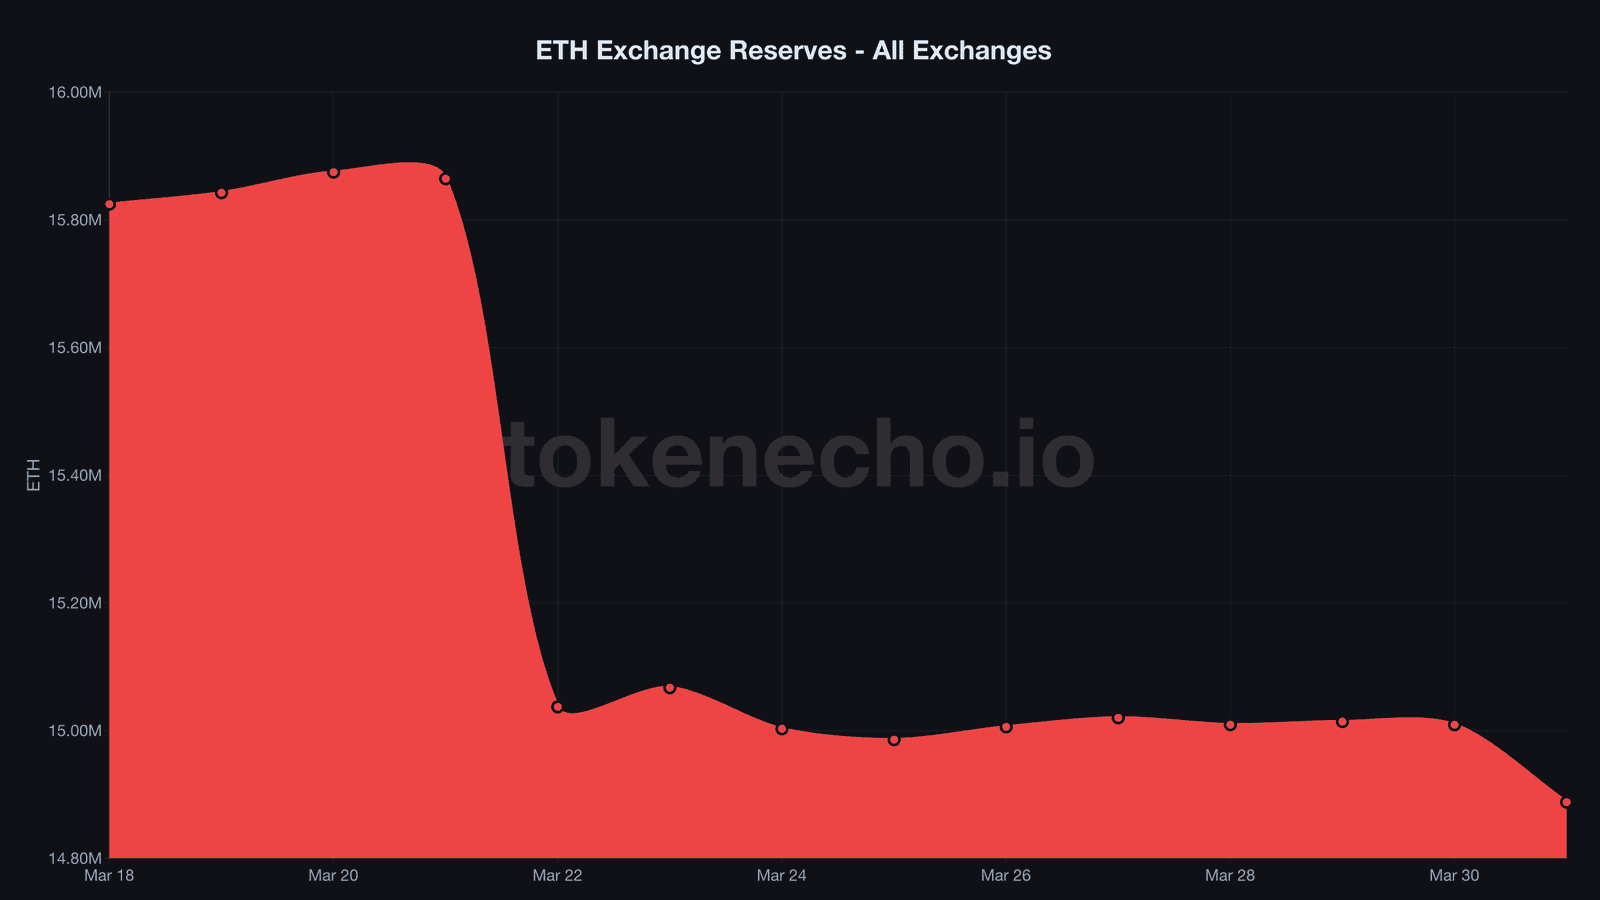
The decline hasn’t been linear. March 22’s capitulation dump shaved off ~827K in a single violent session, then reserves partially refilled during mid-week inflows on March 26-27. But the trend is undeniable: lower highs, lower lows on exchange balances. Whoever accumulated during the March crash hasn’t brought those coins back.
And now the March 31 outflow adds a fresh leg down in reserves.
Leverage Is Cooling – But Not Dead
The estimated leverage ratio, a measure of open interest relative to exchange reserves, tells a quieter but equally important story. After spiking to 0.972 on March 27 – a level that screamed overheated derivatives market – it’s eased back to 0.954.

Is that enough of a cooldown? Not really. For comparison, leverage sat at 0.910 on March 25 before the ramp-up. We’re still elevated. But the direction matters more than the absolute level right now: declining leverage alongside rising spot price and exchange outflows suggests the current bounce is spot-driven, not leveraged up on futures.
That’s the healthier setup. Leveraged rallies blow up. Spot accumulation sticks.
ETH/BTC Ratio: First Pulse After Flatline
The ETH/BTC pair crept up to 0.0311 from the 0.0305 five-year low printed on March 29. Barely a blip on a zoomed-out chart – but it’s the first upward move in nearly three weeks of relentless bleeding.
ETH’s 30-day return actually flipped positive at +9.86%, even as the 7-day remains negative at -2.0% and the 14-day at -8.0%. The quarterly picture is ugly – ETH closed Q1 down 59% from its ATH, worse than Bitcoin’s 47% drawdown. But Q2’s opening session just delivered ETH’s strongest single-day outperformance versus BTC since early March.
One day doesn’t make a trend. But it does break a pattern.
ETH Price Levels: $2,150 Resistance Holds the Key
The immediate picture for ethereum price:
Support:
- $2,000 – psychological floor, held through all of Q1’s carnage
- $1,850 – next major support if $2K cracks
Resistance:
- $2,150 – today’s session high ($2,154) already kissed it and pulled back
- $2,400 – the real test, where multiple failed rallies have died since mid-March
ETH needs a daily close above $2,150 to confirm this isn’t just another dead-cat bounce. The previous two 5%+ daily rallies (March 25, March 30) both faded within 48 hours. Volume at $22.4 billion is respectable but not euphoric.
What separates this bounce from the fakes? The exchange data. Previous rallies happened alongside flat or rising reserves. This one comes with the largest single-day outflow in 9 days. That’s a structural difference – real coins moving to cold storage, not just leveraged longs chasing green candles.
What’s Actually Happening Under the Surface
Put it together. ETH lost 59% from its ATH. The ETH/BTC ratio hit a five-year low. Market dominance shrank to about 10%. By every surface-level metric, Ethereum had its worst quarter since the FTX collapse.
But underneath? Nearly a million ETH drained from exchanges in 10 days. Leverage is declining from its March peak. Spot accumulation – not derivatives – drove today’s 5% rally. And someone pulled $258 million in ETH off exchanges in a single day while most of the market was writing obituaries for the flippening.
Despair and accumulation look identical from the outside. The difference only shows up in the on-chain data.
Standard Chartered’s Geoffrey Kendrick called 2026 “the year of Ethereum” with a $4,000 year-end target earlier this year. That call looks delusional at $2,132. But if exchange reserves keep bleeding at this pace, the supply squeeze math starts getting interesting very quickly.
This analysis is part of our daily Ethereum price tracking. See all previous analyses and key metrics on our hub page.
Disclaimer: This is not financial advice. DYOR. Data as of April 1, 2026.
Sources:
Leave a Reply