
🕑 5 min read
The ceasefire rally lifted ETH 7.5% in a week – but exchange data shows profit-taking at scale while institutions bet bigger than ever.
Ethereum pulled back to $2,191 on Wednesday, giving up 2.3% in 24 hours.
That $2,265 high from Tuesday? Gone before most of Asia even woke up. The Iran ceasefire rally – which hammered $136 million in ETH shorts on April 8 – ran out of fuel in less than a day, and now exchange data is flashing a warning we haven’t seen since this rally started: three straight days of net inflows.
Yesterday’s winners are today’s sellers
Yesterday’s short squeeze crushed anyone betting against ETH. $136 million in liquidations in six hours – the ceasefire headline ripped through thin order books and caught bears flat-footed.
Today’s the hangover.
ETH trades at $2,191, still 55.7% below its all-time high of $4,946. A week ago it was barely clinging to $2,040, so the 7.5% gain is real. But zoom into the 24-hour chart and you’ll see a slow bleed from $2,265 down to $2,167 before a timid bounce.
The ETH/BTC ratio, which tracks Ethereum’s strength relative to Bitcoin, tells the uglier story. It’s stuck at 0.0307 – effectively unchanged from last week’s 5-year low. ETH outperformed BTC by nearly three percentage points this week, and the ratio didn’t budge.
Where does that leave relative conviction? Somewhere between “muted” and “nonexistent.”
What happened next is the kind of move you’d see in a housing market, not crypto. Prices pop on a headline, and every homeowner who’s been underwater for months rushes to list before the sentiment window closes.
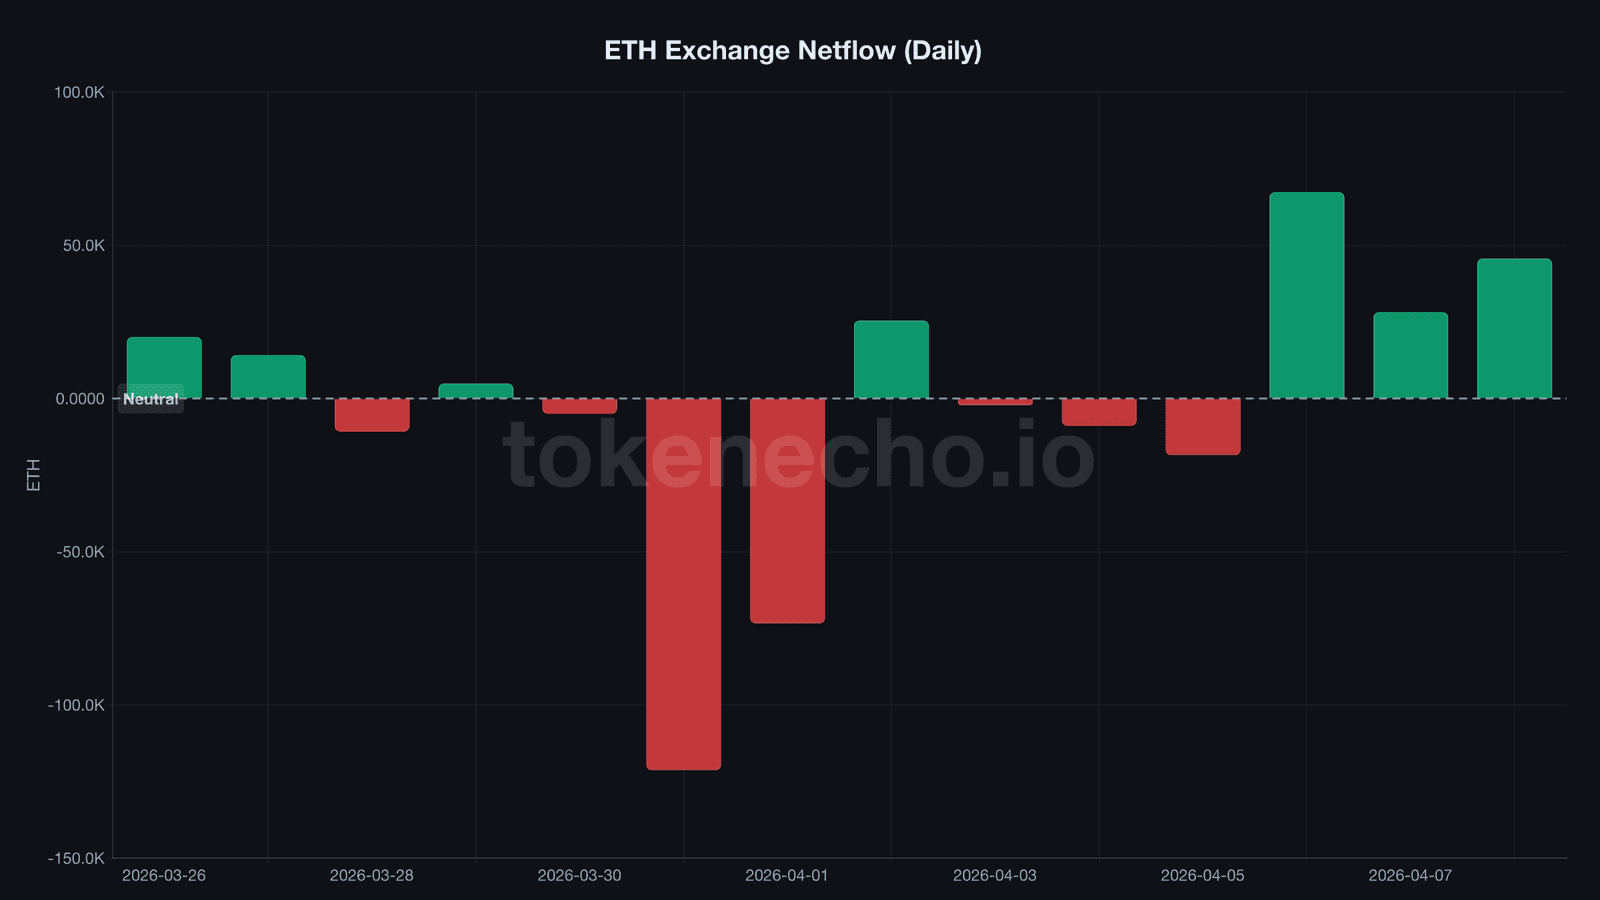
141,000 ETH and $309M in 72 hours – someone’s cashing out
141,000 ETH.
That’s how much flowed into exchange wallets between April 6 and April 8 – roughly $309 million at current prices and the longest streak of positive netflow since late March. April 6 opened the floodgates with 67,280 ETH. The next day slowed to 28,097 – a dip that might’ve looked encouraging.
It wasn’t. April 8 added 45,668 more.
And the biggest wallets aren’t being subtle. Top-10 exchange deposits, the largest individual transfers to trading platforms, hit 172,631 ETH on April 8. That’s the highest single-day whale deposit in over a week, dwarfing the 94,345 ETH figure from just three days earlier. When the largest holders start moving that much to exchanges during a 7.5% weekly rally, they’re not repositioning for a staking upgrade – they’re taking profit.
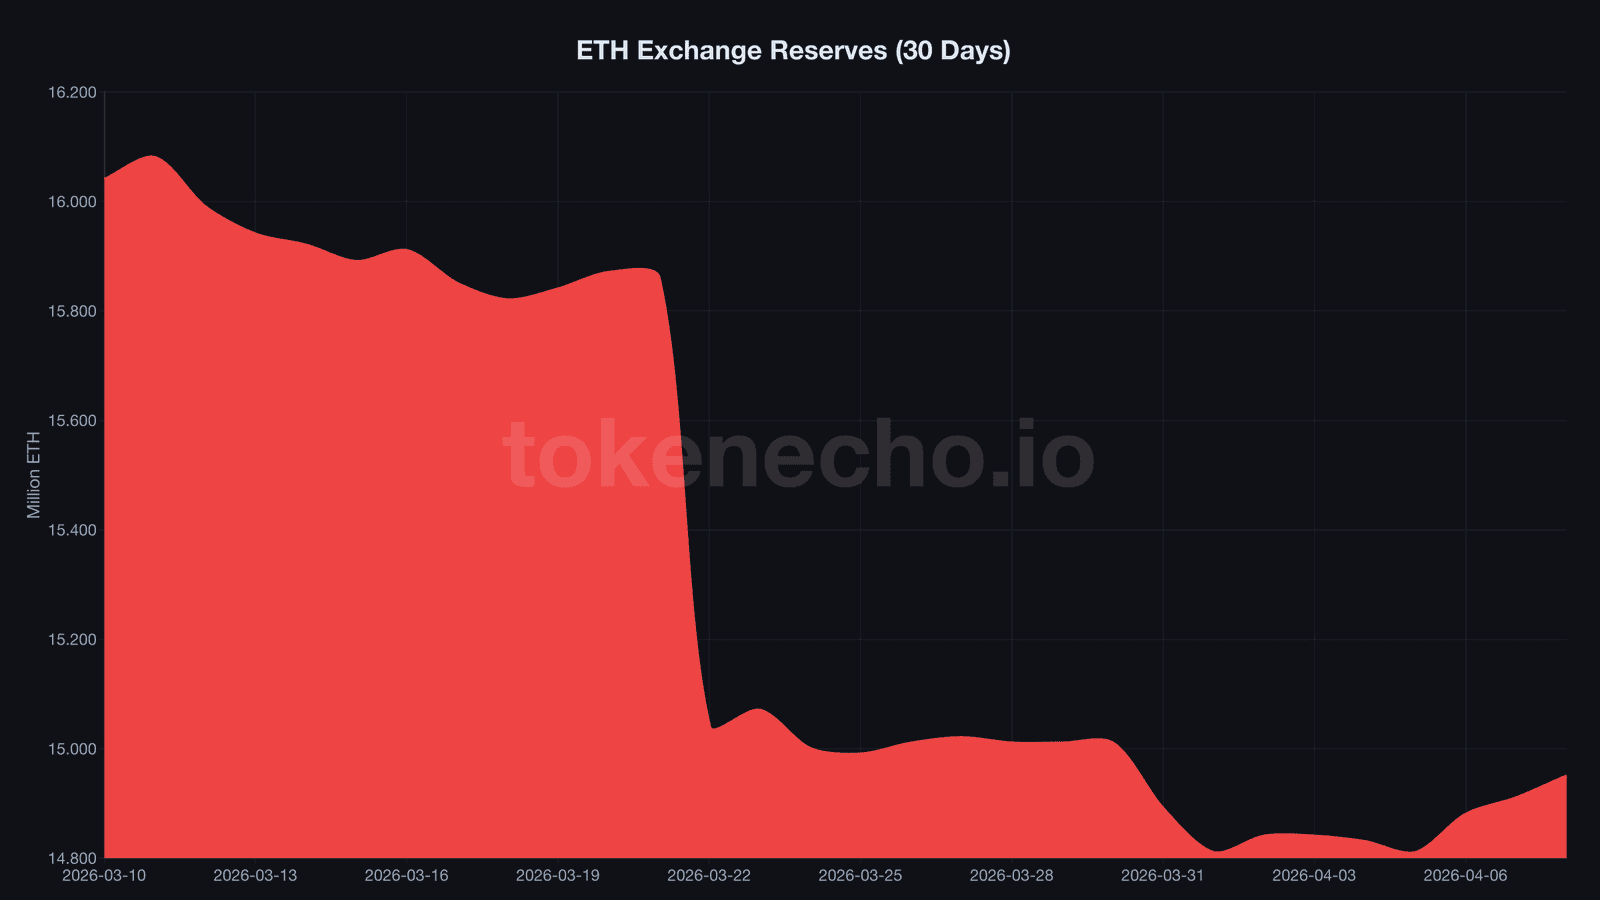
Exchange reserves climbed from a local low of 14.81 million ETH on April 5 to 14.95 million by April 8 – erasing about two weeks of the steady outflow trend that had been one of the few structural arguments keeping bulls in the game.
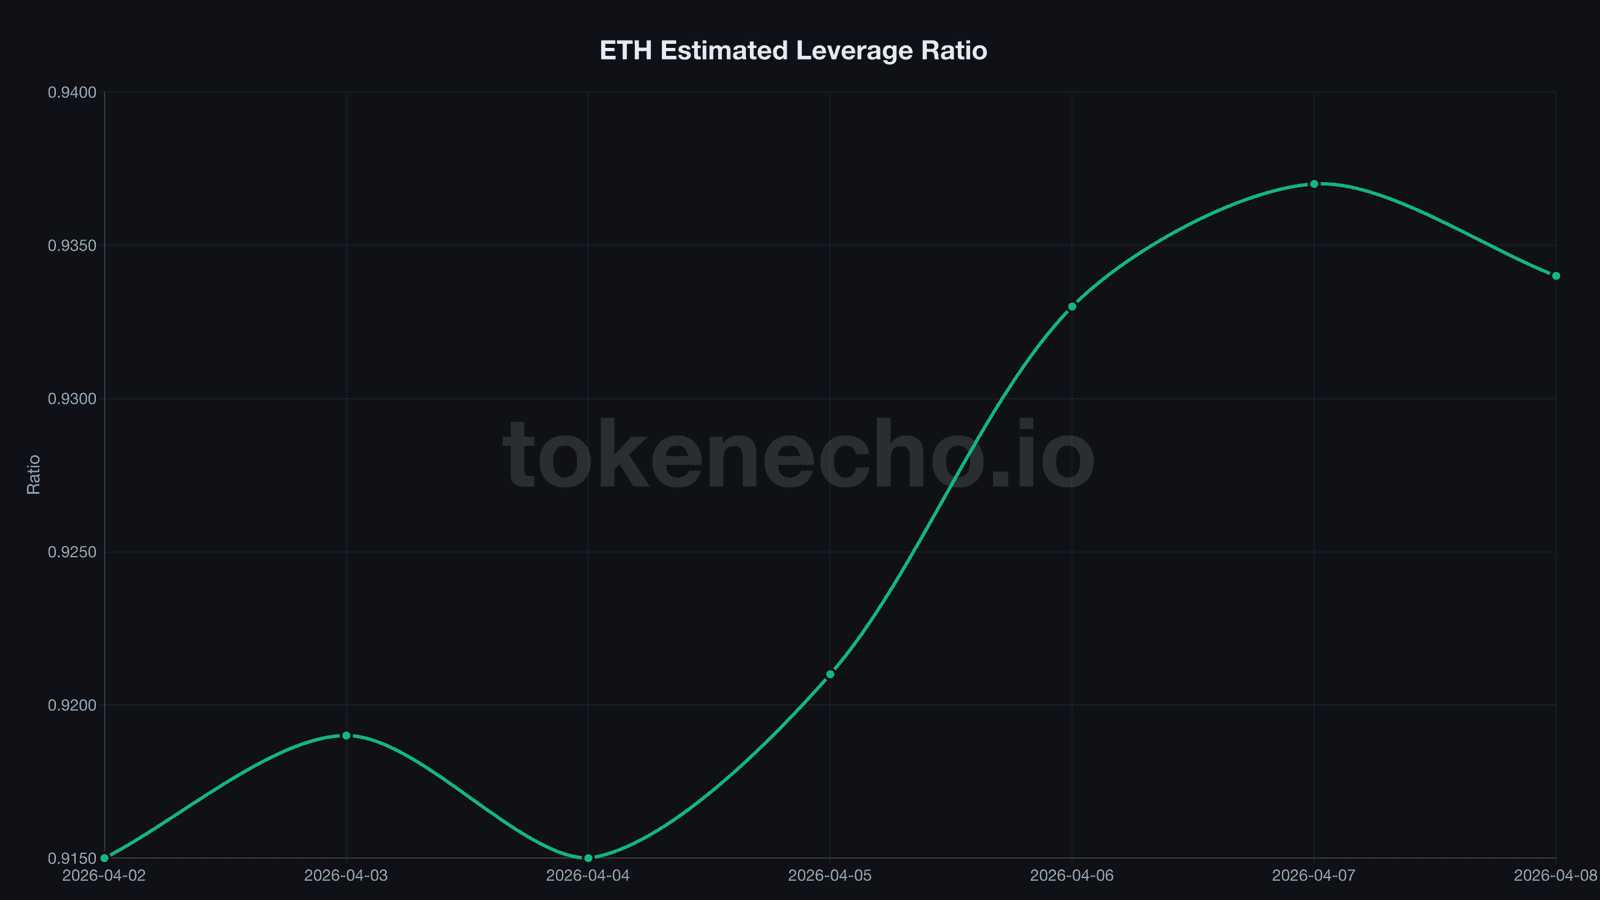
The estimated leverage ratio, a measure of how large derivative positions are relative to spot holdings on exchanges, ticked up from 0.915 to 0.934 over four days. Leverage is rebuilding after last week’s flush. Not aggressively – but it’s creeping in the wrong direction.
Now compare that with Bitcoin. BTC posted a net outflow of 1,951 coins on April 9 – accumulation, not distribution. Same ceasefire catalyst. Same macro rally. Completely opposite exchange behavior.
Is the market telling us something about which rally it trusts?
But before anyone panics: the 30-day picture hasn’t changed. Exchange reserves are still down 1.09 million ETH since March 10 – a 6.79% drain that dwarfs this three-day bounce. Selling into a 7.5% rally is like leaving a concert after the first encore. You got what you came for, but the show’s not over.
BitMine just made 4% of all ETH a NYSE stock
“Ethereum is the wartime store of value,” Tom Lee said when backing BitMine’s strategy. The numbers don’t disagree – ETH has outperformed the S&P 500 by 1,130 basis points and gold by 1,840 basis points since the Iran conflict began.
BitMine started trading on the NYSE today. With 4.803 million ETH on its balance sheet – 3.98% of all Ethereum in existence – it’s now the largest publicly-traded Ethereum holder on a major global exchange, a distinction that would’ve seemed unthinkable when the company started accumulating below $2,000.
The company isn’t just hoarding tokens. About 3.33 million ETH is staked through its Mavan network, pulling in roughly $196 million per year. BitMine grabbed another 71,252 ETH ahead of the uplisting – $152 million in fresh conviction.
They’re not alone. ETH spot ETF inflows hit $120 million on April 6, the first major positive day in months. BlackRock’s ETHA captured $60.8 million of that. Fidelity’s FETH took $40 million. Between them, just two products absorbed 84% of all flows.
So we’ve got a split: exchange data screaming distribution while institutional money piles deeper into ETH than at any point since the spot products launched.
Key levels – $2,167 floor, $2,265 ceiling, $2,500 breakout
The short-term range is tight. Wednesday’s low of $2,167 and Tuesday’s high of $2,265 define the battlefield – a $98 corridor that likely resolves before the weekend.
A break below $2,167 exposes $2,064 and the psychological $2,000 level, both tested repeatedly in March. Upside is more interesting. Analyst Ali Martinez has flagged $2,500 as the level where ETH’s “engine starts” – it sits near the aggregate realized price where the average holder breaks even, a threshold explored in our Ethereum price prediction for 2026-2030. Standard Chartered’s Geoffrey Kendrick maintained a $4,000 target.
If exchange inflows cool while institutional money keeps arriving, the 30-day reserve drain likely resumes – and that setup rhymes with the pattern that preceded ETH’s Q4 2024 recovery. But if whale deposits keep running above 170,000 ETH per day, this ceasefire bounce stalls below $2,265.
This analysis is part of our daily Ethereum price tracking. See all previous analyses and key metrics on our hub page.
Exchange data says sell. Institutional flows say buy. One of these forces breaks first – and it’ll define ETH’s Q2.
This is not financial advice. DYOR. Data as of April 9, 2026.
Sources
- CoinGecko API – ETH market data (coingecko.com)
- CryptoQuant API – exchange flows, leverage ratio (cryptoquant.com)
- BitMine NYSE uplisting – PR Newswire, April 9, 2026
- ETH ETF flows – Farside Investors, April 6, 2026
Leave a Reply