
🕑 5 min read
Ethereum surged nearly 8% on Tuesday — its sharpest single-day move since late March.
The lazy Ethereum price analysis writes itself: breakout above $2,200, ceasefire rally, bears rekt. The real story starts on-chain.
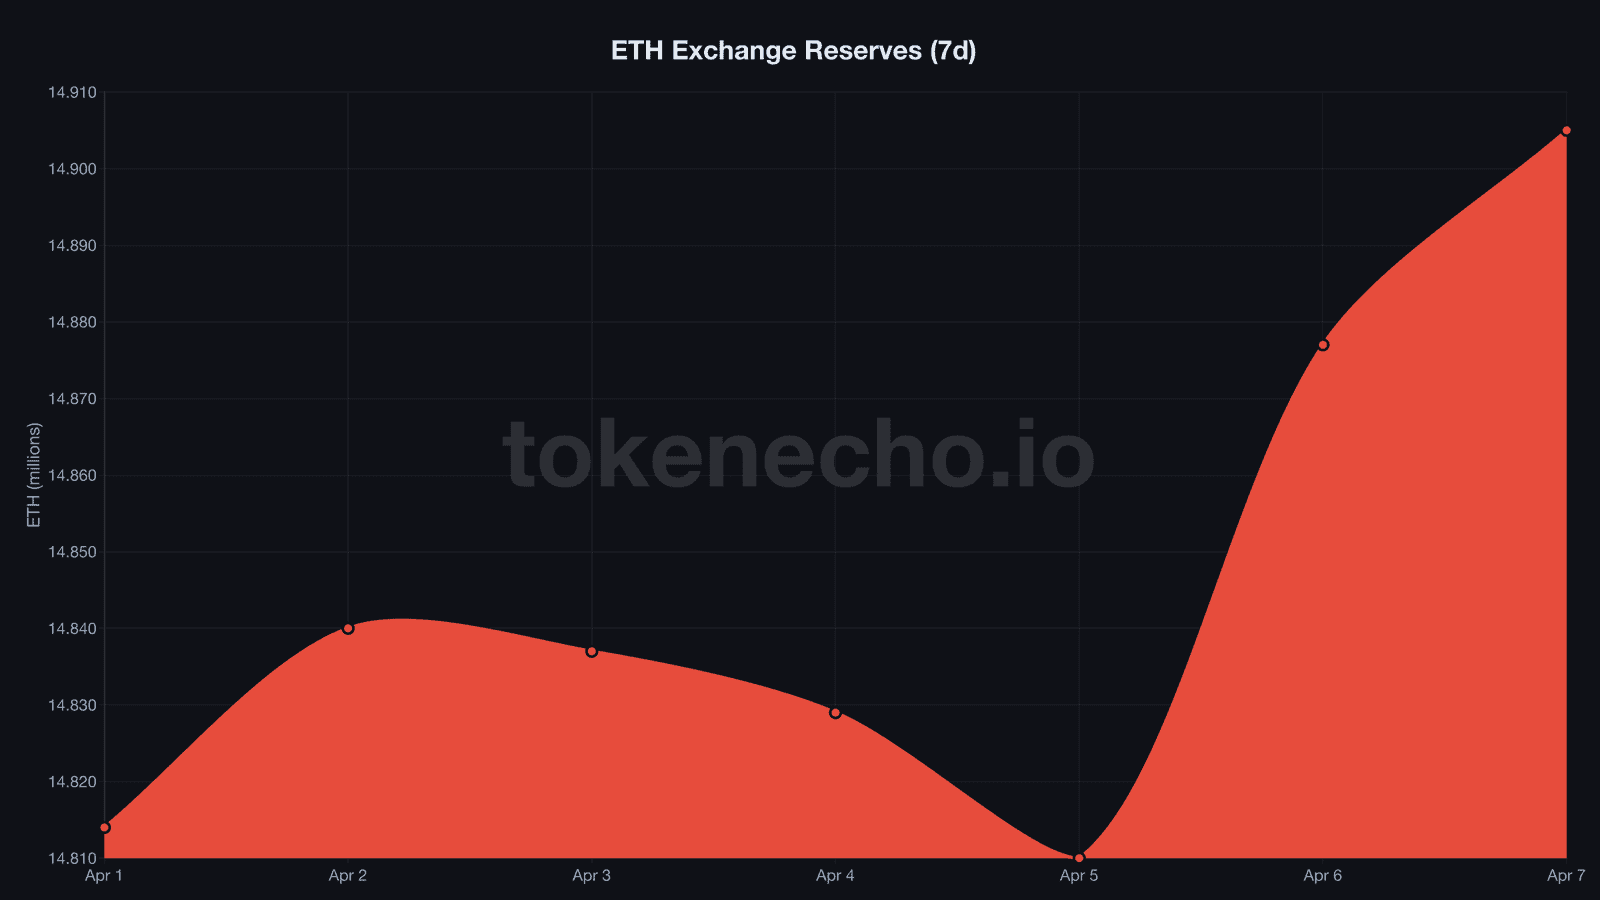
Exchange reserves grew by 91,000 ETH over the past week — roughly $203 million in sell pressure that didn’t exist seven days ago.
So who’s depositing into the rally?
Two hours before the deadline — then everything flipped
Two hours before Trump’s 8 PM ET deadline for Iran on Tuesday night, the ceasefire landed. Tehran agreed to a two-week pause and committed to reopening the Strait of Hormuz — the chokepoint that had oil traders sweating for weeks.
ETH had been grinding near $2,064 all day.
Then the headlines hit.
The rally liquidated $150 million in ETH shorts within six hours. Price tore through $2,150 and didn’t stop until $2,265 — the best single day for Ethereum longs since Q2 opened with a massive outflow-driven surge on March 31.
And it wasn’t just the ceasefire.
Morgan Stanley announced its MSBT spot Bitcoin ETF launching April 9 at a 0.14% fee — undercutting BlackRock’s IBIT by 11 basis points. For ETH holders, the real headline is that Morgan Stanley filed registrations for Ethereum and Solana trusts back in January.
That filing carries a lot more weight now with $9.3 trillion in client assets behind it.
BTC climbed 4.9% on the same catalysts.
But ETH outpaced it — and the ETH/BTC ratio, which had been rotting at a 5-year low of 0.0305, bounced to 0.0311.
Small recovery. First sign of life in weeks.
Traders watching the ratio will note that the last meaningful ETH outperformance versus Bitcoin started from similarly depressed levels back in Q2 2019, when the ratio sat below 0.02 — and ETH went on to outperform by 80% over the following 90 days.
91,000 ETH hit exchanges while the price surged
Price went up. So did exchange sell pressure.
That’s not supposed to happen.
Exchange reserves, the total amount of ETH held on centralized trading platforms, climbed from 14.81 million to 14.91 million over the past seven days. That’s an increase of 91,168 ETH — like a concert venue filling with people heading for the exits while the band keeps playing louder.
Net inflows, the difference between deposits and withdrawals on exchanges, spiked to +67,280 ETH on April 6. Yesterday brought another +28,097.
Two consecutive days of heavy deposits — the biggest since the $1.9B inflow surge we flagged Monday.
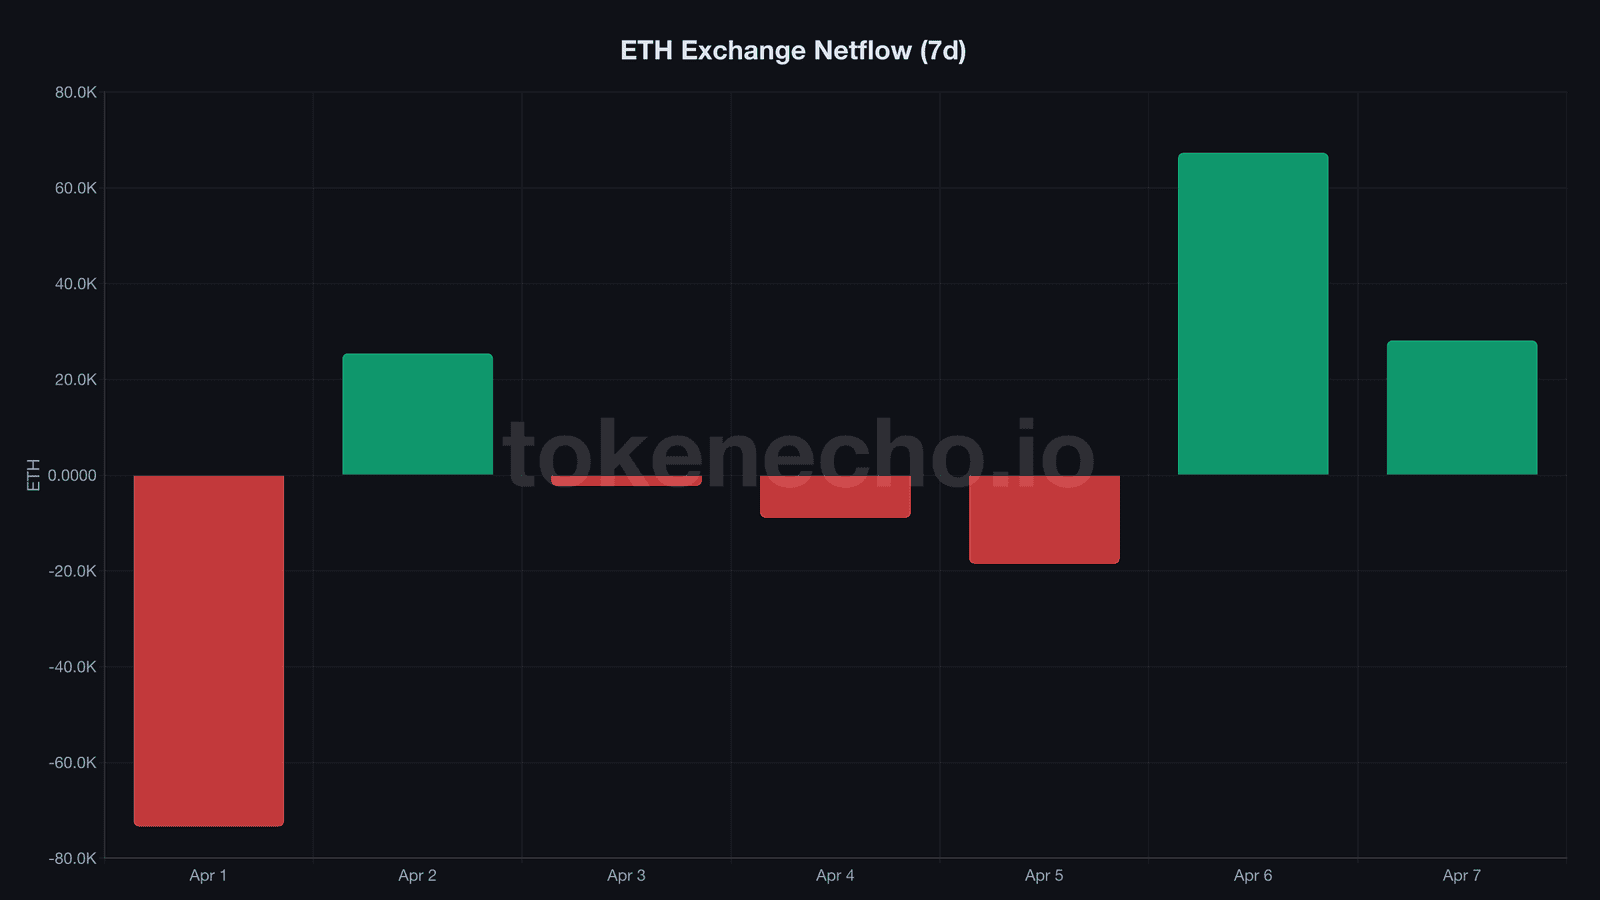
And it’s not retail driving these numbers. Average deposit size jumped from 10.9 ETH to 43.8 ETH in just three days.
That’s a 4x increase. Somebody with deep pockets is positioning to sell into strength.
But zoom out and the picture gets messier. Over 30 days, reserves actually fell by 1.19 million ETH — a $2.4 billion drain.
The weekly buildup is a blip against that larger trend. Which force wins? We’ve been tracking this tug-of-war since early April, and neither side has blinked.
Funding rates crashed 83% — but ETF buyers didn’t blink
$120 million.
That’s what Ethereum ETF buyers poured into spot ETH funds on April 7 — the strongest single-day inflow since early March.
BlackRock’s ETHA attracted $60.8 million, while Fidelity’s FETH grabbed another $40 million.
Combined, those two captured 84% of all ETH ETF flows that day.
‘I think 2026 will be the year of Ethereum, much like 2021 was,’ said Geoff Kendrick, Global Head of Digital Assets Research at Standard Chartered. His year-end target sits at $4,000 — nearly double Tuesday’s close.
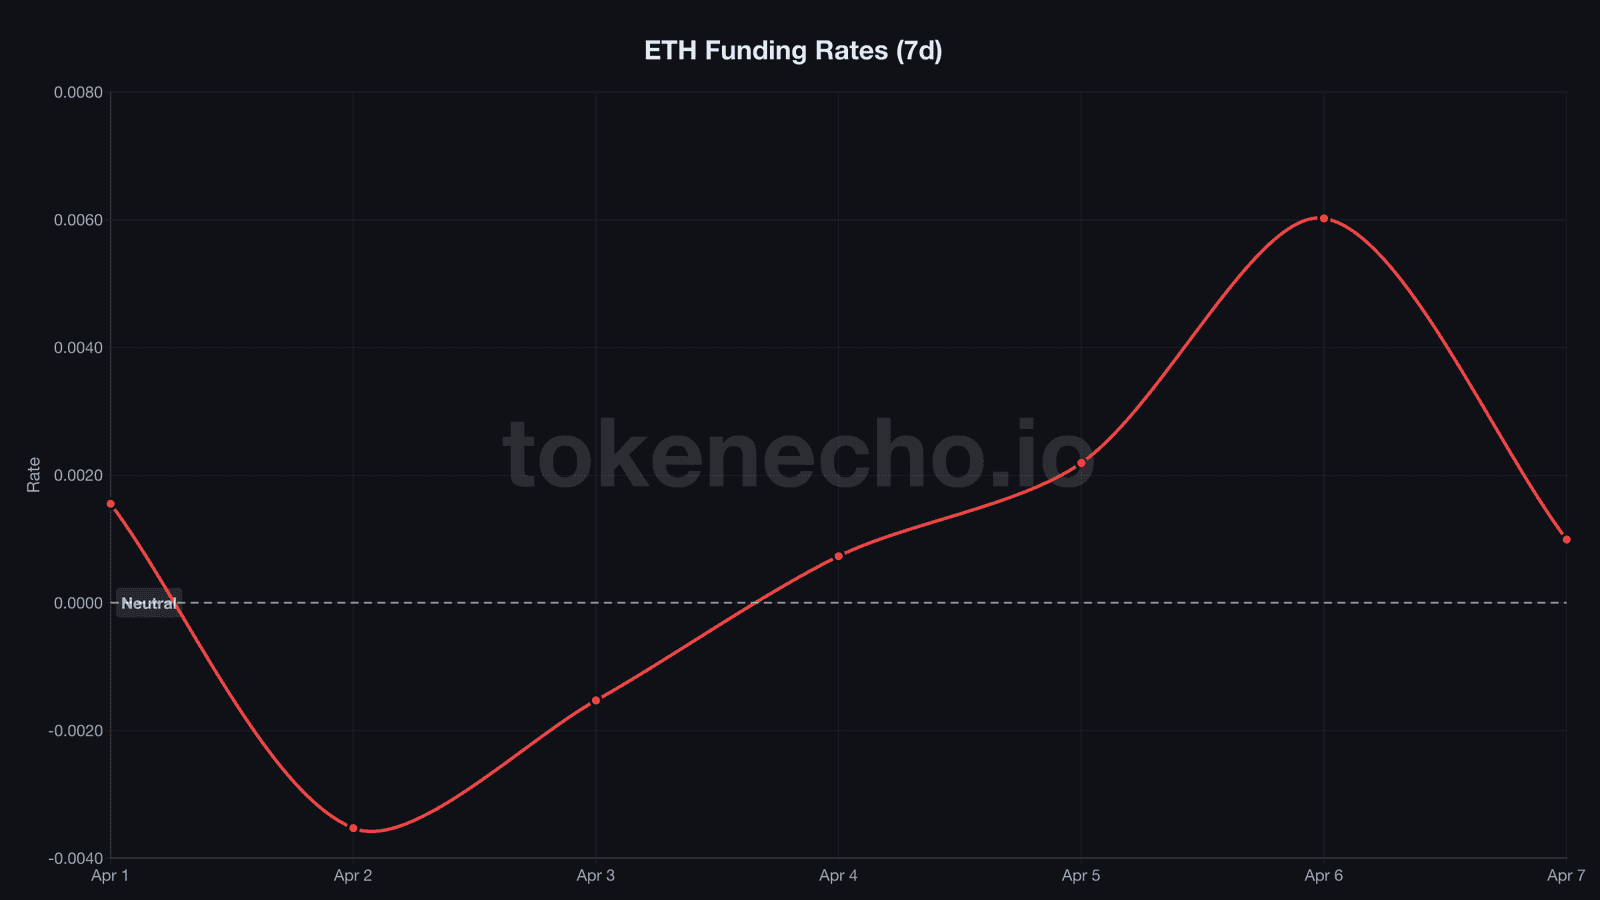
But the derivatives market isn’t buying it. Funding rates, the periodic fee exchanged between long and short traders in perpetual futures, collapsed from 0.006 to barely 0.001 by April 7.
That’s an 83% drop in 24 hours. The leveraged longs who rode the ceasefire rally have already started unwinding.
Stablecoin supply on Ethereum just hit $180 billion — an all-time high and 60% of all stablecoins globally. Dry powder parked on-chain, waiting.
But ETH still sits 54.9% below its August 2025 all-time high of $4,946.
Analyst Ali Martinez pegs $2,500, Ethereum’s realized price and the average cost basis of all circulating ETH, as the “start engine” for the next major leg. That’s still 12% above Tuesday’s close.
Support sits at $2,200 — the breakout level now turning retest zone — and $2,064, Tuesday’s pre-rally floor.
Resistance starts at $2,265, today’s intraday high. But the real test is $2,500 — where realized price lives and where the next leg either starts or stalls.
If ETF inflows hold above $100 million daily while exchange reserves reverse course and start declining again, the setup starts to rhyme with the late Q1 accumulation phase that preceded this entire rally — and that one lasted nearly three weeks before breaking higher. But if funding stays flat and deposits keep growing, this 8% candle could end up as the exit door for whales who’ve been waiting.
Until $2,500 flips to support, this rally runs on macro catalysts and hope. The on-chain data says the smart money hasn’t made up its mind.
This analysis is part of our daily Ethereum price tracking. See all previous analyses and key metrics on our hub page.
ETF buyers say one thing, exchange depositors say another. April 9 brings both Morgan Stanley’s ETF launch and Trump’s tariff deadline — one of them will break the tie.
This is not financial advice. DYOR. Data as of April 8, 2026.
Sources
- CoinGecko — ETH price, market cap, volume, ATH data
- CryptoQuant — exchange reserves, netflow, funding rates, inflow metrics
- Standard Chartered Research — Geoff Kendrick 2026 ETH outlook
- Token Terminal — Ethereum stablecoin supply data
- Ali Martinez via X — ETH realized price and technical levels
Leave a Reply