🕑 4 min read
Ethereum clings to $1,993 after a 60% drawdown from its August ATH while market dominance slides to 10.16% – the lowest reading in over four years. But 10,770 ETH quietly left exchanges yesterday.
Ethereum can’t catch a break.
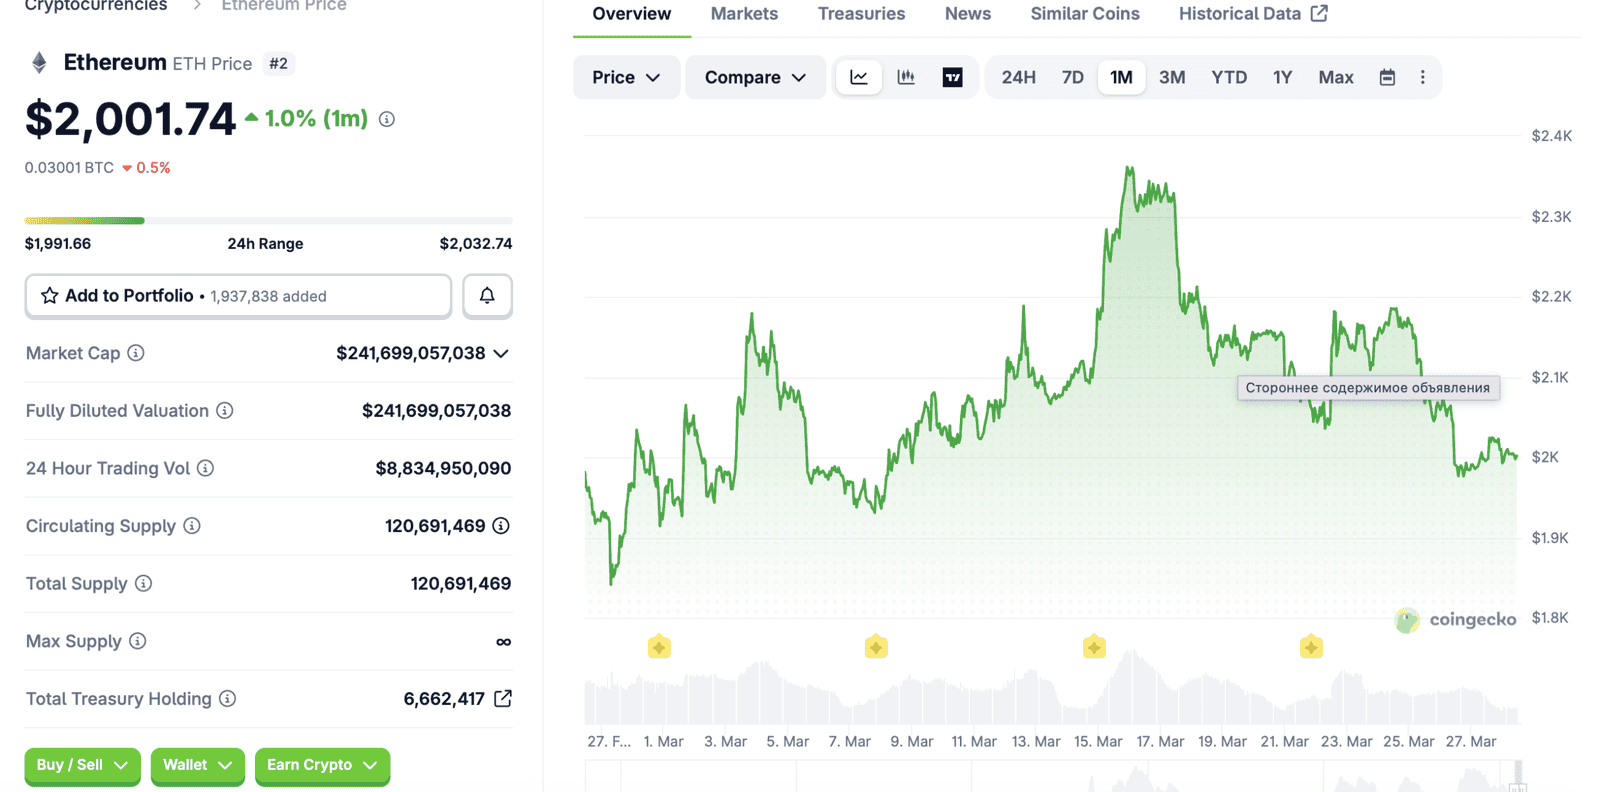
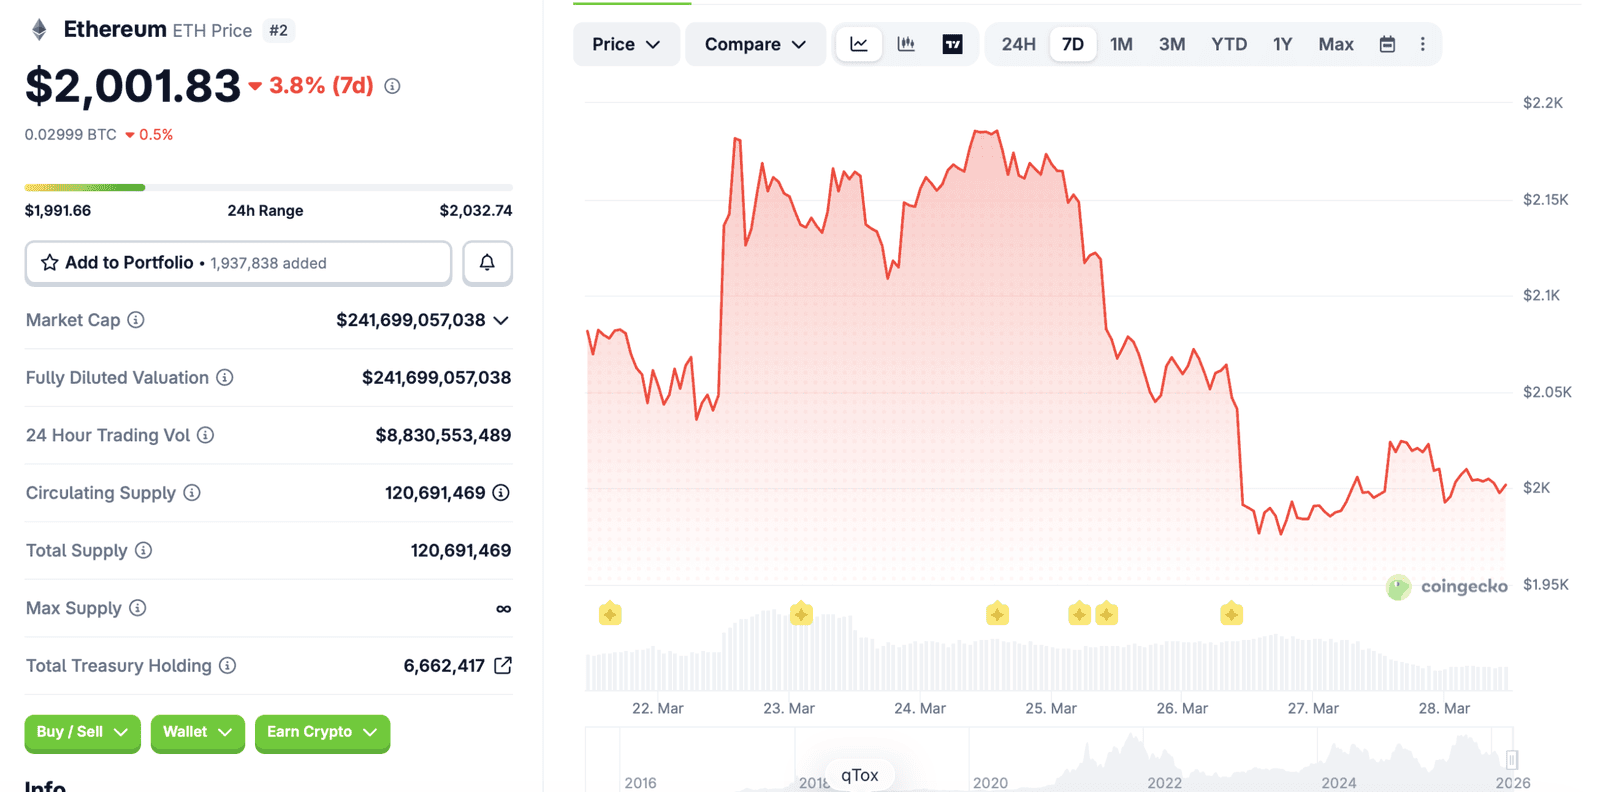
ETH dipped below $2,000 again today, touching $1,992 before a feeble bounce to $1,993. This isn’t a flash crash – it’s a slow bleed. The 60-day drawdown stands at -33.72%. Since its August 2025 all-time high of $4,946, Ethereum has lost nearly 60% of its value.
For context, Bitcoin is down 47% from its ATH. Solana, 69%. But ETH’s underperformance relative to BTC has become the story nobody can ignore.
The ETH/BTC Ratio Just Broke a Five-Year Floor
ETH/BTC sits at 0.030. That’s not a typo.
The ratio, which measures Ethereum’s price relative to Bitcoin, hasn’t been this low since early 2021 – before the DeFi summer, before the NFT mania, before the Merge. Five years of ecosystem development, and ETH is worth less against BTC than it was when gas fees were $200.
Market dominance tells the same story. Ethereum commands just 10.16% of the total crypto market cap, down from roughly 20% a year ago. BTC dominance? 56%. The gap keeps widening.
What went wrong? A combination of L2 fragmentation siphoning fees, Solana eating DeFi and NFT volume, and the narrative shifting from “ETH is ultrasound money” to “ETH is a settlement layer nobody settles on.”
“Every altcoin promises scarcity but delivers inflation by design. Ethereum abandoned its ‘ultrasound money’ narrative the moment it became inconvenient,” said Handre, an on-chain analyst tracking ETH/BTC performance since the Merge. Since Ethereum’s shift to Proof of Stake in September 2022, ETH has underperformed BTC by 65%.
Key Levels: $2,000 Is Psychological, Not Technical
Support:
- $1,990-$2,000 – psychological floor, tested repeatedly this week. Today’s low: $1,992.
- $1,850 – February 2026 swing low. If $2K breaks convincingly, this is next.
- $1,198 – Citigroup’s bear case target (March 17 downgrade).
Resistance:
- $2,033 – today’s high, immediate ceiling.
- $2,150 – last week’s rejection zone.
- $2,400 – 30-day high. Bulls need this to flip the trend.
The 200-day moving average sits around $3,200. ETH is 38% below it. The last time the gap was this wide, it was June 2022 – right before the market bottomed.
Trading volume collapsed to $9.04 billion – down from $22 billion a week ago. Low volume during a drift lower isn’t capitulation. It’s apathy. And apathy at support usually means the floor gives out.
Leverage Is Building on ETH Too
The estimated leverage ratio for ETH surged from 0.877 on March 23 to 0.960 by March 28. That’s a 9.5% jump in five days – nearly matching Bitcoin’s 12% leverage surge we covered earlier.
Open interest climbed to 14.55 million ETH – the highest level since August 24, the day ETH printed its all-time high – which means traders are stacking leveraged bets at a price point 60% below that peak, either calling a generational bottom or walking into a liquidation buzzsaw.
With BTC leverage also elevated at 0.237, the entire derivatives market is a tinderbox. A sharp move in either direction liquidates one side.
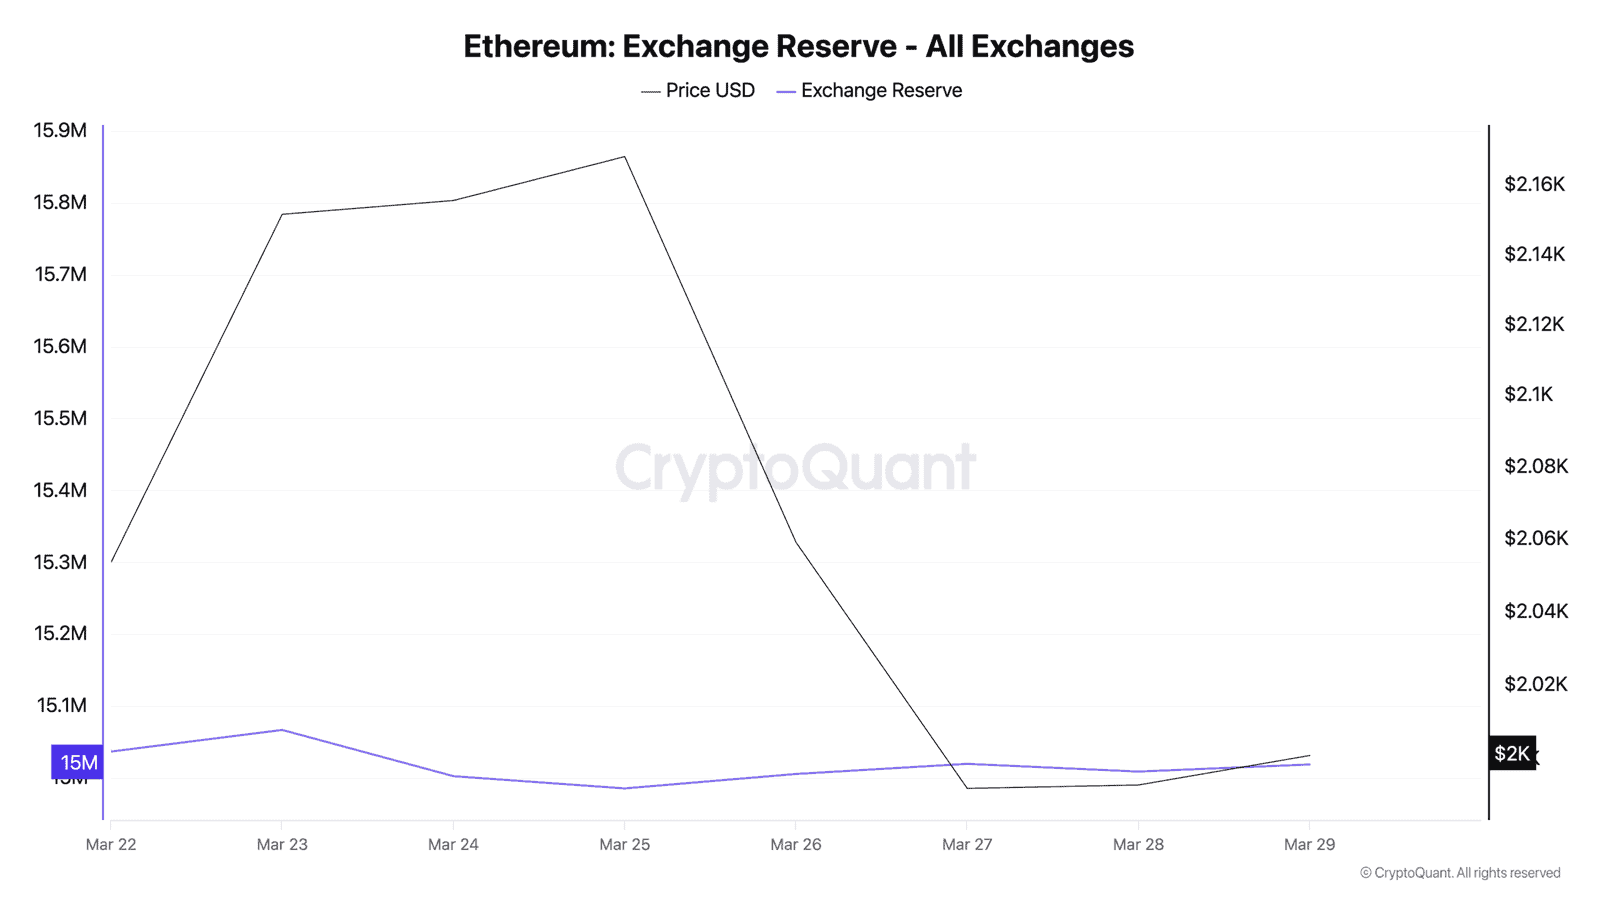
One Quiet Signal: 10,770 ETH Left Exchanges Yesterday
Not everything is bearish.
Exchange reserves dropped by 10,770 ETH on March 28 – from 15,019,793 to 15,009,023. Worth about $21.4 million. Not whale-level, but it breaks a two-day inflow streak.
The broader picture over the past week: reserves dropped from 15,066,899 (March 23) to 15,009,023 (March 28). That’s -57,876 ETH leaving exchanges – roughly $115 million in potential accumulation.
Compare that to BlackRock’s ETHB staked ETF pulling $155 million on day one last week. Institutional appetite for ETH exists. It’s just not reflecting in price yet.
DeFi Still Lives on Ethereum – But the Moat Is Shrinking
Ethereum’s $97.6 billion in Total Value Locked still dwarfs every competitor. Solana holds $8.2 billion. BSC, $5.4 billion. By raw TVL, ETH remains king.
But the trend lines tell a different story. Solana’s TVL grew 340% year-over-year. Ethereum’s grew 12%. Base, Coinbase’s L2, went from near-zero to $3.8 billion in twelve months. Every dollar flowing into L2s and alt-L1s is a dollar that used to pay gas fees on Ethereum mainnet, and with Layer 2s now processing 926 operations per second compared to mainnet’s 22, the fee revenue that once made ETH “ultrasound” has all but evaporated.
Aave still commands $26.5 billion on Ethereum – that’s not going anywhere soon. Lido holds $24 billion in staked ETH. The DeFi blue chips remain anchored. But the marginal user, the degen, the NFT trader – they moved to Solana and Base months ago. And marginal users drive price action.
The 2 million daily active addresses on Ethereum look healthy until you realize Solana processes 2.9 million. For a network trading at 29x Solana’s market cap, that gap should concern long-term holders.
The Bull Case Nobody Wants to Hear
ETH at $1,993 with a $240 billion market cap is smaller than Netflix. For a network that processes the majority of global DeFi volume, hosts $97 billion in TVL, and recently got its first staked ETF from BlackRock.
The long-term prediction models still point to $3,000-$4,500 by year-end if macro conditions improve. But “if” is doing a lot of heavy lifting right now.
With leverage building, dominance at historic lows, and $2,000 barely holding – the next 48 hours matter. A daily close below $1,980 opens the floodgates to $1,850. A reclaim of $2,033 buys time, nothing more.
Ethereum needs a catalyst. Right now, it doesn’t have one.
This is not financial advice. DYOR. Data as of March 29, 2026.
Leave a Reply