🕑 4 min read
Ethereum closes the worst quarter since FTX for major cryptos – and the damage relative to Bitcoin makes it look even uglier.
Bitcoin lost 47% from its all-time high by the end of Q1. Ethereum? Nearly 59%. And the gap keeps widening.
ETH trades at $2,037 as of Monday, down 1.07% over the past 24 hours and 5.4% on the week. Two weeks ago it sat above $2,325 – that’s a 12.4% haircut in 14 days. The all-time high of $4,946 from August 2025 feels like a different era.
But the on-chain picture tells a more nuanced story in today’s ethereum price analysis. Exchange reserves just hit their lowest level in over a week. Leverage – which surged 19% in six days – is finally unwinding. And the ETH/BTC ratio? It’s sitting at a level not seen since 2021.
The Ratio That Keeps Getting Worse
ETH/BTC at 0.0305.
That’s the number that defines Ethereum’s Q1 more than any other metric. For every dollar Bitcoin fell, Ethereum fell harder. For every bounce Bitcoin caught, Ethereum caught a smaller one.
At 0.0305, the ratio sits near its lowest reading since early 2021 – before the DeFi summer, before the NFT boom, before the merge to proof-of-stake. Five years of Ethereum development, and the market is pricing it like none of it mattered.
“Ethereum has an execution problem, not a technology problem,” said Justin Bons, founder of Cyber Capital. “The L2 roadmap is cannibalizing mainnet revenue while Solana captures the user growth.”
Dominance tells the same story. Ethereum’s share of total crypto market cap hovers around 10% – a far cry from the 18-20% range it held through most of 2024. Bitcoin dominance, meanwhile, keeps climbing above 50%.
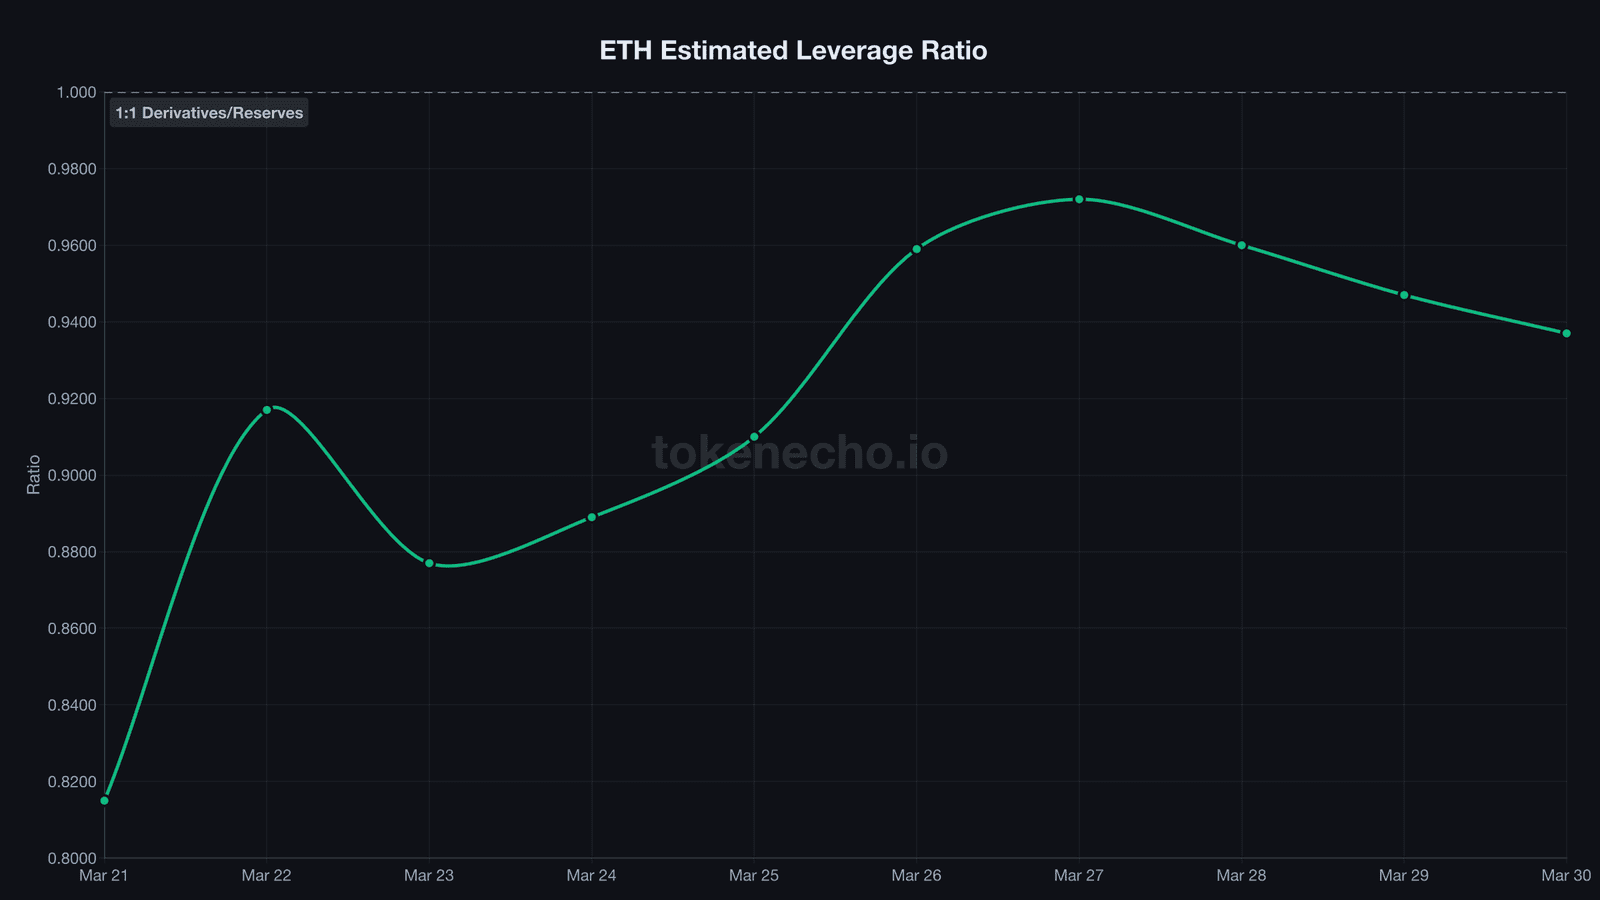
Leverage Peaked at 0.972 – Dangerously Close to 1:1
The estimated leverage ratio for ETH hit 0.972 on March 27. That’s derivatives open interest sitting at 97.2% of total exchange reserves.
Think about that for a second. For every 100 ETH sitting on exchanges, 97 ETH worth of derivative contracts existed on top of them. The margin for error was essentially zero.
Since then, leverage has been declining – 0.960 on March 28, 0.947 on March 29, 0.937 on March 30. A 3.6% pullback from the peak. Our previous ETH analysis caught the early signs of this cooldown, but the decline has accelerated.
For context, ETH leverage sat at 0.815 on March 21. It surged 19.3% in six days to the 0.972 peak. That kind of leverage buildup during a downtrend is a liquidation cascade waiting to happen. The fact that it’s now unwinding without a violent flush is – cautiously – a good sign.
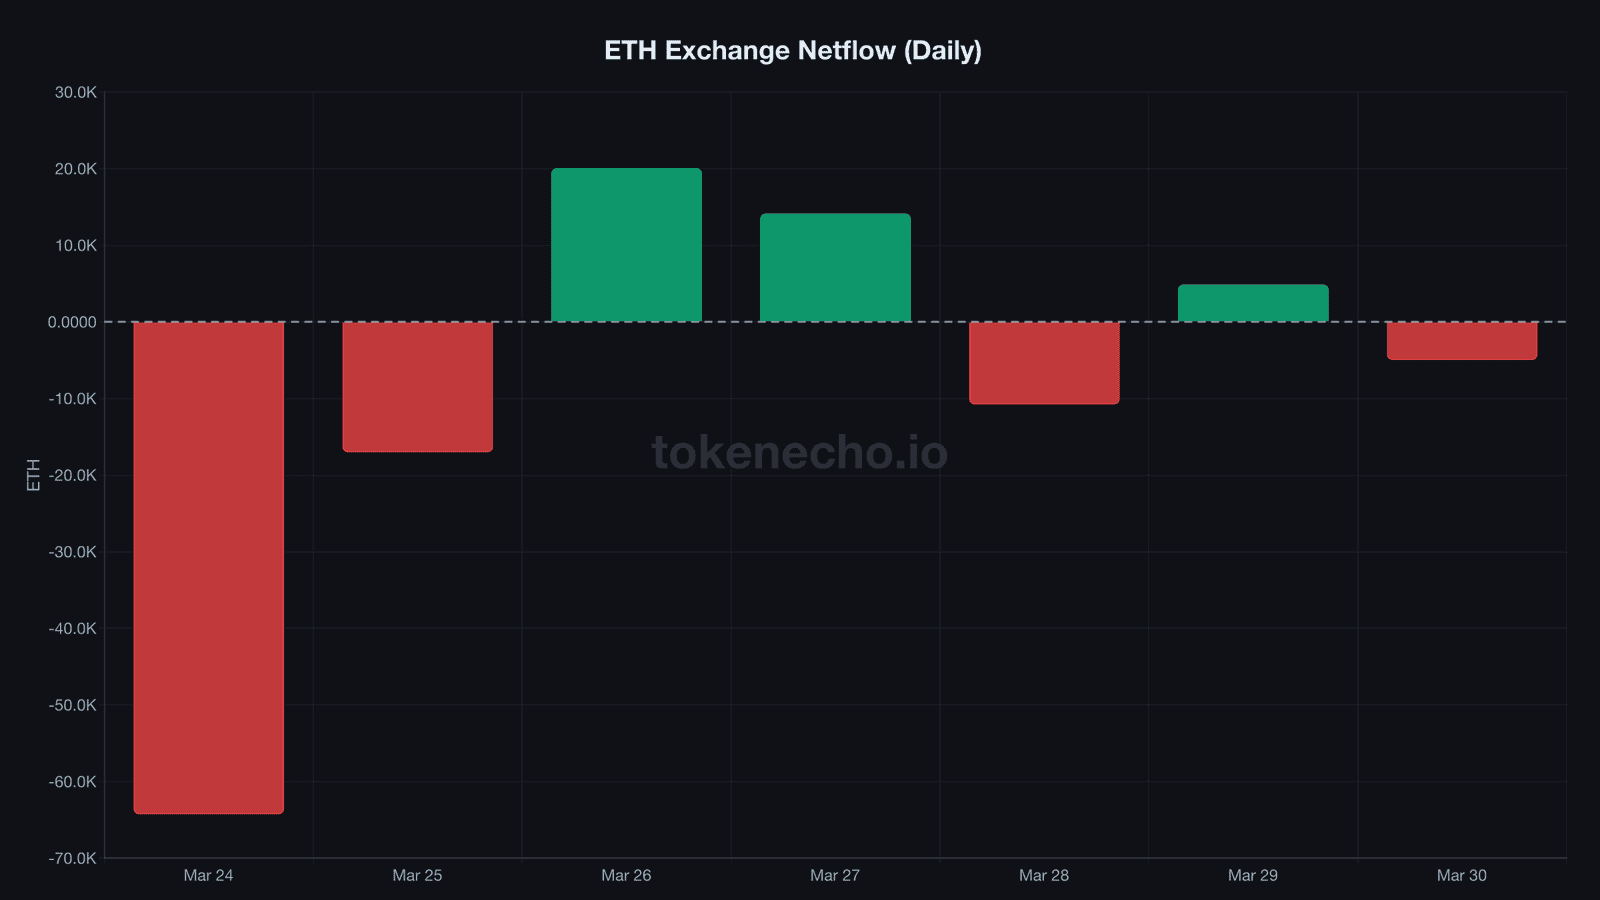
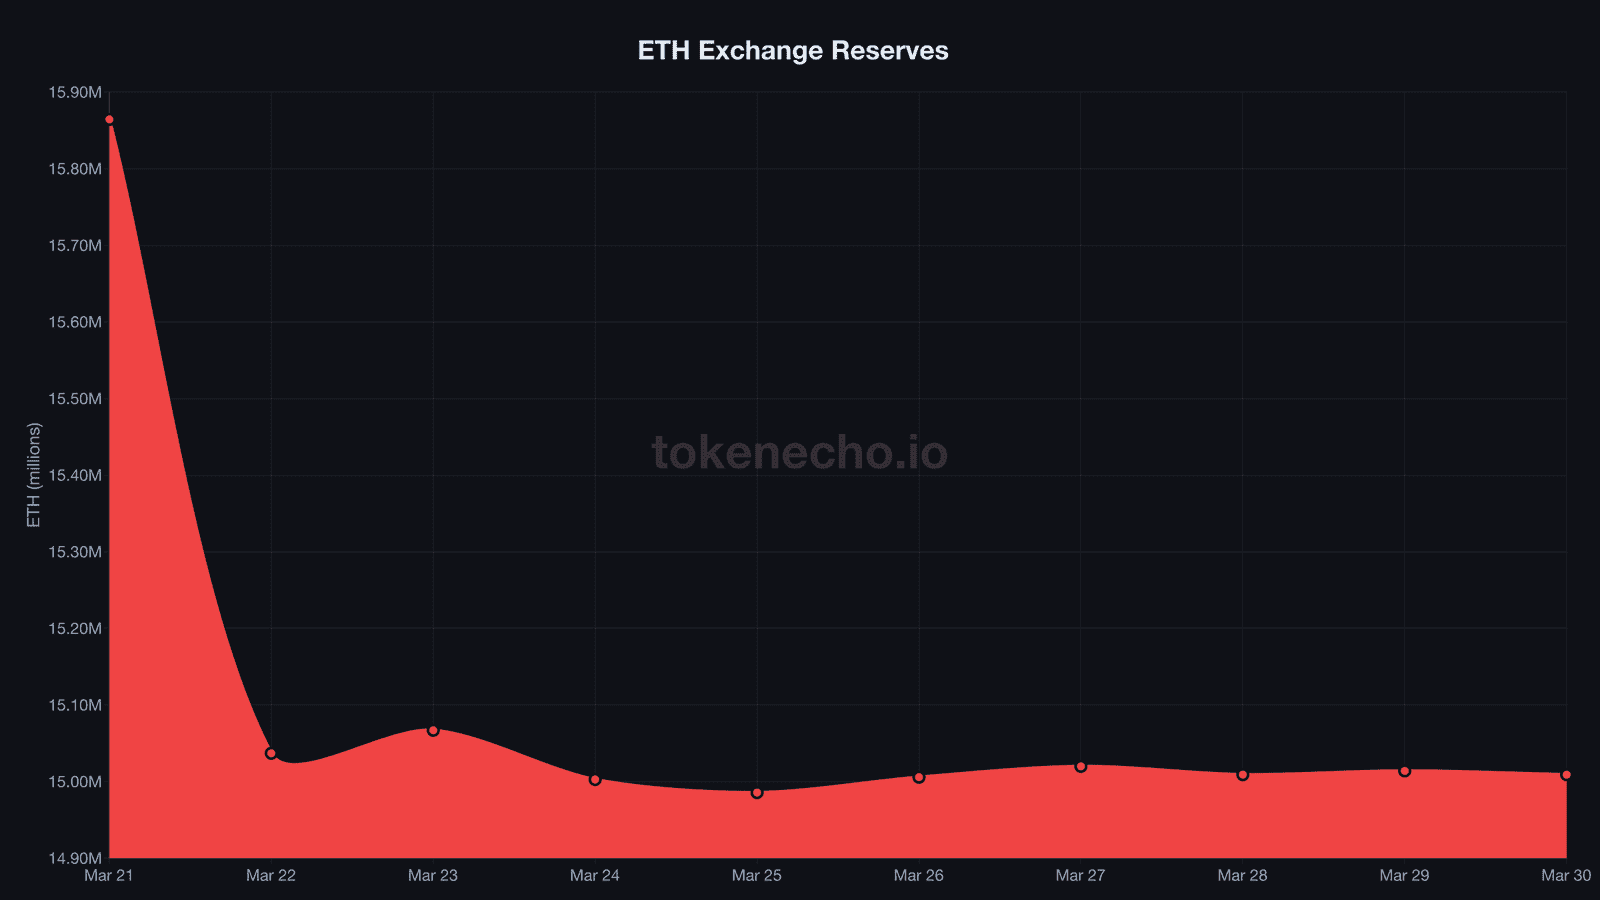
Exchange Reserves Hit Local Low
Ethereum exchange reserves dropped to 15,008,919 ETH on March 30 – the lowest reading since March 25.
The journey here was volatile. On March 24, a single-day outflow of 64,271 ETH marked the largest daily withdrawal of the month. Reserves bottomed at 14,985,609 on March 25, then choppy flows pushed them back up to 15,019,793 by March 27.
Now they’re sliding again. The March 30 netflow came in at -4,974 ETH – not dramatic, but it’s outflow. Someone is pulling ETH off exchanges even as the price bleeds.
Zooming out further, exchange reserves sat at 15,864,206 on March 21. That’s a decline of over 855,000 ETH in nine days – roughly $1.74 billion at current prices. The March 22 reshuffle accounted for a large chunk of that, but the trend since has been consistently lower.
Q1 Report Card: ETH vs BTC
The numbers don’t lie. And they don’t flatter Ethereum.
| Metric | ETH | BTC |
|---|---|---|
| Distance from ATH | -58.8% | -47.0% |
| 7-day change | -5.4% | -6.2% |
| 14-day change | -12.4% | -9.7% |
| 60-day change | -25.5% | -19.1% |
| Leverage ratio | 0.937 | 0.228 |
| Exchange reserve trend | Declining | Rising |
One interesting divergence: BTC exchange reserves have been rising (inflows for 6 straight days), while ETH reserves keep falling. Coins flowing onto Bitcoin exchanges suggest selling pressure. Coins flowing off Ethereum exchanges suggest accumulation – or at minimum, movement to staking and DeFi protocols.
ETH’s leverage ratio at 0.937 dwarfs Bitcoin’s 0.228. Ethereum’s derivatives market is nearly four times more leveraged relative to its spot reserves. That’s both a risk and an opportunity – any sharp move in either direction will be amplified.
Key Levels for April
Support: $2,014 (today’s intraday low), $2,000 (psychological level – defended repeatedly since March 25), and $1,850 (next major support if $2K breaks).
Resistance: $2,079 (today’s intraday high), $2,150 (March 27 local high), and $2,400 (pre-crash consolidation zone).
The $2,000 level has become ETH’s line in the sand. It’s been tested and held multiple times over the past week, but each bounce gets weaker. The 14-day decline of 12.4% suggests momentum is firmly bearish.
BlackRock’s staked ETH fund ETHB debuted with $155 million on day one just last week – beating its own IBIT Bitcoin ETF debut by 40%. Institutional interest in Ethereum isn’t dead. But it hasn’t translated to price support yet.
Whether $2K holds into April or ETH finally breaks below it depends largely on whether that leverage continues unwinding quietly – or unwinds all at once.
This analysis is part of our daily Ethereum price tracking. See all previous analyses and key metrics on our hub page.
This is not financial advice. DYOR. Data as of March 31, 2026.
Sources
- CoinGecko Ethereum data (price, market cap, ATH, volume)
- CryptoQuant ETH Exchange Netflow
- CryptoQuant ETH Exchange Reserve
- CryptoQuant ETH Estimated Leverage Ratio
Leave a Reply