
The Bond Market Pays 4.5% Risk-Free – So Why Are Bitcoin Whales Buying the Most in 11 Years?
🕑 5 min read
The 10-year Treasury yield just hit its highest level in a year. Bitcoin crashed below $67,000. And the biggest wallets on the network won’t stop accumulating.
Forty-six days.
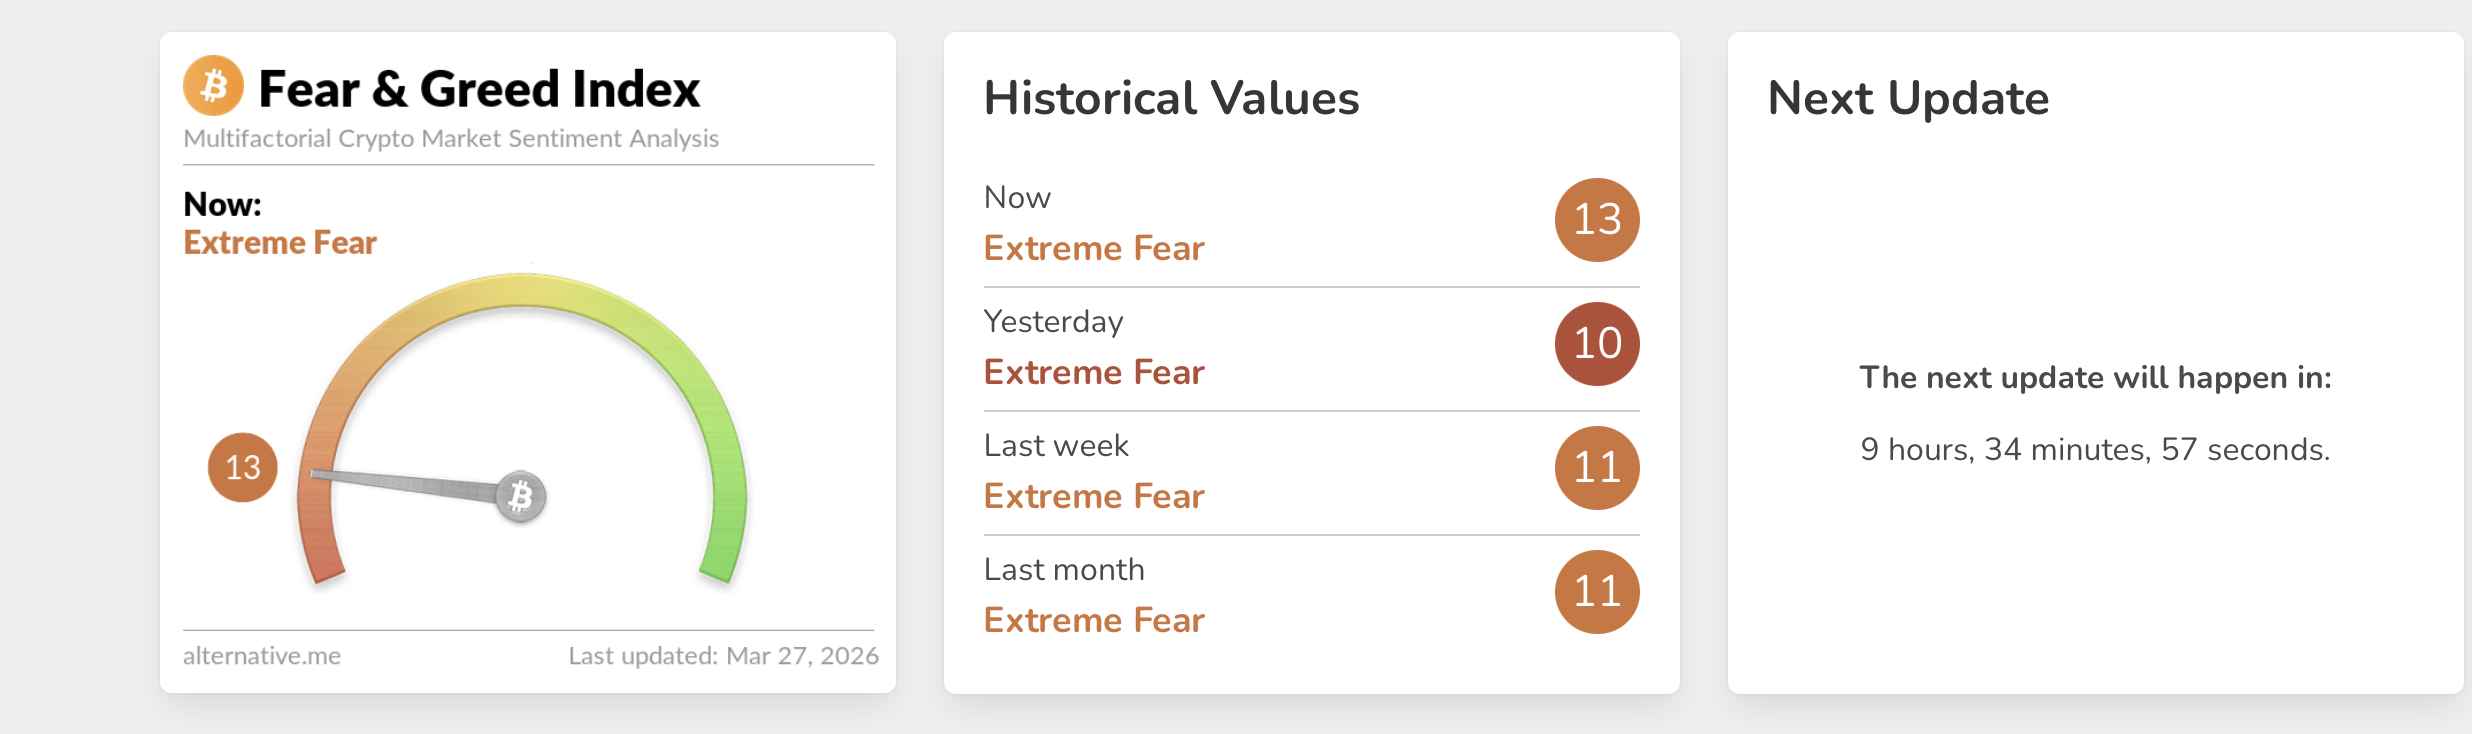
That’s how long the Crypto Fear & Greed Index has lived below 20 – deep in “extreme fear” territory, touching 8 this week. That’s the longest unbroken streak since the FTX implosion in November 2022. For context, the index bottomed at 6 during the June 2022 capitulation and hit 9 during the COVID crash of March 2020.
But this isn’t a story about fear. It’s about what’s happening underneath it.
The 4.5% Gravity Well
The U.S. 10-year Treasury yield crept toward 4.5% on March 27, a level not seen since July 2025. That’s a 45-basis-point jump since the Iran conflict kicked off in late February. And it’s dragging everything down with it.
Why does a government bond matter to Bitcoin? Because 4.5% risk-free changes the math for every allocator on the planet. A pension fund, a family office, even a crypto-curious hedge fund – they all stare at that number and ask the same question: why take the volatility?
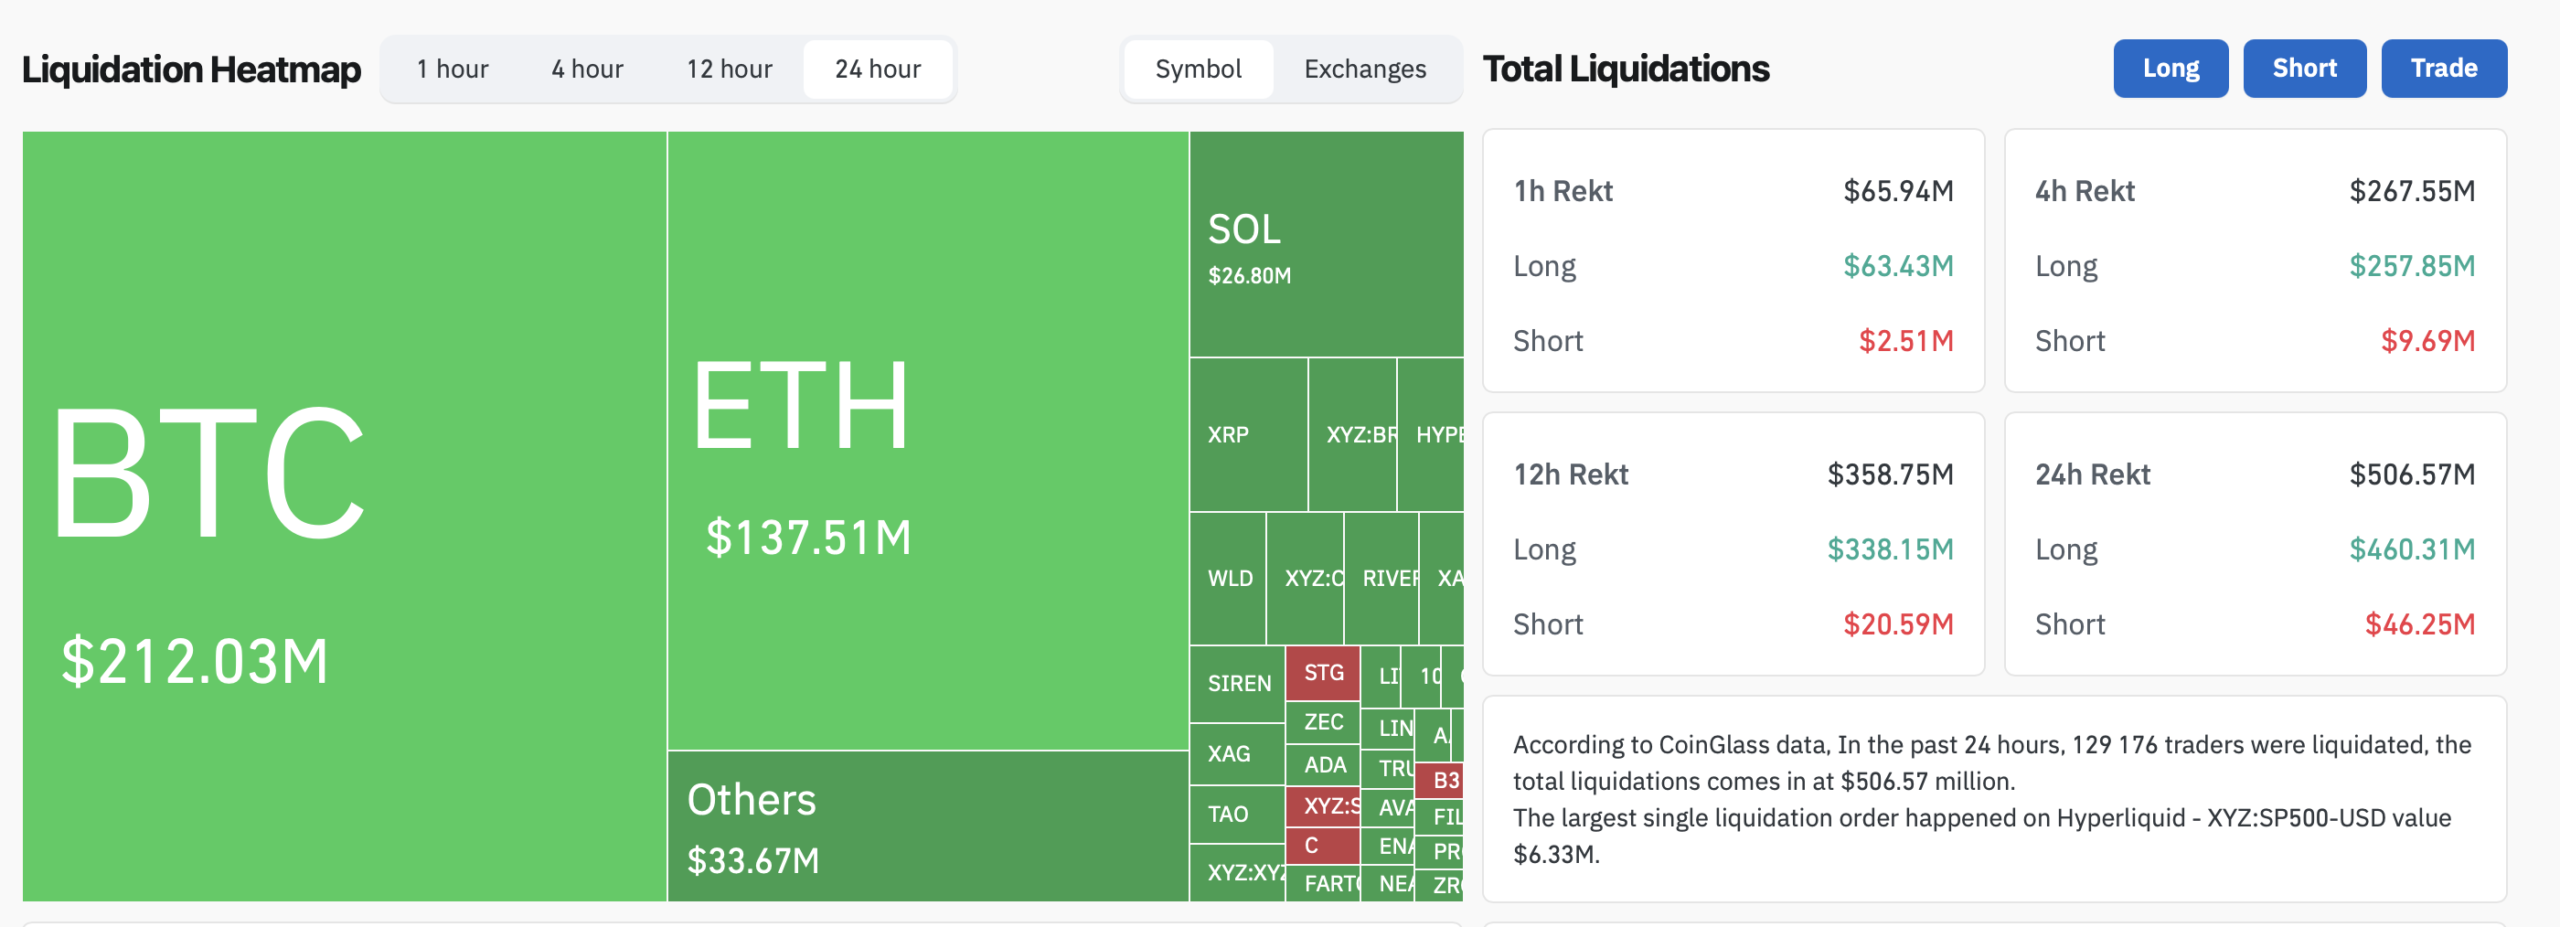
Bitcoin tumbled below $67,000 for the first time since March 9, shedding 3% in 24 hours. Over $193 million in longs got liquidated. The MOVE index, a gauge of bond market volatility that institutional desks watch religiously, spiked 18% overnight.
“Bitcoin is not pumpable right now,” Ki Young Ju, CEO of CryptoQuant, said in a recent post. “$308 billion in capital flowed into the asset in 2025, yet market cap fell by $98 billion. Selling pressure is too heavy for any multiplier effect.”
So that’s the bearish case in one sentence: yields up, BTC down, nobody can push the price higher. Simple enough.
Except the on-chain data tells a completely different story.
Whales Don’t Read the Fear Index
Wallets holding 100 or more BTC just crossed 20,000 for the first time in Bitcoin’s history. That’s not a typo. Never before have this many large wallets existed on the network. Addresses holding 1,000+ BTC climbed to 2,140 – and they’ve been growing through every leg down since January.
Who’s buying while retail panics? The same cohort that accumulated 45,000 BTC in a single month through Strategy alone, while every other corporate buyer went quiet. The same whales who stacked 91,000 BTC during the last fear spike when the index hit 10 just five days ago.
Exchange reserves tell the same story from a different angle. Just 2.21 million BTC sit on centralized exchanges right now – 5.88% of circulating supply. That’s the lowest since December 2017. Coins aren’t moving to exchanges to be sold. They’re moving off exchanges into cold storage, DeFi protocols, and ETF custodians.
This creates a paradox that should make any macro trader uncomfortable: the bond market screams “sell risk assets,” but the actual owners of Bitcoin are doing the exact opposite.
92% Underwater – and That’s the Point
Short-term holders, anyone who bought within the last 155 days, control roughly 5.7 million BTC. And 92% of them are sitting at a loss. Their average cost basis? Around $84,000. With spot at $67,000, that’s a 20% drawdown before fees and slippage.
This is the capitulation setup. These underwater holders represent the sell pressure ceiling – every bounce toward $70K gets met with people desperate to break even. CryptoQuant’s data confirms it: “Recent buyers are underwater, creating sell pressure on every bounce.”
But – and this is the part most analysis skips – capitulation among short-term holders has historically been the fuel for the next leg up. When weak hands sell to strong hands at a loss, the supply structure tightens. We saw this play out after every major shakeout since 2018.
Think of it like a real estate market where overleveraged flippers dump properties to cash buyers at 20 cents on the dollar. Painful for the flipper. But that concentrated ownership becomes the foundation for the next price run.
What the Bond Market Got Right – and What It’s Missing
The Treasury market isn’t wrong. Rising yields genuinely compress risk appetite. When real yields turn increasingly positive, assets that don’t generate cash flow – Bitcoin, gold, growth stocks – face a gravitational pull downward. That’s econ 101.
And the Iran war premium isn’t helping. Brent crude above $100 keeps inflation expectations elevated, which keeps the Fed pinned, which keeps yields climbing. It’s a vicious loop.
But the bond market isn’t pricing in Bitcoin’s supply mechanics. It can’t. Treasuries respond to macro flows, not to the fact that miners are capitulating at $19K losses per coin and still refuse to sell their reserves, or that exchange supply just hit a seven-year low.
The 4.5% yield is a real gravitational force. But gravity works differently when there’s almost nothing left to pull down.
The Historical Playbook Nobody Wants to Trust
Every time the Fear & Greed Index dropped to single digits while whale accumulation intensified, what followed wasn’t a slow grind. It was a violent repricing.
June 2022: index at 6. BTC rallied 57% over the next 90 days. March 2020: index at 8. BTC surged 168% in three months – one of the most explosive recoveries in financial history. December 2018: index at 10. BTC gained 95% by spring.
Does the pattern hold in a rising-yield environment? That’s the trillion-dollar question. In March 2020, the Fed slashed rates to zero within weeks of the bottom. In 2022, rates were still climbing but slowing. Today, the 10-year sits near 4.5% with no rate cuts on the immediate horizon.
So the setup rhymes, but the macro backdrop doesn’t.
What’s different this time is the institutional infrastructure. In 2020 and 2022, there were no spot Bitcoin ETFs. No $17 billion options expiries on Deribit. No Morgan Stanley or Goldman Sachs with crypto on their balance sheets. The plumbing has changed, even if the sentiment hasn’t.
Who Blinks First?
The bond market and the whale wallets can’t both be right. Either yields retreat – because the Fed pivots, because the Iran situation de-escalates, because growth slows enough to cap inflation – and risk assets rip. Or yields push through 4.5% toward 5%, and even the diamond-handed whales start feeling the pressure.
The 4.5%-4.6% range carries political weight, too. That’s the threshold where Trump reversed his tariff policy last April. It’s where mortgage rates start breaking 7.5%. It’s where the fiscal math on government debt gets genuinely scary.
For now, Bitcoin sits in the crossfire between a bond market offering its best risk-free returns in over a decade and a supply structure that’s never been tighter. Forty-six days of extreme fear. Record whale accumulation. And a yield curve that won’t quit.
Something has to give.
This is not financial advice. DYOR. Data as of March 27, 2026.