
🕑 6 min read
The crypto market clawed back roughly $160 billion this week. An Iran ceasefire, the cheapest Bitcoin ETF in history, and a privacy coin rally produced the strongest seven-day performance since February – and yet the on-chain data underneath tells a more complicated story than the green candles suggest. This crypto weekly roundup covers April 5-12, 2026.
Key Takeaways
- Bitcoin gained 7% to $71,575 as Iran’s two-week ceasefire and Morgan Stanley’s MSBT ETF – charging just 0.14%, the cheapest ever – triggered the week’s relief rally.
- SOPR, a metric tracking whether sellers book profits or losses, broke above 1.0 after 13 straight days of capitulation-level selling. But leverage already climbed 5% back toward pre-crash highs.
- Zcash surged 50% on Grayscale’s first-ever privacy coin ETF filing and SEC investigation clearance, while ADA (-12%) and BNB (-11%) posted the worst 30-day losses among top-15 coins.
Data Comparison
| Metric | Apr 12 | Apr 5 | 30d ago | Signal |
|---|---|---|---|---|
| BTC Price | $71,575 | $66,924 | ~$71,790 | ▲ Bullish |
| ETH Price | $2,214 | $2,044 | ~$2,101 | ▲ Bullish |
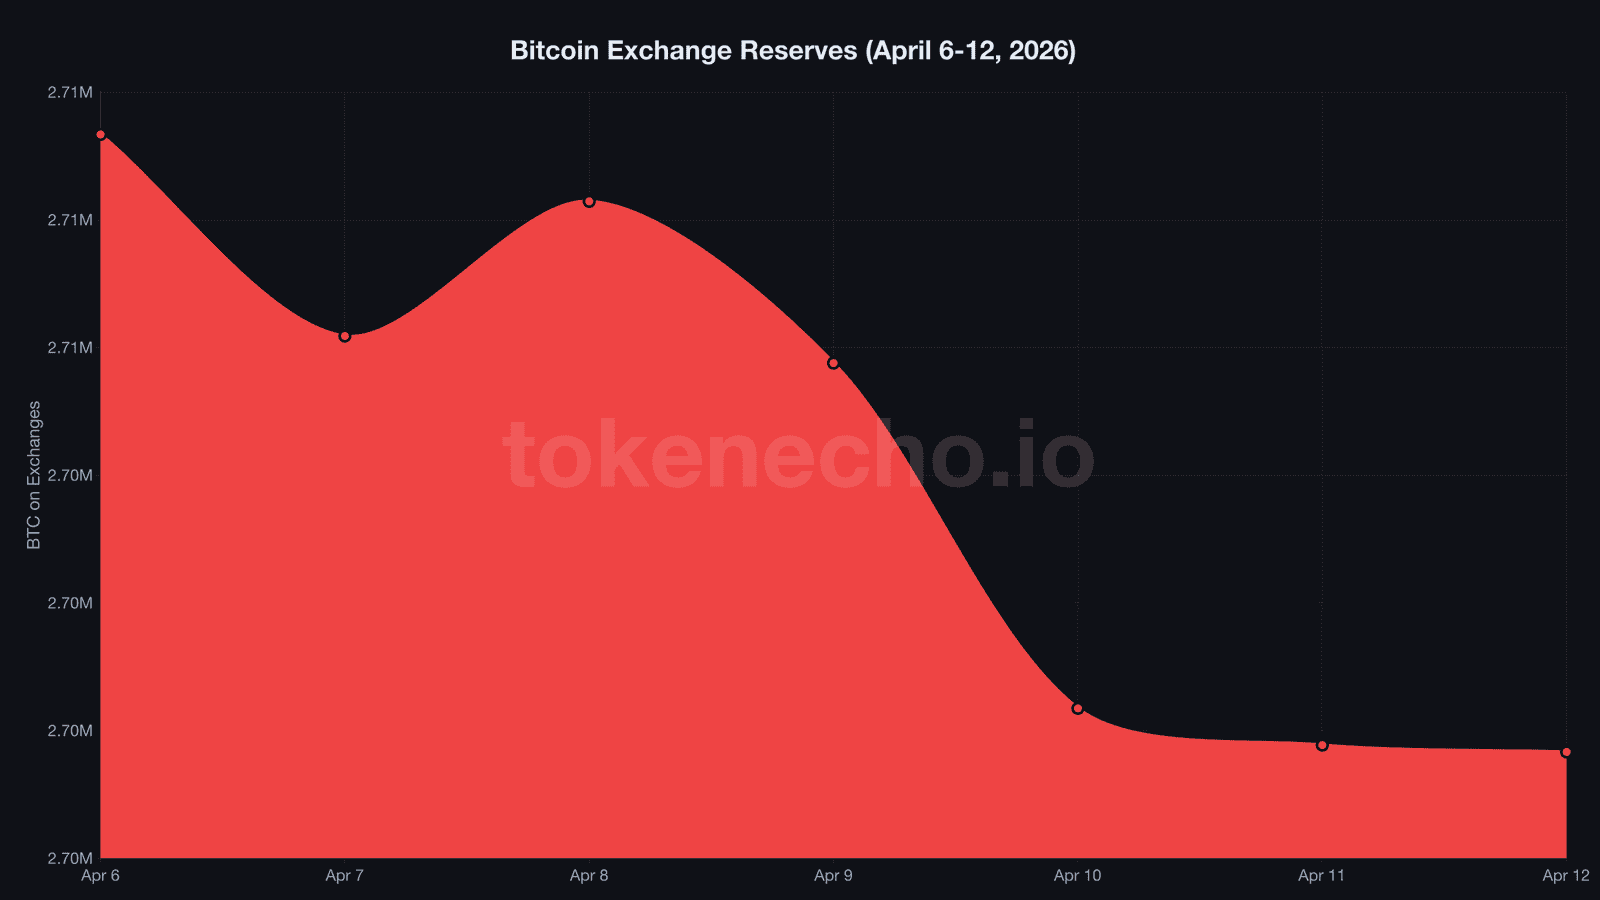
| BTC Exchange Reserves | 2.700M | 2.709M | ~2.724M | ▲ Bullish |
| MVRV | 1.349 | 1.274 | 1.304 | ▲ Bullish |
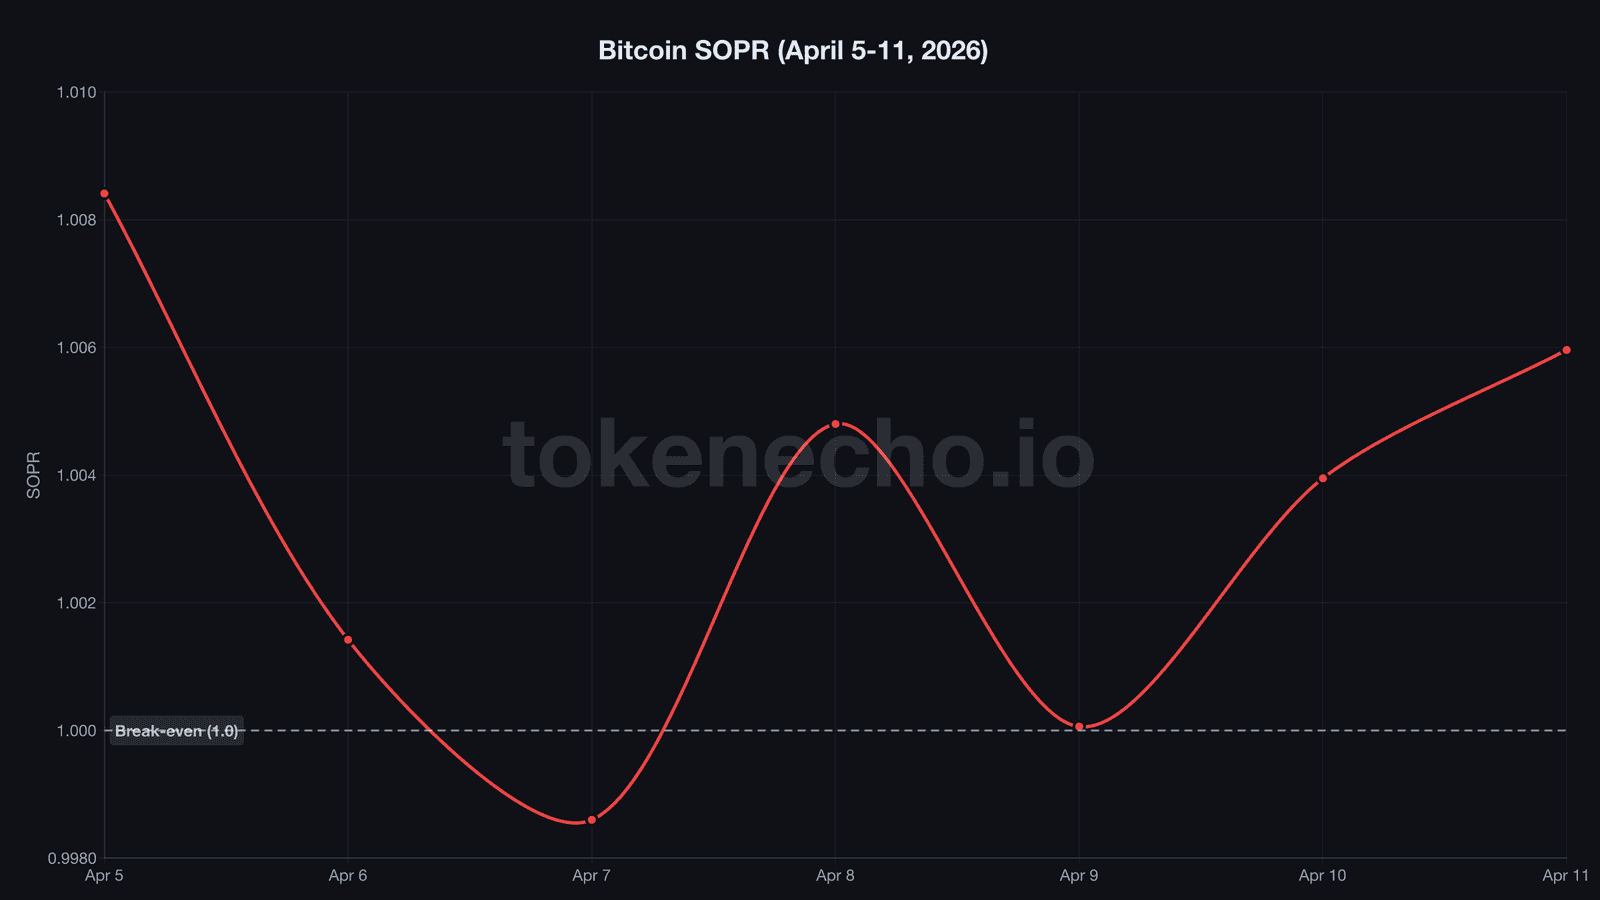
| SOPR | 1.006 | 1.008 | ~1.01 | ⚠️ Caution |
| NUPL | 0.258 | 0.215 | ~0.28 | ▲ Bullish |
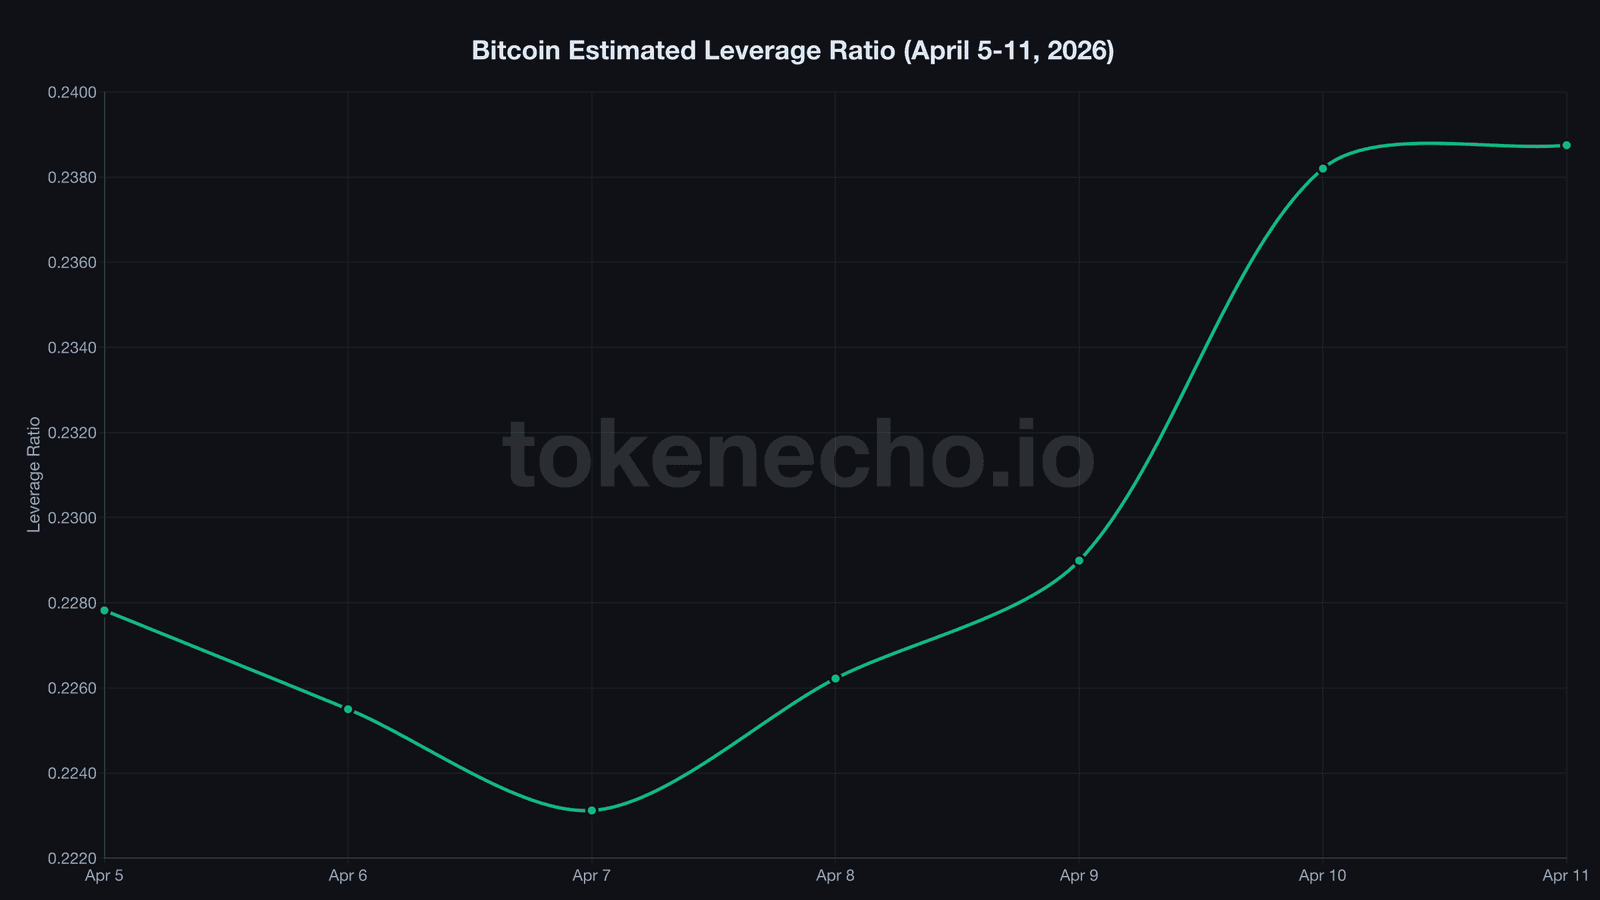
| Leverage Ratio | 0.239 | 0.228 | ~0.240 | ⚠️ Caution |
| Puell Multiple | 0.638 | 0.756 | ~0.72 | ▼ Bearish |
| SSR | 10.81 | 10.22 | ~10.0 | ▲ Bullish |
Iran ceasefire and a 0.14% ETF lit the fuse
Two weeks ago, every on-chain indicator screamed capitulation. Then a phone call between Tehran and Washington changed everything.
Iran agreed to a two-week ceasefire on April 8 – two hours before Trump’s deadline expired. Bitcoin jumped 4% to $72K within hours.
Ethereum outperformed, surging 8% to $2,230 as exchanges liquidated $150 million in short positions over six hours. That kind of short squeeze hadn’t hit since early February.
The next morning brought catalyst number two. Morgan Stanley launched MSBT, a spot Bitcoin ETF charging just 0.14% – that’s 44% cheaper than BlackRock’s IBIT.
The fund gives 16,000 Morgan Stanley advisors managing $6.2 trillion a direct path to Bitcoin. “This is the most aggressive fee undercut we’ve seen in spot Bitcoin ETFs,” said Eric Balchunas, senior ETF analyst at Bloomberg Intelligence.
Total crypto market cap climbed to $2.51 trillion. BTC dominance held at 57%.
But the week’s real standout was Zcash, which rallied 50% on a triple catalyst stack: Grayscale’s first-ever privacy coin ETF filing, the SEC closing its investigation, and Foundry launching an institutional mining pool. HYPE tagged along at +14%. TRX gained 11% on the month.
Not everyone joined the party. ADA dropped 12% over 30 days – now 92% below its all-time high and the worst-performing top-15 asset this quarter. BNB shed 11%. SOL still sits 72% below its January 2025 peak despite a modest 3.4% weekly bounce.
The last time a geopolitical de-escalation triggered this kind of bounce was Liberation Day in April 2025. Tariffs crashed BTC 10.4% – then it rallied 50% to all-time highs within six weeks.
The current setup rhymes. But does it repeat?
SOPR breaks 1.0 after 13 days – long-term holders still bleed
2.874.
That was Bitcoin’s LTH-SOPR on April 5, meaning long-term holders who sold that day locked in 187% average profits. Twenty-four hours later, it crashed to 0.845.
The profit-taking wave didn’t taper. It ran out of sellers.
What caught our attention was what followed. SOPR, which tracks whether the average Bitcoin seller books a profit or a loss, broke back above 1.0 on April 6 after spending 13 straight days below that threshold – every extended sub-1.0 SOPR streak since 2020 has ended at either a local bottom or a cycle bottom, making this the kind of signal that doesn’t come around often.
NUPL, the network’s aggregate unrealized profit-and-loss gauge, climbed from 0.215 to 0.258. That’s still in the “hope/fear” zone, but it’s pulling away from the capitulation territory that dominated late March.
And exchanges kept losing coins. Reserves dropped 9,672 BTC this week – that’s $692 million walking out the door.
Total exchange holdings fell to 2.70 million BTC. For context, reserves haven’t been this low since early 2018. Eight years of relentless outflows.
The bottom signals are stacking up. But can a rally built on leverage survive the next shock?
Leverage jumps 5% in a week – miners keep bleeding
If sellers are exhausted and reserves are draining – why is leverage climbing faster than price?
Bitcoin’s estimated leverage ratio, which compares derivative open interest to exchange reserves, jumped from 0.228 to 0.239 this week. That’s a 5% increase in seven days, pushing it right back to the levels that preceded March’s liquidation cascades.
It’s the crypto equivalent of rebuilding a house in a flood zone before the waters fully recede.
Miners can’t catch a break either. The Puell Multiple, which gauges daily miner revenue against its 365-day average, slid from 0.756 to 0.638 – a fresh cycle low.
Miners are earning 36% less than normal. The last time Puell sat this low for this long was mid-2022, when Core Scientific filed for bankruptcy.
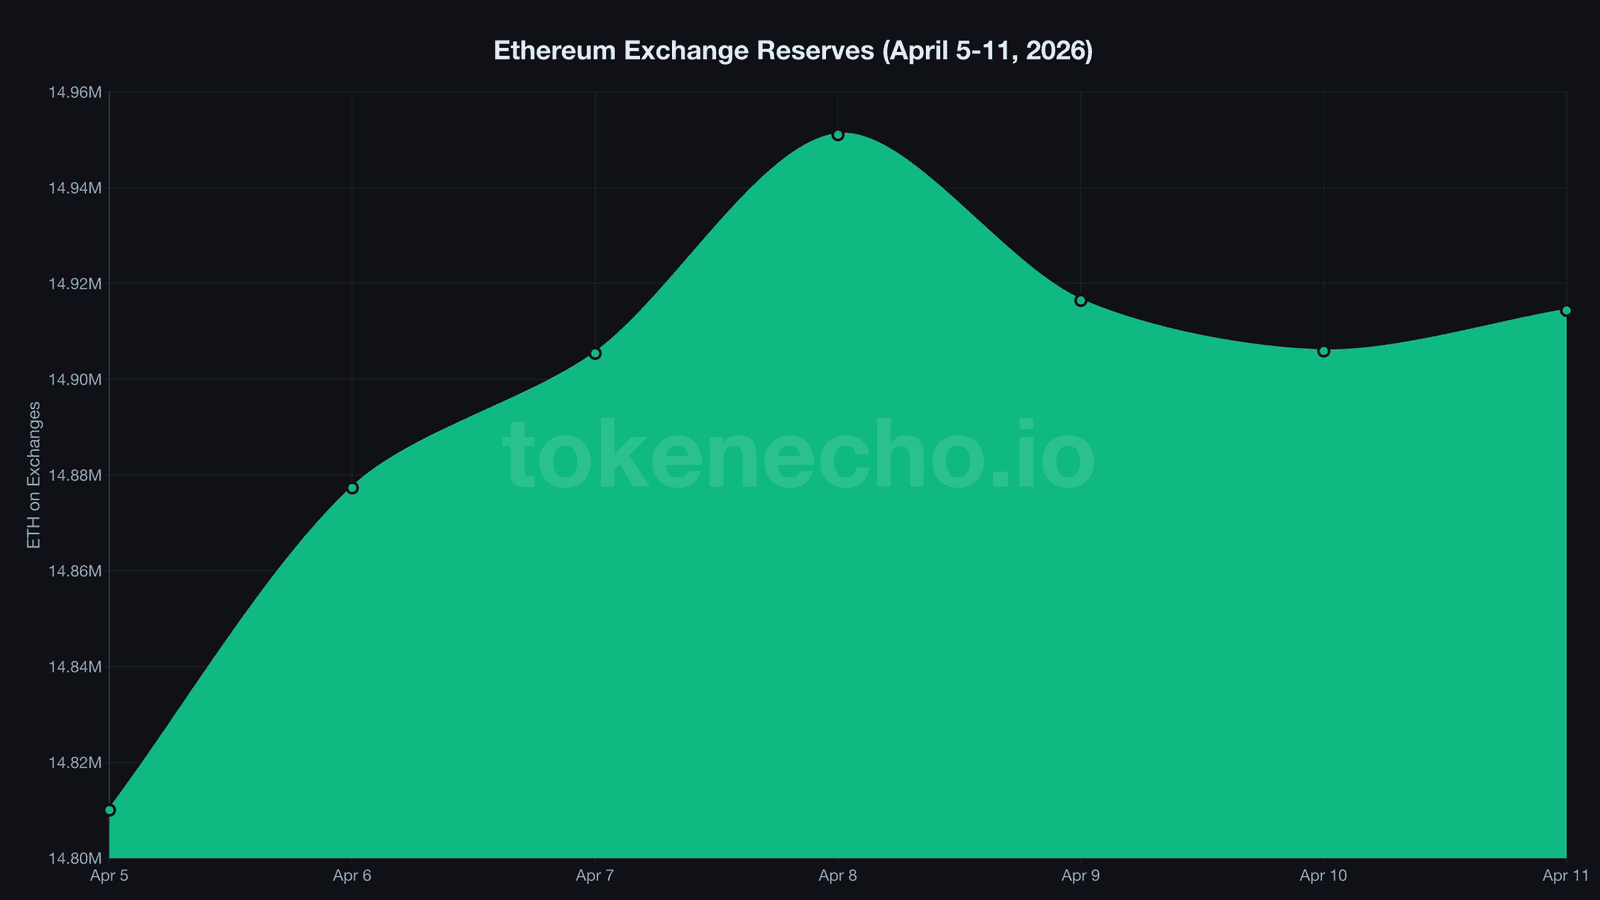
Ethereum told a different story this week – and not a bullish one. While Bitcoin saw $692 million in exchange outflows, ETH reserves actually increased by 104,346 ETH, worth roughly $231 million.
That reversal snaps a multi-week outflow streak. We’ve tracked this kind of BTC-ETH reserve divergence before – it rarely ends well for ETH.
The Stablecoin Supply Ratio, a measure of buying power relative to Bitcoin’s market cap, climbed to 10.81. That translates to roughly $140 billion in stablecoin dry powder parked on the sidelines – enough to move the market violently in either direction.
So far, it hasn’t picked one.
The last time this happened, BTC doubled in 60 days
The current SOPR-to-NUPL combination rhymes with one specific period: November 2022, right after FTX collapsed.
Back then, SOPR broke above 1.0 after a similar extended capitulation streak. NUPL sat in the 0.20-0.25 zone. MVRV hovered near 1.2. Bitcoin was at $16,000.
Within 60 days, it reached $25,000. A 56% rally that almost nobody anticipated during peak despair.
The crucial difference: leverage was completely flushed in late 2022. Traders had been wiped clean. This time, leverage is already rebuilding before the rally has a foundation under it – and if the Iran ceasefire collapses when it expires on April 22, or if reciprocal tariffs escalate further, those freshly leveraged positions become liquidation fuel all over again.
What to watch in the next 7 days
- Iran ceasefire expiration (April 22): collapse unwinds the rally. Extension likely pushes BTC toward the $74K-$75K resistance cluster.
- SOPR above 1.0 sustainability: a full week above 1.0 would confirm capitulation is over. A drop below signals dead cat bounce.
- Leverage ratio breaching 0.24: if leverage crosses 0.24 while price stalls below $73K, liquidation risk spikes sharply. Binance open interest is the canary.
This roundup is part of our weekly crypto market coverage. For daily analysis, visit our Bitcoin price tracking and Ethereum price tracking hub pages.
The ceasefire bought time. The ETF fee war bought attention. Neither resolved the leverage building underneath – and that tension will define the rest of April.
This is not financial advice. DYOR. Data as of April 12, 2026.
Sources: CoinGecko API, CryptoQuant, Bloomberg Intelligence, TokenEcho on-chain analysis.
Leave a Reply