
🕑 6 min read
The numbers from this week don’t add up. And that’s exactly why they matter.
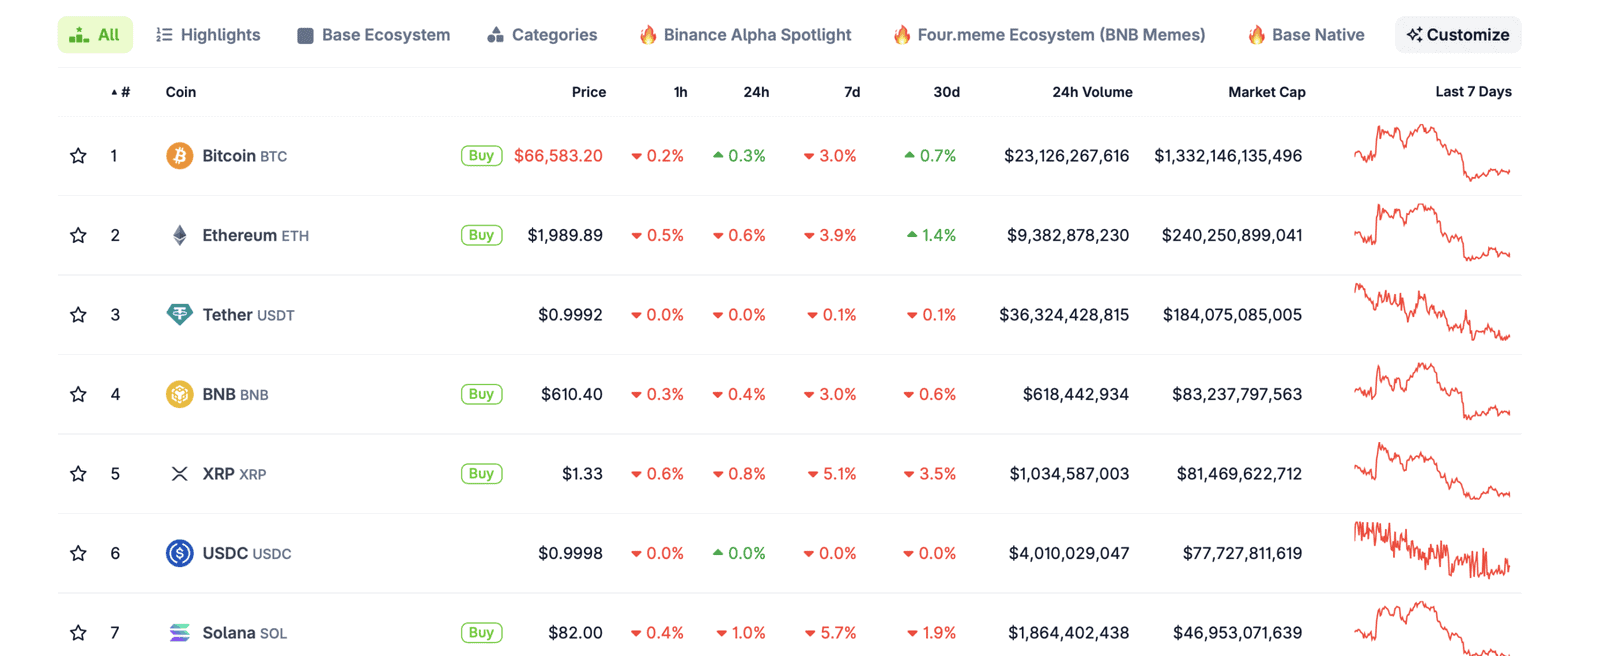
Bitcoin dropped 3% to $66,578. Ethereum slid 3.9% to $1,989. The Fear & Greed Index spent its 46th consecutive day in “Extreme Fear” territory – the longest unbroken streak since FTX collapsed in November 2022. Long-term Bitcoin holders, the so-called diamond hands who survived Luna, COVID, and the 2022 wipeout, capitulated en masse and sold at a 24% average loss.
By every sentiment indicator, this was a week of surrender.
So why did 4,264 BTC quietly leave exchanges?
Bitcoin: The Capitulation That Wasn’t
Let’s start with the ugliest chart of the week. Bitcoin’s Long-Term Holder SOPR (Spent Output Profit Ratio) cratered from 1.94 on March 22 to 0.72 by March 28. That’s not a dip – that’s a cliff. An LTH-SOPR below 1.0 means veterans are realizing losses. At 0.72, they’re selling coins acquired at prices roughly 24% higher than today’s $66.5K.
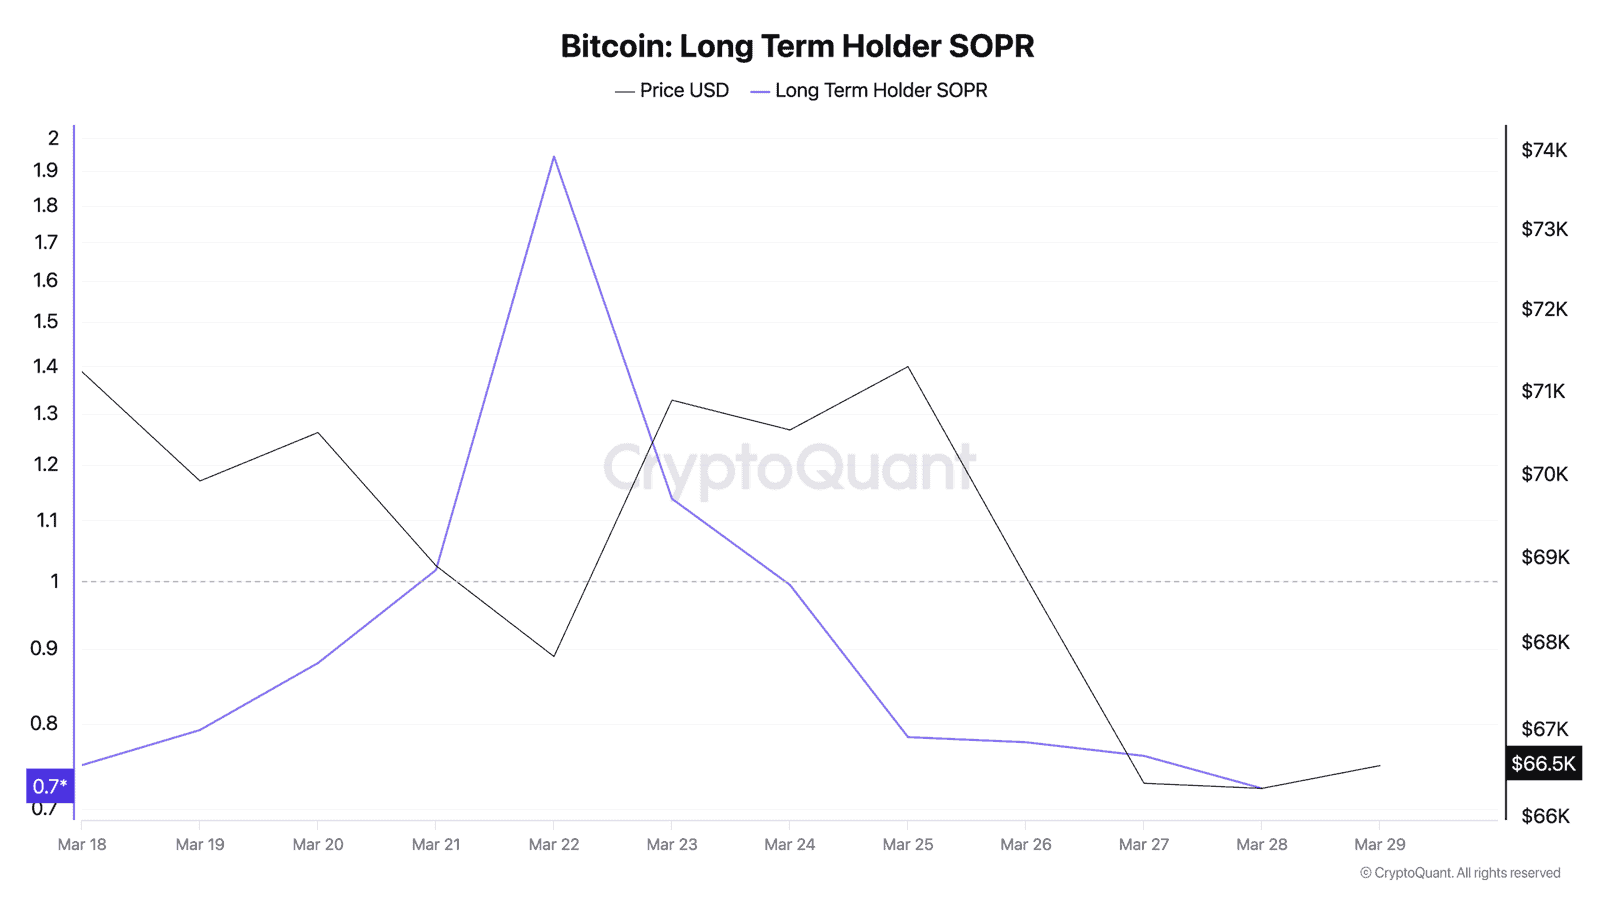
The broader SOPR stayed below 1.0 for six straight days starting March 24. Every transaction on the Bitcoin network, on average, locked in a loss. That hasn’t happened since the depths of the 2022 bear market.
MVRV (Market Value to Realized Value) slid from 1.30 to 1.22 over the week. It’s still above 1.0, meaning the average holder is technically in profit – but barely. During the FTX crash, MVRV hit 0.85. We’re not there yet, but the trajectory is pointing south.
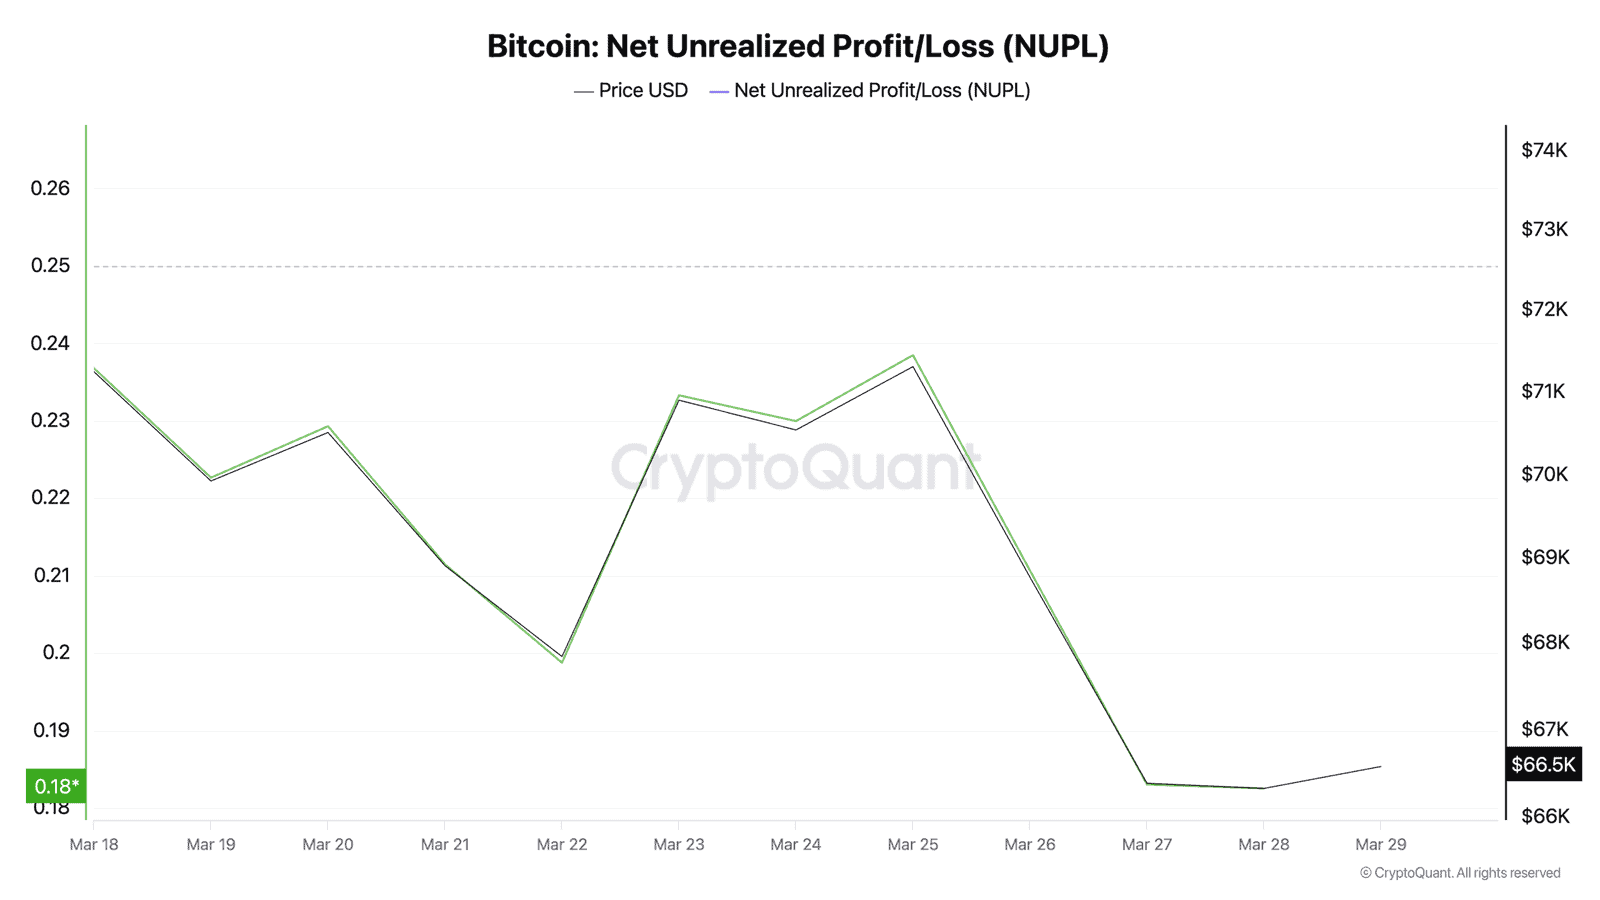
NUPL (Net Unrealized Profit/Loss) dropped to 0.183 by Friday. That’s the “Hope/Fear” zone on CryptoQuant’s dashboard, one step above outright capitulation. For context, it sat at 0.233 on Monday.
And yet. Exchange reserves fell from 2,708,367 BTC on March 23 to 2,704,103 BTC by March 29. Someone pulled 4,264 BTC off exchanges during a week when everybody was supposedly running for the exits. The netflow data tells a messier story – massive outflows early in the week (-7,810 BTC on March 23, -4,954 BTC on March 25) got partially offset by inflows mid-week (+1,693 BTC on March 26, +885 BTC on March 28). But net-net, more Bitcoin left exchanges than entered them.
Who’s accumulating while long-term holders puke their bags? We’ll get to that.
ETF Bloodbath – With One Stunning Exception
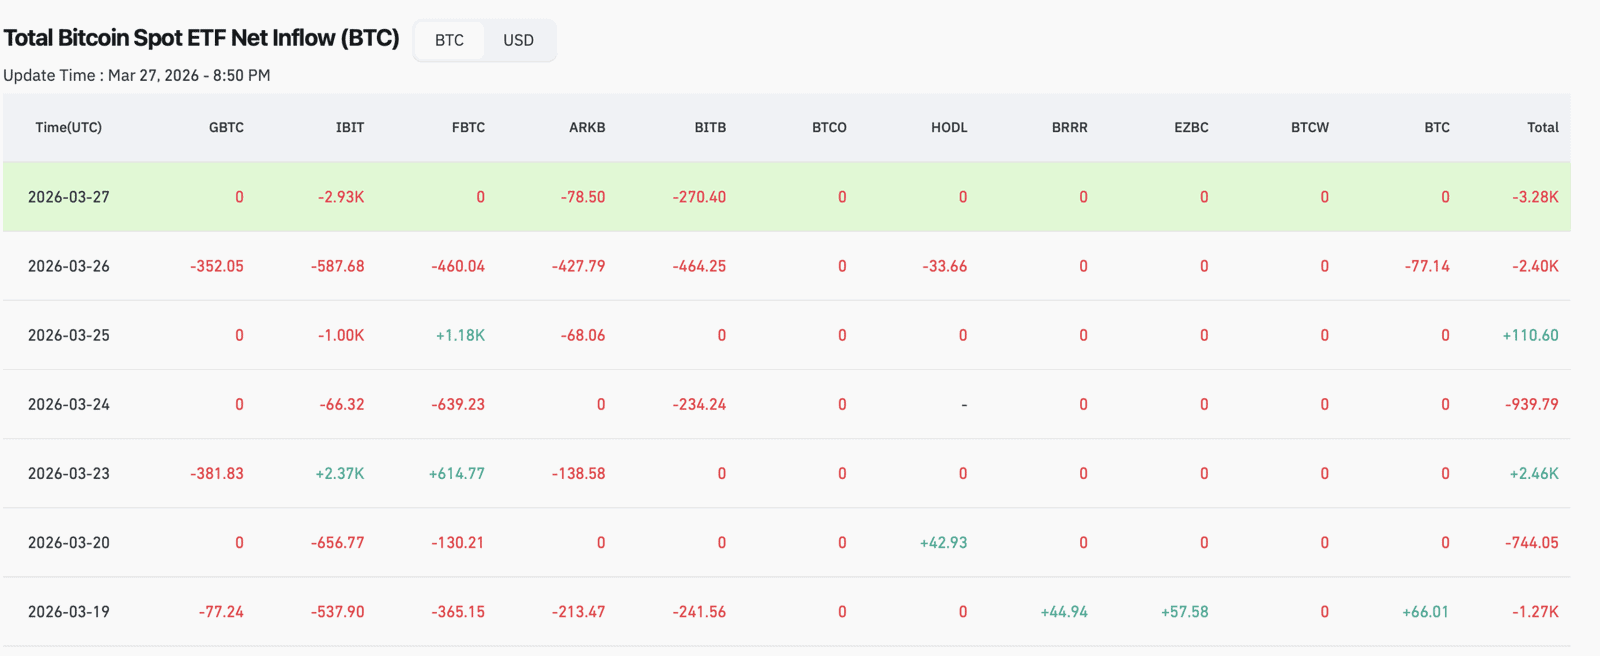
Spot Bitcoin ETFs hemorrhaged roughly $296 million in net outflows for the week. The worst single day was March 27, when $225.5 million walked out the door. BlackRock’s IBIT, usually the last fund standing during selloffs, accounted for $201.5 million of that March 27 exodus. Fidelity’s FBTC lost $45.3 million on March 24 alone.
ETF holdings data from CryptoQuant tells the same story: total Bitcoin held across spot ETFs slipped from approximately 1,324,711 BTC to 1,318,737 BTC over the week. That’s nearly 6,000 BTC in net selling – about $399 million at current prices.
But here’s the plot twist. BlackRock launched its staked Ethereum ETF (ETHB) this week and it absolutely smoked expectations. $155 million on day one – 40% bigger than IBIT’s own debut. $254 million in AUM by the end of its first week. That happened while traditional Ethereum ETFs were bleeding $92.5 million over a 7-day losing streak.
The message? Institutions aren’t fleeing crypto. They’re rotating. Plain vanilla BTC and ETH exposure is getting dumped. Yield-bearing, staked ETH products are attracting fresh capital. Different product, different buyer, same asset class.
Ethereum’s Identity Crisis Deepens
ETH couldn’t catch a break. At $1,989, it’s clinging to the psychologically critical $2,000 level like a rock climber with sweaty palms. The ETH/BTC ratio crashed to 0.030 – a five-year low. Ethereum’s share of total crypto market cap shrank to 10.13%, down from roughly 18% a year ago.
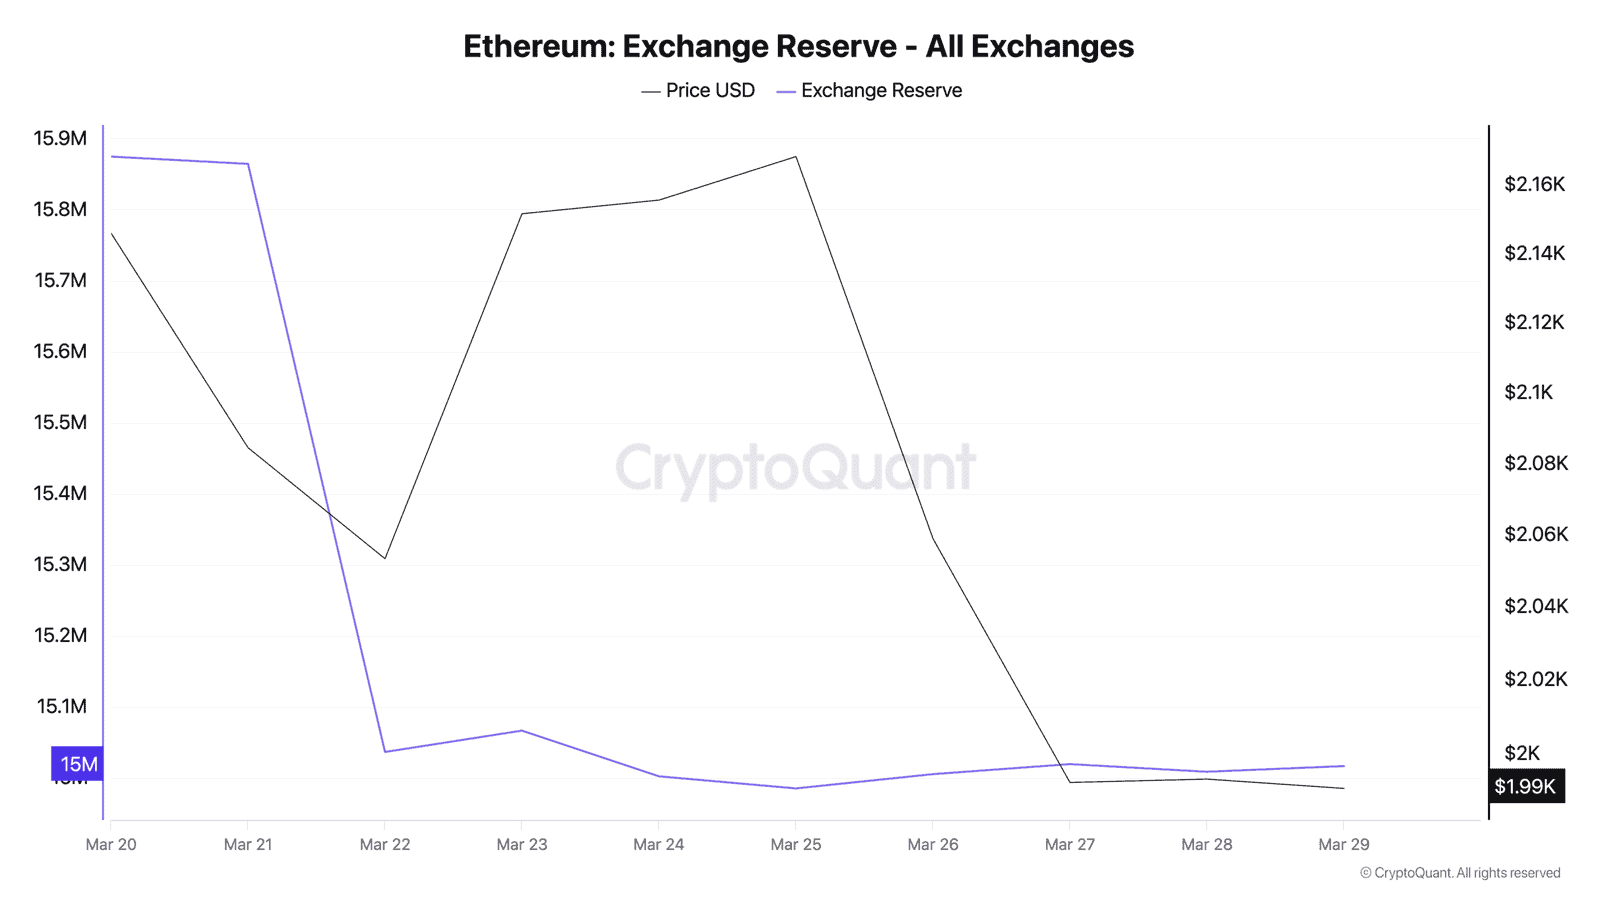
On-chain, though, the picture is more nuanced. Exchange reserves dropped by 57,876 ETH over the week (15,066,899 to 15,009,023). That’s a significant supply squeeze happening beneath the surface. With 25.3 million ETH locked in DeFi protocols (an all-time high from earlier this month) and fresh staking demand from ETHB, circulating supply on exchanges keeps shrinking.
The leverage ratio on Ethereum derivatives jumped from 0.877 to 0.960 – a 9.5% increase in one week. Traders are getting more aggressive with borrowed money even as the spot price bleeds. That’s either conviction or recklessness. Probably both.
The Stablecoin Signal Nobody’s Talking About
Here’s what caught our attention most. Bitcoin’s Stablecoin Supply Ratio (SSR) dropped from 10.32 on March 23 to 9.73 by March 28. SSR measures Bitcoin’s market cap relative to total stablecoin supply. When it falls, it means there’s proportionally more stablecoin “dry powder” available to buy Bitcoin.
Think of it like this: the ammunition is piling up on the sidelines while the battlefield empties out. USDT’s market cap sits at $184 billion. USDC at $77.7 billion. Combined stablecoin supply dwarfs anything we saw during previous bottoms.
The Puell Multiple, which tracks miner revenue relative to its 365-day moving average, bounced between 0.62 and 0.81 all week. Anything below 0.5 has historically marked generational buying opportunities. We’re not there, but miners are clearly under stress – our analysis from March 28 showed miners losing $19K per coin produced.
Winners and Losers
Not everything bled this week. A few names stood out:
TRON (TRX): +2.0% – The quiet outperformer. TRON keeps eating stablecoin market share as USDT transfers on its network exceed Ethereum’s daily volume. At $0.319, it’s the only top-10 non-stablecoin asset that ended the week green.
Hyperliquid (HYPE): +2.1% – This token rallied 40% in March by profiting from everyone else’s losses. Its perpetual DEX captured 73% market share with $208 billion in 30-day volume. We covered the HYPE story in detail earlier this week.
Bitcoin Cash (BCH): +2.7% – Riding the narrative of Bitcoin alternatives as BTC transaction fees remain elevated.
Canton (CC): +6.0% – The tokenized finance play from Digital Asset, gaining traction as the CLARITY Act advanced through Congress.
On the losing side: Cardano (ADA) -5.7%, Solana (SOL) -5.9%, XRP -5.0%, and Monero (XMR) -6.9% all took heavier hits than the market average.
Macro: Congress Moves on RWA, ECB Fires at DeFi Governance
Two regulatory developments reshaped the landscape this week.
Congress voted on the CLARITY Act, legislation aimed at regulating the $26.48 billion tokenized real-world asset market. The bill includes a deal on stablecoin yield treatment that could unlock institutional capital flows into tokenized treasuries and real estate. We broke down the implications here.
Meanwhile, the European Central Bank published a working paper on March 26 revealing that fewer than 20 wallets control governance of Aave, Uniswap, and MakerDAO. The top 100 holders own 80%+ of governance tokens. If regulators use this data to argue DeFi isn’t truly decentralized, MiCA exemptions could evaporate.
DeFi: The Cockroach That Won’t Die
Despite everything – the fear, the capitulation, the ETF outflows – DeFi TVL held at roughly $97.6 billion. Aave alone accounts for $26.46 billion and recently crossed $1 trillion in cumulative loans. Liquidation risk dropped 84% year-over-year to just $53 million in at-risk positions.
That’s the structural story nobody wants to hear during a fear cycle. The infrastructure is more resilient than it’s ever been. Smart contracts don’t panic sell.
What to Watch Next Week
Three things matter now:
1. MVRV trajectory. If MVRV drops below 1.0, it means the average Bitcoin holder is underwater. That’s historically been a generational buy signal – but also the moment that maximum pain hits. We’re at 1.22 and falling.
2. Stablecoin inflows. SSR at 9.73 and declining means dry powder is building. Watch for a sudden SSR spike – that would indicate stablecoins are converting to BTC and could signal a bottom.
3. ETF flow reversal. The week ended with nearly $300M in outflows. If Monday brings positive flows, it could signal the panic selling was a one-week washout rather than a trend.
The market’s telling two stories simultaneously. The sentiment story screams capitulation. The on-chain story whispers accumulation. One of them is lying. If history rhymes, it’s usually the loud one.
This is not financial advice. DYOR. Data as of March 29, 2026.
Sources
- CoinGecko API – prices, market caps, 7d changes
- CryptoQuant – MVRV, SOPR, NUPL, exchange reserves, netflows, SSR, Puell Multiple, ETF holdings
- CoinGlass – Bitcoin ETF flow data
Leave a Reply