🕑 6 min read
Most traders obsess over Bitcoin’s price. The smartest ones watch what everyone paid for it.
The MVRV ratio, a metric that divides Bitcoin’s market value by its realized value, doesn’t care about today’s candle or tomorrow’s Fed meeting. It tracks something far more telling: whether the average Bitcoin holder is sitting on profit or drowning in losses – and every single time it dropped below 1.0, what followed was a massive rally that made the previous crash look like a rounding error.
At 1.31 as of April 8, 2026, the ratio sits in a zone that’s neither cheap nor euphoric. But to understand what that number means, you need to understand the two market caps behind it.
Two market caps, one ratio – and why the second one matters more
Bitcoin’s market capitalization takes the current price – $71,892 as of April 9 – and multiplies it by every coin in circulation. That gives you $1.44 trillion. Clean number. Also misleading, because it assumes every Bitcoin is worth the same.
The second measure is called realized capitalization. Instead of pricing every coin at today’s value, realized cap prices each coin at the price it last moved on-chain. A Bitcoin someone bought at $16,000 during the FTX crash and hasn’t touched since? Realized cap counts it at $16,000 – not $71,892.
That distinction changes everything.
MVRV divides the first by the second. Above 1.0, the average holder is in profit. Below 1.0, they’re underwater. “MVRV is basically the P/E ratio of Bitcoin,” said Willy Woo, on-chain analyst and creator of the Woobull charts. “It tells you whether the market is trading above or below its aggregate cost basis.”
The housing market analogy makes this click: market cap is the sticker price on every house in a neighborhood – the number a real estate agent would quote you if you asked what the entire block is worth – while realized cap is what people actually paid when they signed their mortgages and handed over the check. When sticker prices collapse below purchase prices, nobody sells. They’d be locking in losses. Selling pressure evaporates.
That’s capitulation. And that’s exactly what MVRV below 1.0 has signaled three times in the past decade.
Every Bitcoin bottom left the same MVRV fingerprint
The pattern is almost too clean.
January 2015. MVRV dropped to 0.55 after the Mt. Gox collapse gutted the market. Bitcoin traded near $200, and the average holder was underwater by 45%. Nobody wanted to talk about crypto.
Within three years, BTC hit $20,000. A 10,000% move.
December 2018 brought a repeat. MVRV fell to 0.69 as Bitcoin collapsed from $20K to $3,200. Crypto Twitter declared the asset dead – again. But those who understood what an MVRV below 1.0 actually meant – that sellers were exhausted, that every remaining holder was already sitting on losses with nothing left to dump – they started buying. BTC reached $14,000 by June 2019.
Then came November 2022. FTX imploded, contagion spread from trading desks in Singapore to lending platforms in the Bahamas to retail brokerage accounts across Middle America, and MVRV slid to 0.80 as Bitcoin collapsed to $16,000 in what felt like the death rattle of an entire industry. Sixteen months later, BTC traded above $73,000 – a 356% rally from that exact bottom.
Three crashes. Three times MVRV dipped below 1.0. Three massive rallies followed.
We’ve tracked this across three full cycles, and the mechanism hasn’t changed: when MVRV drops below 1.0, the entire market is holding coins worth less than what they paid. Who sells at a loss if they don’t have to? And when the selling stops, even modest buying pressure moves the price fast.
But MVRV isn’t only a bottom detector. It flagged every overheated market too.
In December 2017, the ratio touched 4.0 right before Bitcoin crashed 84%. In November 2021, it peaked near 2.7 before the long slide to $16K. And at Bitcoin’s most recent all-time high of $126,080 in October 2025, MVRV hit 2.29.
That declining peak – 4.0, then 2.7, then 2.29 – tells its own story. The manias are getting shorter. The market is growing up. Or maybe the easy money just isn’t as easy anymore.
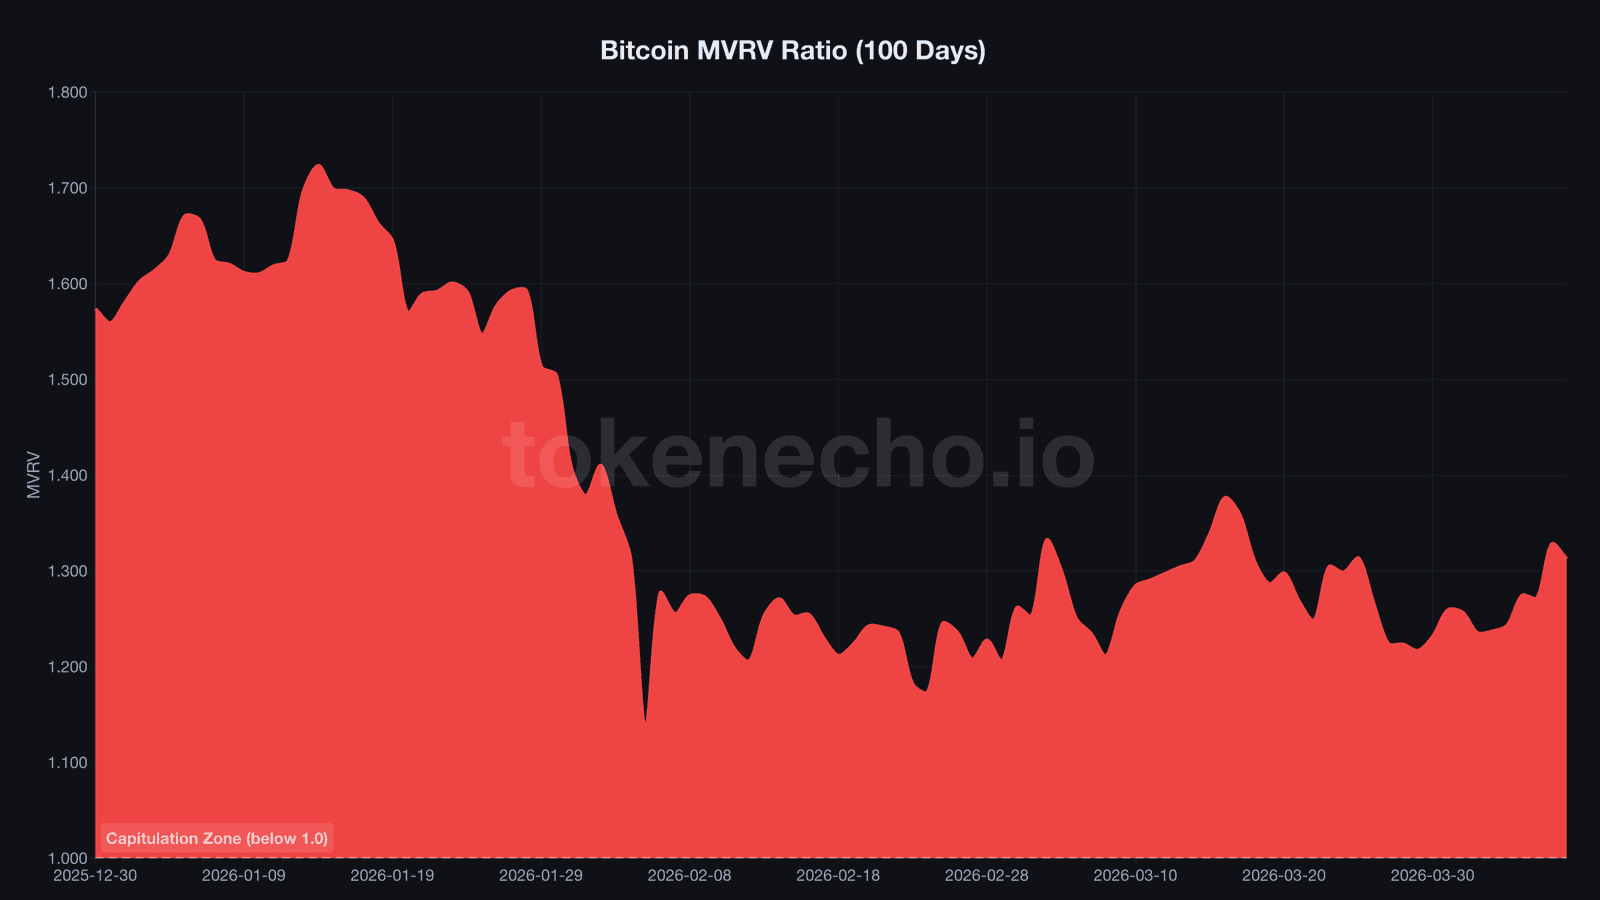
MVRV reads 1.31 in April 2026 – not cheap, not euphoric
So where does that leave us?
The average holder is sitting on roughly 31% unrealized profit. Not drowning, but hardly celebrating either – especially anyone who bought above $94,000 during Q4 2025.
MVRV was 2.29 at Bitcoin’s $126,080 ATH just six months ago. It’s since dropped 43% – mirroring Bitcoin’s own drawdown from that peak. The ratio bottomed around 1.14 in early March, when BTC briefly touched $65,000. That’s the lowest reading since summer 2023.
What stood out to us: the market shed half its unrealized profits in five months without triggering a full capitulation event. MVRV never broke below 1.0. Either the bottom is still ahead – or this cycle’s floor is simply higher than anyone expected.
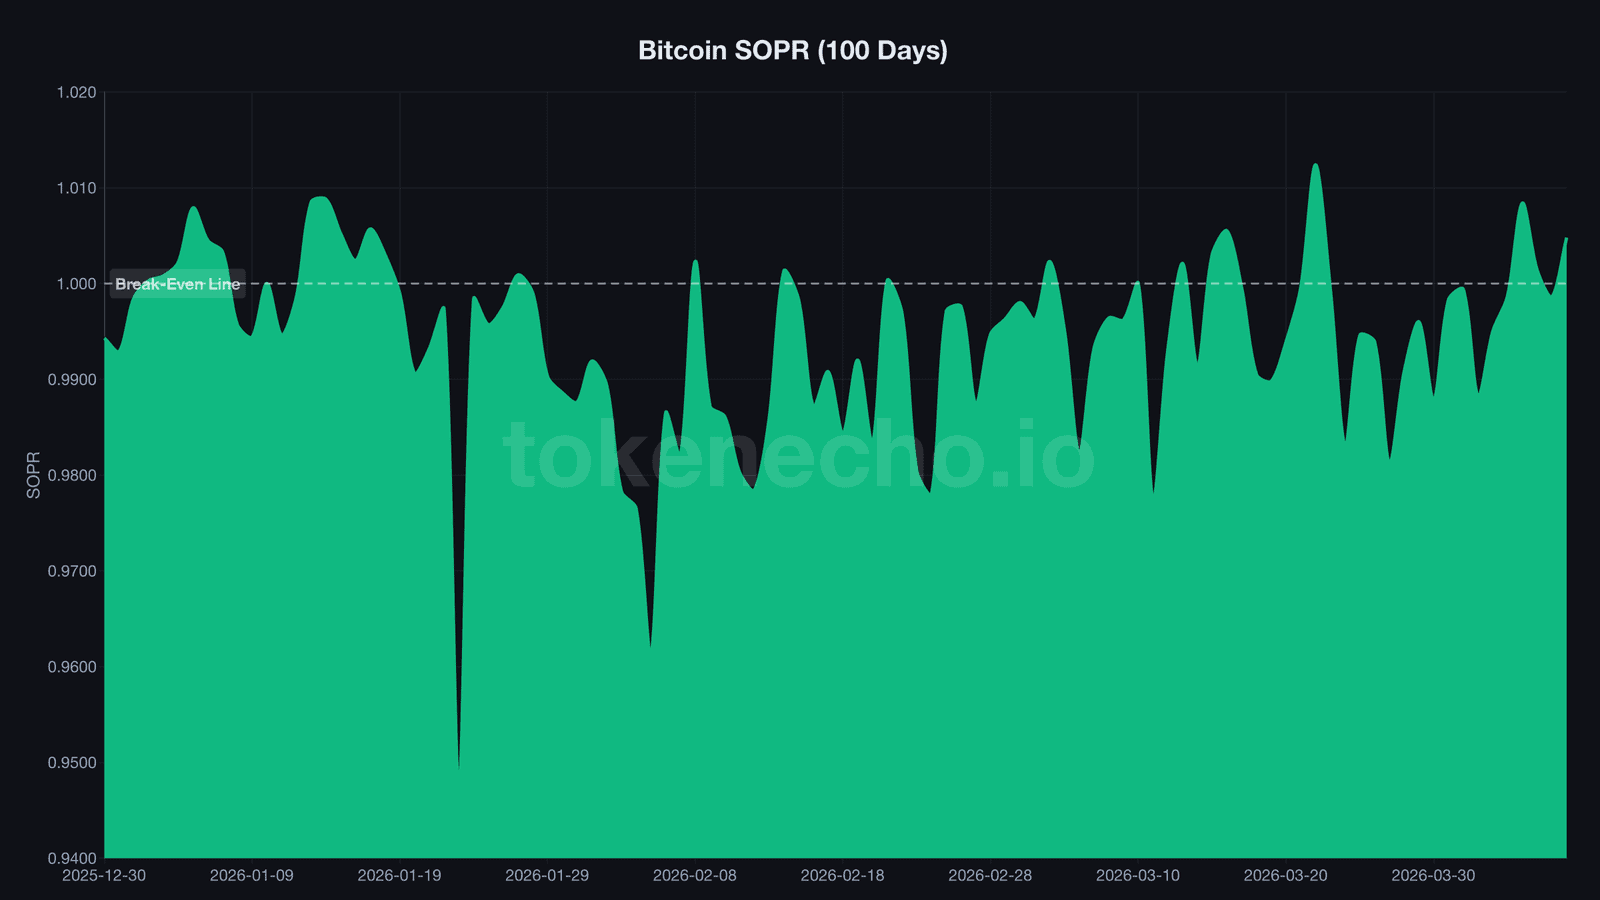
Supporting signals lean toward the second interpretation. SOPR, the ratio that tracks whether sellers are taking profits or losses, hovers at 1.005 after spending most of late March below 1.0. Barely positive. The bleeding may have stopped.
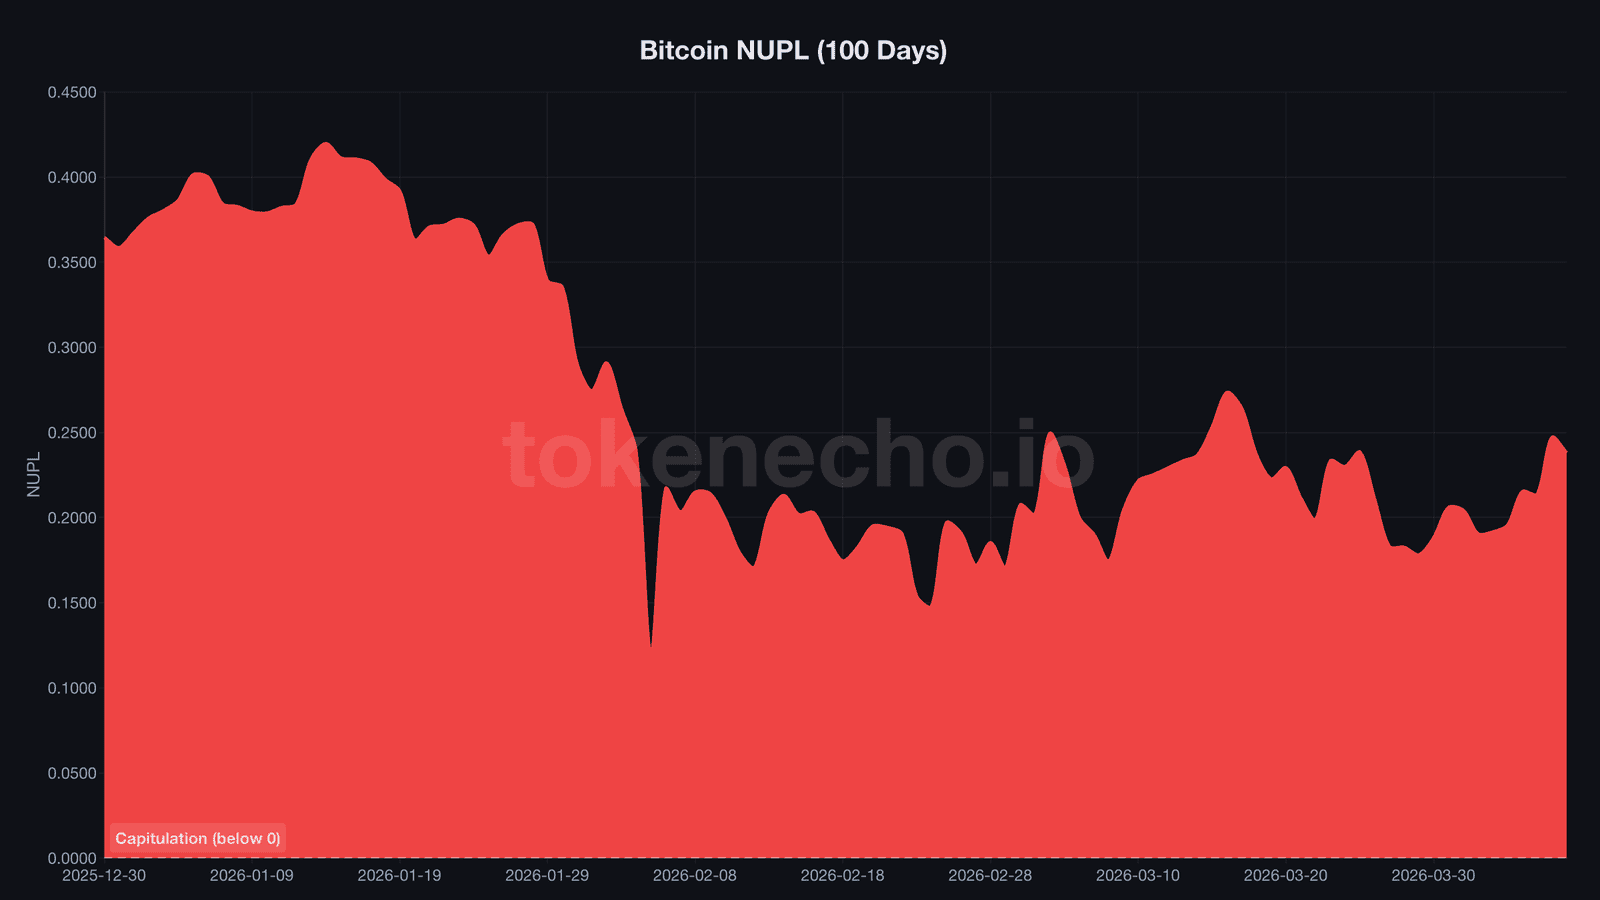
NUPL, another gauge of aggregate unrealized profit, sits at 0.238 – the “hope/fear” boundary where markets tend to either bounce or break down entirely.
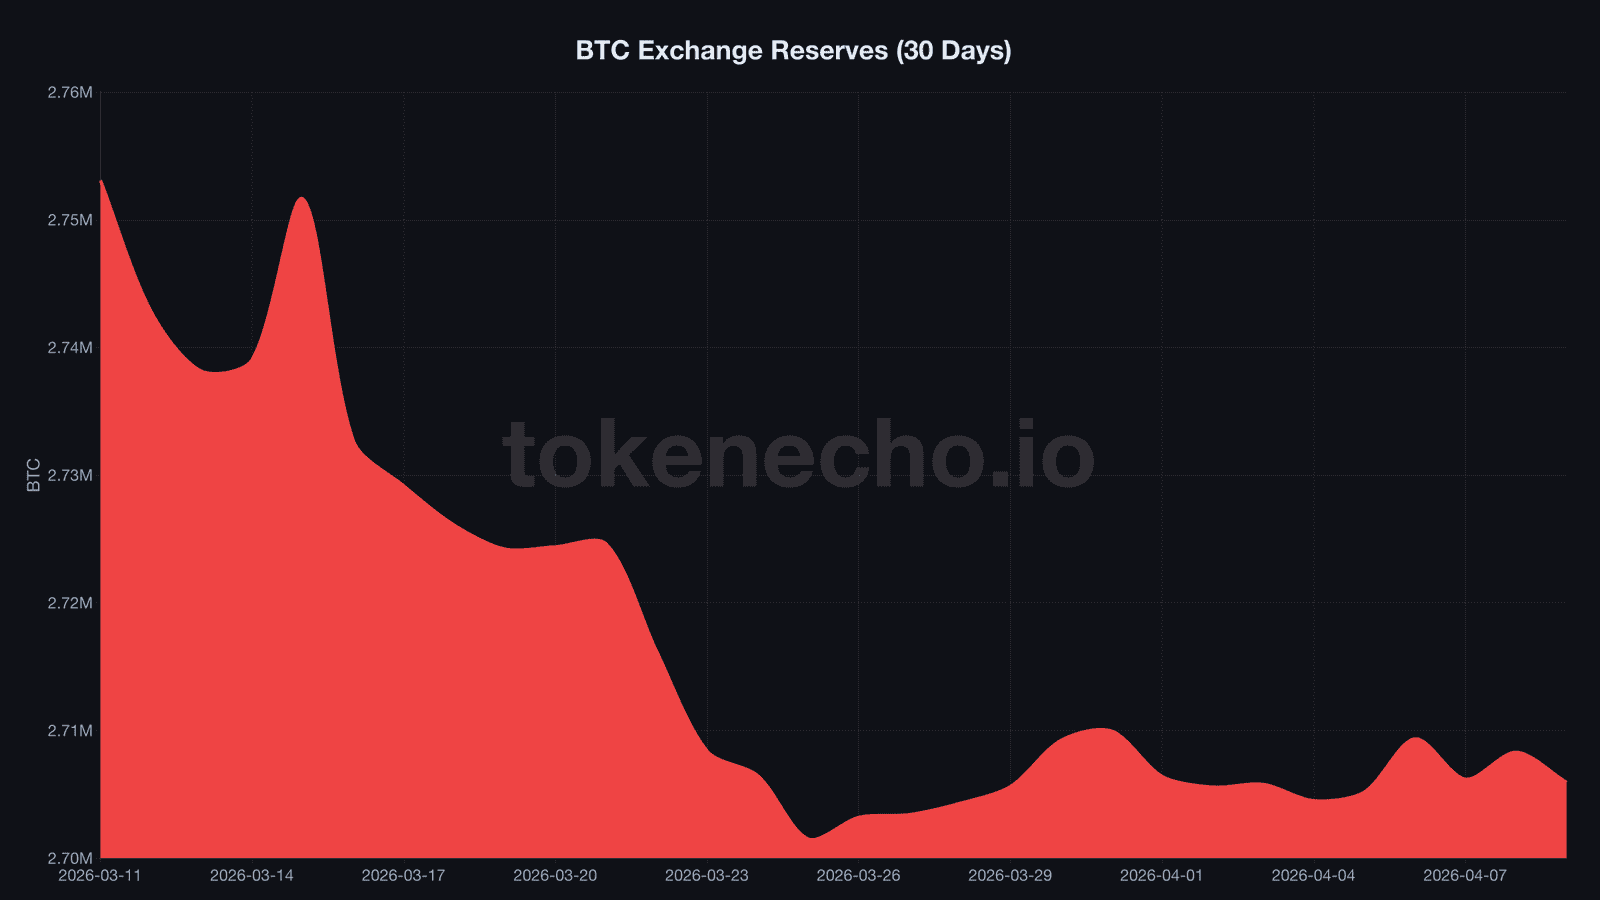
And exchange reserves have dropped by 47,154 BTC over the past 30 days to 2.71 million coins. Coins leaving exchanges for cold storage isn’t something you see right before a panic sell-off.
If MVRV breaks below 1.0 while exchange outflows continue at this pace, the setup would rhyme with 2015, 2018, and 2022 – and the capitulation parallels we flagged in late March would shift from “interesting” to “actionable.” Until that happens, the ratio suggests a market that’s been thoroughly humbled but hasn’t fully broken.
Track it yourself – three free dashboards
You don’t need a Bloomberg terminal for this.
CryptoQuant (cryptoquant.com) offers the most granular MVRV data, with daily readings and up to 100 days of free history. The pro plan unlocks multi-year charts and custom alerts that ping you when MVRV crosses key thresholds.
Glassnode Studio (studio.glassnode.com) bundles MVRV alongside dozens of other on-chain indicators. The free tier is limited, but their Academic plan – $29/month – gives you 26 months of data, enough to see a full cycle play out.
LookIntoBitcoin (lookintobitcoin.com) is the simplest option: a dedicated MVRV chart with cycle annotations baked in, no account needed. It’s become the quick-reference dashboard that even institutional desks keep bookmarked.
For the full breakdown of six on-chain metrics – MVRV, SOPR, NUPL, the Puell Multiple, exchange reserves, and netflow – read our beginner’s guide to reading on-chain data.
MVRV has called three bottoms and three tops over the past decade. At 1.31, it’s sitting in the middle – which, depending on your time horizon, is either a warning or an invitation. The market hasn’t capitulated, but the euphoria is long gone.
This is not financial advice. DYOR. Data as of April 9, 2026.
Sources:
- CryptoQuant – Bitcoin MVRV Ratio (daily readings)
- CoinGecko – Bitcoin Market Data
- Nic Carter & Antoine Le Calvez, “Bitcoin As Money” – realized cap methodology (2018)
Leave a Reply