🕑 7 min read
Two point nine million wallets used Solana yesterday. Not last month. Not last quarter. Yesterday.
That makes Solana the most actively used blockchain in crypto right now – and it’s not particularly close. So when you look at the price chart and see a token down 69% from its $293 high, the natural question isn’t “what went wrong with Solana?” It’s “what is the market not seeing?”
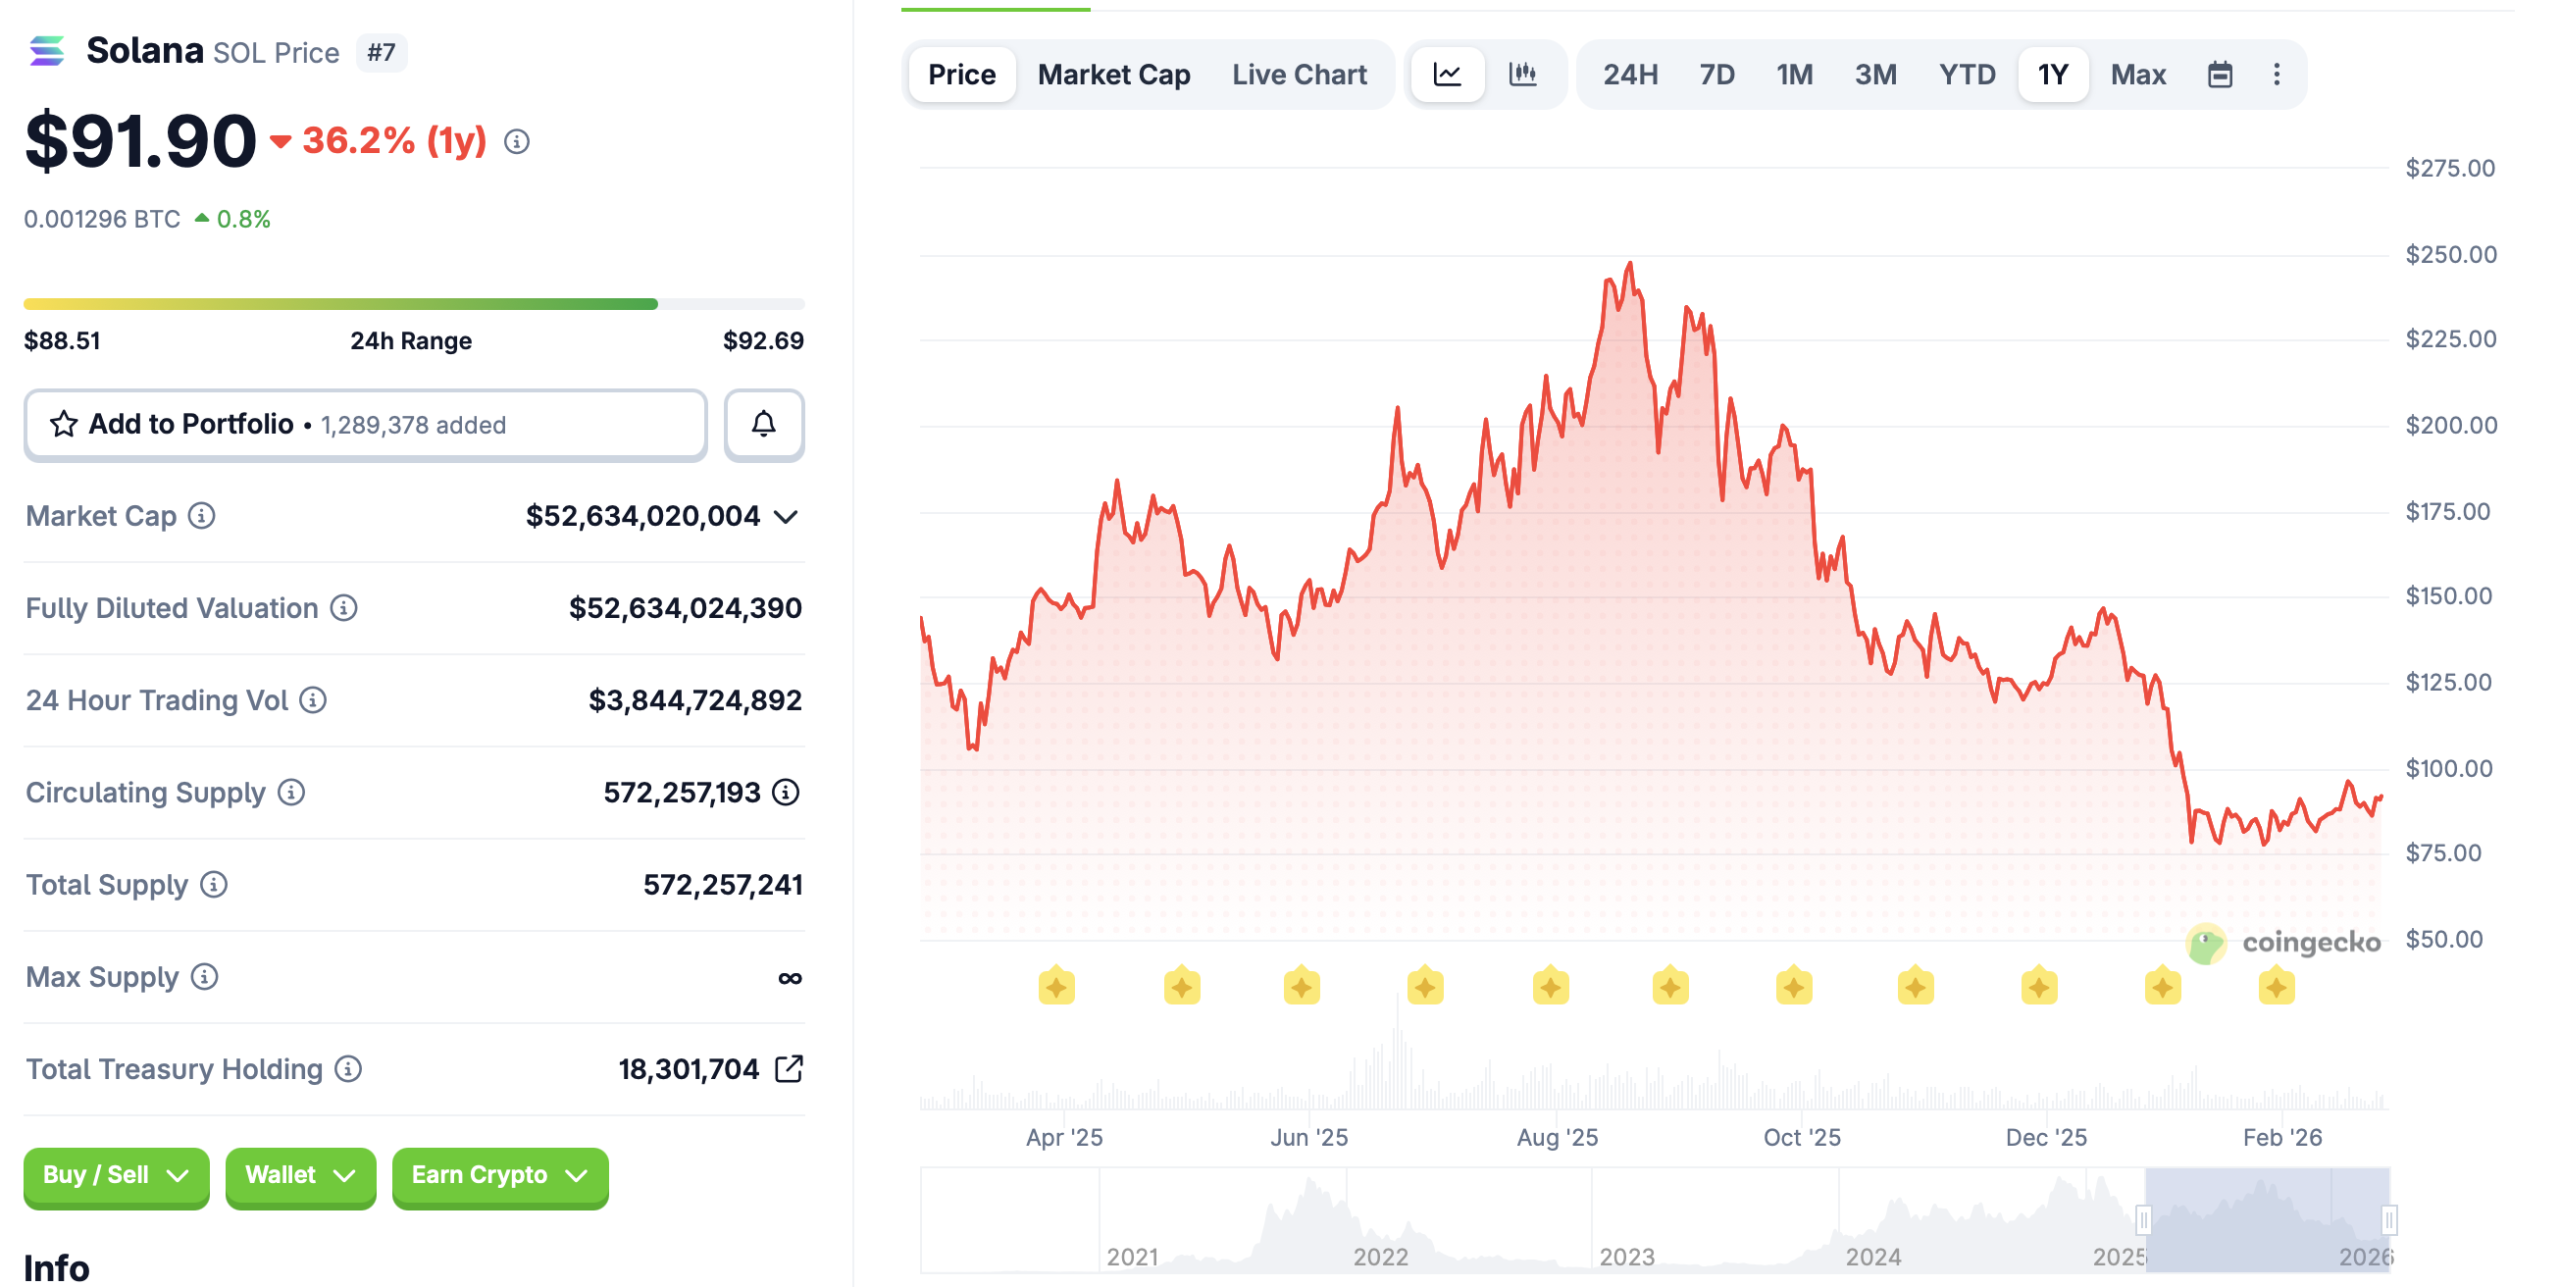
SOL sits at $92 as of March 25, 2026. The market cap is $52.8 billion – roughly one-fifth of Ethereum’s. And yet, on multiple on-chain metrics that actually matter – DEX volume, transaction count, daily active users – Solana is either matching or outpacing the network that’s worth five times more.
We’ve spent the past week digging into the data, and the disconnect is wider than we expected.
The Usage Numbers That Don’t Match the Price
Solana crossed $95 billion in total DEX volume in February 2026 – first place across all chains. Jupiter alone processes over $700 million in daily swap volume, which would make it one of the busiest exchanges in crypto if it were centralized. And it’s just one app on the network.
The SOL-denominated TVL hit an all-time high of 80 million SOL recently – which is the metric that actually matters when evaluating network conviction. Dollar-denominated TVL fluctuates with price. SOL-denominated TVL tells you how many people are locking their tokens into protocols instead of selling them. That number keeps climbing even while the price bleeds.
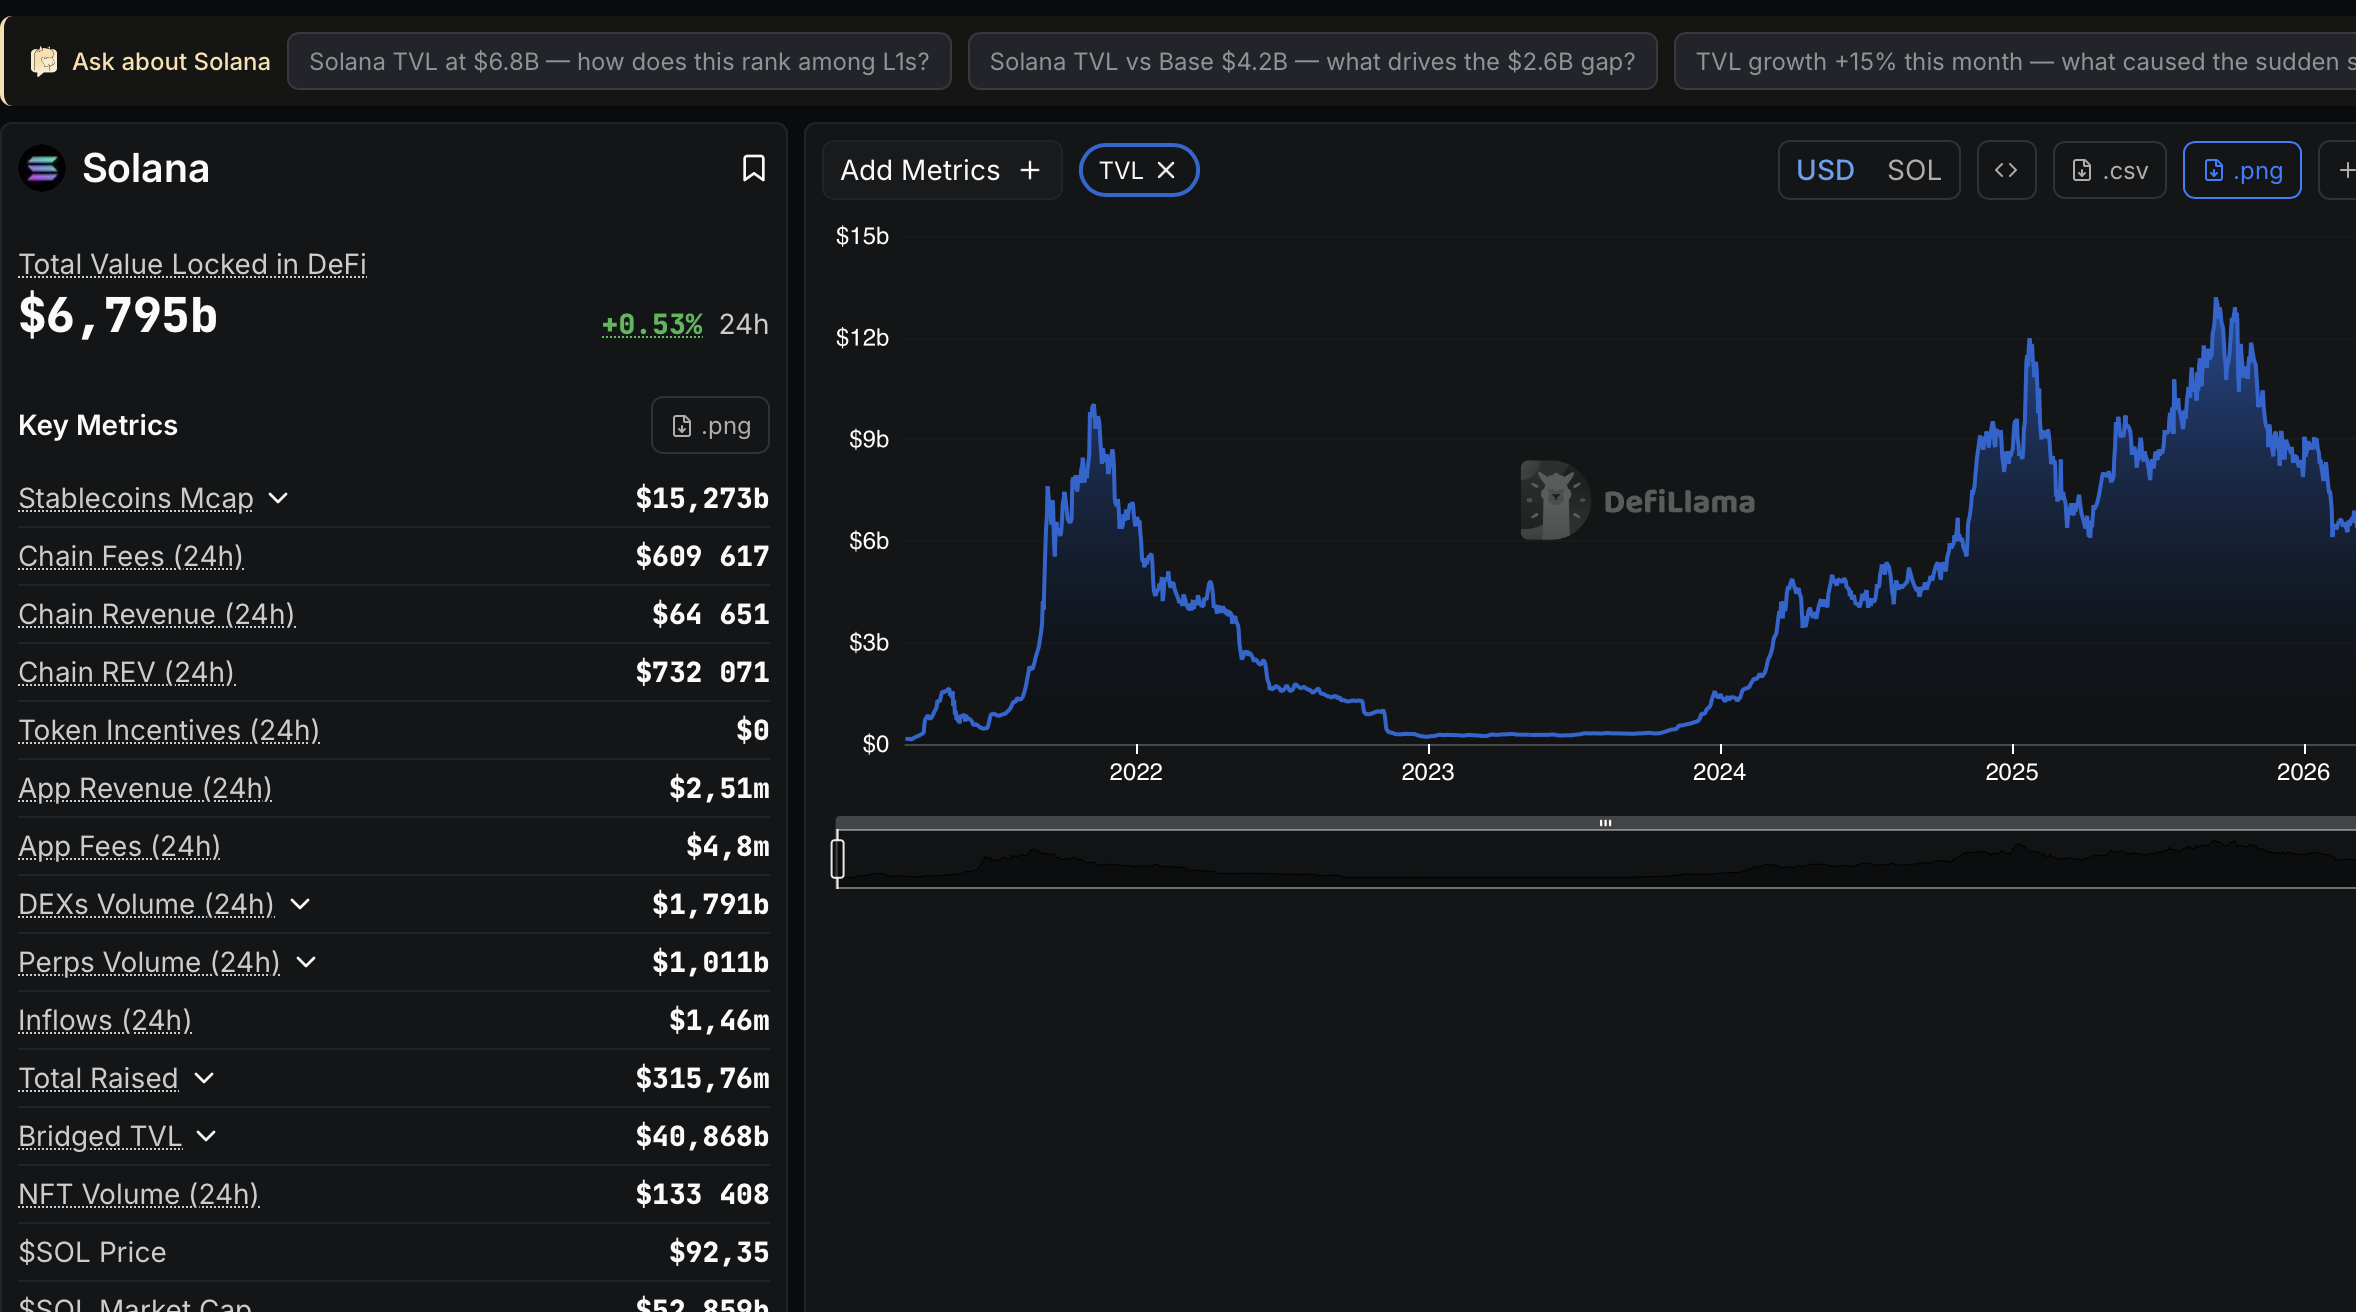
Transaction count reached 3.4 billion in February (excluding vote transactions, which is the honest way to count). The developer community sits at roughly 17,700 active contributors, according to Electric Capital data – third behind Ethereum and Bitcoin, but growing faster than both.
And then there’s Firedancer. Jump Crypto’s independent validator client went fully operational this cycle, and the result is a network that reliably sustains over a million transactions per second. A million. The Alpenglow upgrade – approved by validators last September – is pushing block finality from 12 seconds down to 100-150 milliseconds. Combined with the P-token standard, compute costs drop by up to 98%.
Those aren’t roadmap numbers. The infrastructure is live. And the price is acting like none of it happened.
March 17 Changed the Game for SOL
When the SEC and CFTC jointly classified 16 crypto assets as digital commodities on March 17, Solana made the list alongside Bitcoin and Ethereum. That single ruling removed the regulatory cloud that had hung over SOL since the FTX collapse in 2022 – when Alameda Research’s massive SOL holdings created a legitimate question about whether the token would ever shake its association with Sam Bankman-Fried’s empire.
It shook it. Legally, permanently.
The practical impact landed within days. VanEck’s VSOL and Bitwise’s BSOL – staking ETFs that were live but legally uncertain – now operate on clear regulatory ground. T. Rowe Price, managing $1.8 trillion in assets, added SOL exposure almost immediately after the ruling. And Morgan Stanley – a $1.8 trillion bank – chose SOL over Ethereum for its institutional crypto strategy, a decision we covered in detail when it broke.
Over 90 crypto ETF applications were pending with the SEC as of late 2025. With commodity status confirmed, the pipeline for SOL-based products just went from “maybe someday” to “file the paperwork.”
Three Ways SOL Gets to $300 Again (And One Way It Doesn’t)
The institutional adoption path. This is the scenario where everything that’s supposed to happen actually happens. Staking ETFs attract steady inflows. Institutions that added SOL exposure in March increase their allocations through 2026. Firedancer’s performance makes Solana the default chain for high-frequency DeFi applications. Under this scenario, SOL reclaims $150-$200 by late 2026 as the price catches up to usage metrics. In 2027, with ETF products mature and Alpenglow reducing costs further, $250-$350 becomes the range. The 2028 Bitcoin halving lifts the entire market, and SOL – with the strongest usage story – could push toward $400-$600. By 2030, if Solana captures a meaningful share of institutional settlement activity, VanEck’s $3,211 target starts looking less crazy than it did when they published it.
The grind-higher path. Macro stays difficult. The Fed doesn’t cut. Iran keeps simmering. But Solana’s usage metrics are so strong that they create a slow, steady bid. SOL grinds from $92 to $120-$150 through the rest of 2026 – nothing explosive, just steady accumulation by funds that can read on-chain data. By 2027, $150-$250. The 2028 halving provides a boost to $200-$350. And by 2030, somewhere between $300 and $500. Not as dramatic as the bull case, but still a 3-5x from current levels.
The Ethereum fights back path. Ethereum’s community isn’t going to roll over. If Ethereum’s Fusaka and Glamsterdam upgrades dramatically improve L1 throughput, and if the “fat protocol” thesis reasserts itself with L2 revenue flowing back to ETH, Solana’s competitive advantage narrows. SOL in this scenario stays rangebound at $80-$130 through 2026, slowly climbs to $120-$200 by 2027-2028, and reaches $150-$300 by 2030. Respectable returns, but not the moonshot the community is pricing in.
The risk nobody talks about: inflation. Solana’s total supply is 572 million tokens and there’s no hard cap. Staking rewards create new SOL continuously. Unlike ETH, which became deflationary post-merge, SOL is inflationary – and that inflation dilutes holders over time. If network revenue doesn’t grow fast enough to offset issuance, the tokenomics work against you. This is the structural bear case that usage metrics alone can’t fix.
Our editorial view: somewhere between the institutional adoption and grind-higher paths. The usage data is too strong to ignore, and the SEC ruling removed the biggest overhang. But $92 to $300 is a 3.3x move, and that requires both macro cooperation and continued execution. We think $120-$200 for the rest of 2026 is realistic, with meaningful upside if rate cuts materialize.
The Chart Levels We’re Watching
$80 is the line in the sand. SOL has bounced off this level multiple times in 2026, and it represents the cost basis for a large cohort of institutional buyers who entered after the SEC ruling. Losing $80 would trigger a wave of stops and potentially send SOL back to $60-$65.
$100 is the psychological hurdle that keeps rejecting rallies. We need a decisive daily close above $100 with conviction – not another weekend pump that fades by Tuesday.
$140 is where the real breakout lives. That’s the level where SOL was trading before the Iran crisis cratered everything in mid-March. Reclaiming it would confirm the correction is over and open the door to $200+.
$293 is the all-time high from January 2025. It feels far away at $92, but remember – SOL went from $8 to $260 in 2023-2024. This token has a history of violent moves when the narrative aligns with on-chain reality.
The Questions Everyone’s Asking
Could SOL flip Ethereum? In market cap, probably not anytime soon – ETH is worth $262 billion versus SOL’s $52.8 billion. But in usage metrics, Solana is already competitive or ahead. The “flippening” everyone obsesses over might not happen in price. It might happen in activity – and arguably, it already has.
What happened to all the FTX-related SOL? Alameda’s locked tokens have been gradually unlocking and selling throughout 2025-2026. Most of that supply has been absorbed. The remaining unlock schedule is public and priced in. If anything, the fact that SOL survived billions in forced selling and still maintained $80+ support is a testament to the organic demand underneath.
Why did Morgan Stanley choose SOL over ETH? Speed, cost, and institutional product-market fit. When you’re building infrastructure for high-frequency settlement, a chain that does a million TPS at near-zero cost beats one that charges $5 per transaction and confirms in 12 seconds. The Morgan Stanley decision isn’t about “believing in Solana.” It’s about engineering requirements.
Reference: Price Ranges by Year
| Year | Conservative | Mid-Range | Aggressive |
|---|---|---|---|
| 2026 | $70-$100 | $120-$200 | $200-$300 |
| 2027 | $90-$150 | $150-$250 | $250-$400 |
| 2028 | $120-$200 | $200-$350 | $400-$600 |
| 2029 | $150-$250 | $250-$450 | $500-$800 |
| 2030 | $130-$300 | $300-$500 | $600-$1,000+ |
What Could Go Wrong
Solana’s biggest vulnerability isn’t technical anymore – Firedancer fixed the network outage problem that plagued 2022-2023. The risk now is tokenomic: inflationary supply with no hard cap means SOL needs perpetual growth in network revenue just to maintain value. If DeFi activity plateaus or migrates to another chain, inflation becomes a headwind rather than a rounding error. There’s also concentration risk in the validator set and the network’s heavy dependence on Jump Crypto’s infrastructure investment. And frankly, the memecoin-driven transaction volume that inflates Solana’s activity numbers isn’t the same quality of usage as Ethereum’s institutional DeFi flows. Not all transactions are created equal.
This is not financial advice. DYOR. Price predictions are based on historical data, on-chain metrics, and analyst forecasts. Actual results may vary significantly. Data as of March 25, 2026.
Leave a Reply