
🕑 5 min read
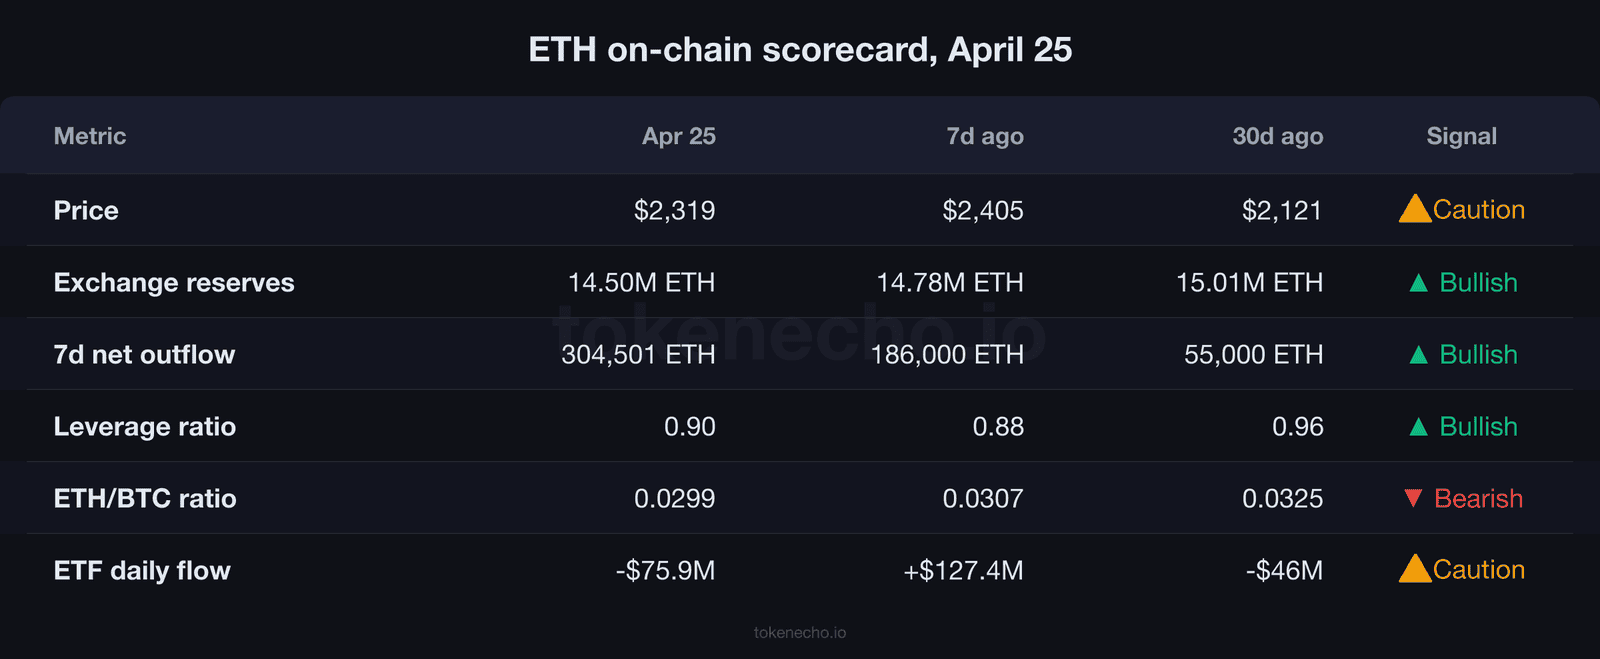
Ethereum dropped below the 0.03 level against Bitcoin on April 23 for the first time since late February, even as exchange reserves fell to a new monthly low of 14,503,064 ETH after another 134,512 ETH left trading platforms over the past four days, according to CryptoQuant data.
The token traded at $2,319 on Friday, down 3.77% over the past seven days.
Ethereum holds a 9.36% gain for the rolling 30-day period, putting it among the stronger-performing large-cap assets in April. At a market capitalization of $279.9 billion, the token remains 53.1% below its all-time high of $4,946 from August 2025.
Key takeaways
- Exchange reserves dropped to 14,503,064 ETH, lowest in over 30 days. More than 60% of the monthly outflow of 502,594 ETH happened in the last seven days alone, according to CryptoQuant.
- The estimated leverage ratio crashed to 0.84 on April 20, its 30-day low, before bouncing to 0.90, the cleanest derivatives positioning since late March.
- ETH/BTC slipped below 0.03 on April 23 for the first time since late February. The mid-April bounce to 0.031 has already reversed.
Exchange reserves hit new monthly low at 14.5 million ETH
The pace of the exchange drain has accelerated sharply over the past week. All-exchange reserves fell from 15,005,658 ETH on March 26 to 14,503,064 on April 24, CryptoQuant data shows.
That net decline of 502,594 ETH is worth approximately $1.17 billion at current prices. The 7-day portion alone accounts for 304,501 ETH ($706 million), representing 63% of the entire monthly outflow.
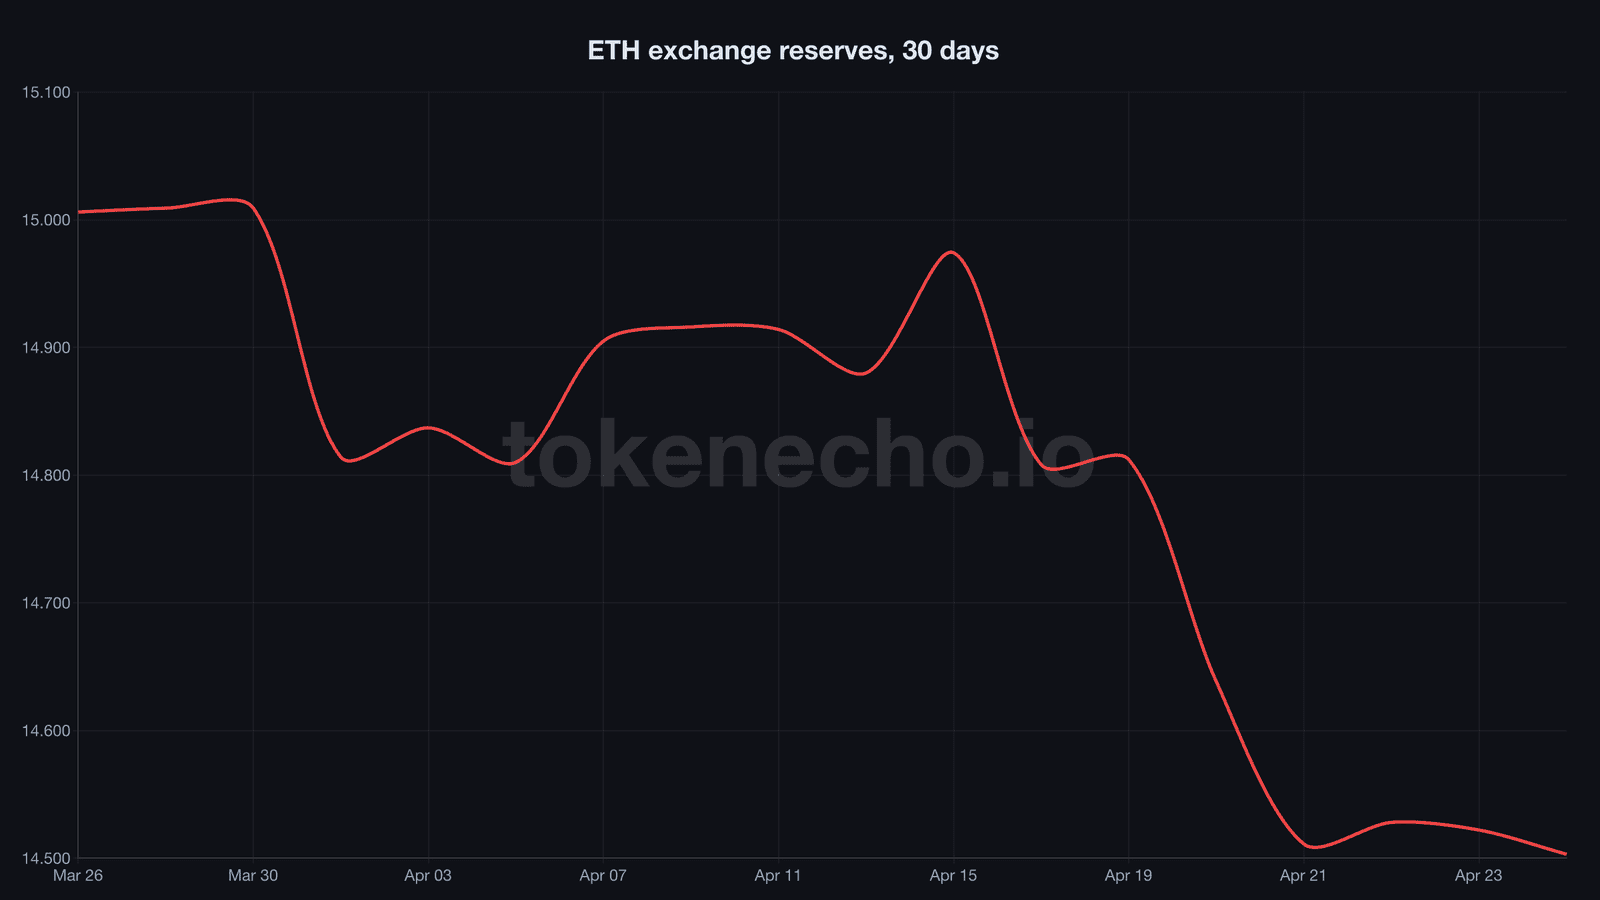
April 20 saw net outflows of 174,162 ETH, worth approximately $400 million at the time.
The following day added another 126,490 ETH in outflows. Combined, those two sessions accounted for $693 million leaving exchanges, the largest back-to-back drain in at least three weeks.
“When exchange reserves decline at this rate while price action stays flat, it typically signals accumulation rather than panic,” said Ki Young Ju, CEO of CryptoQuant, in a post on X on April 22, referencing similar patterns across major assets.
Bitmine Immersion Technologies added 101,627 ETH ($235 million) during the week ending April 22, the largest single-week purchase by the company in 2026. The firm now holds 4.98 million ETH, equivalent to 4.12% of circulating supply, making it the dominant institutional accumulator outside the ETF complex.
Leverage drops to 30-day low as ETF streak breaks
The estimated leverage ratio, a measure of open derivatives exposure relative to exchange reserves, dropped to 0.84 on April 20, its lowest reading in 30 days and well below the 0.97 danger zone that preceded the April 14-16 correction, CryptoQuant data shows.
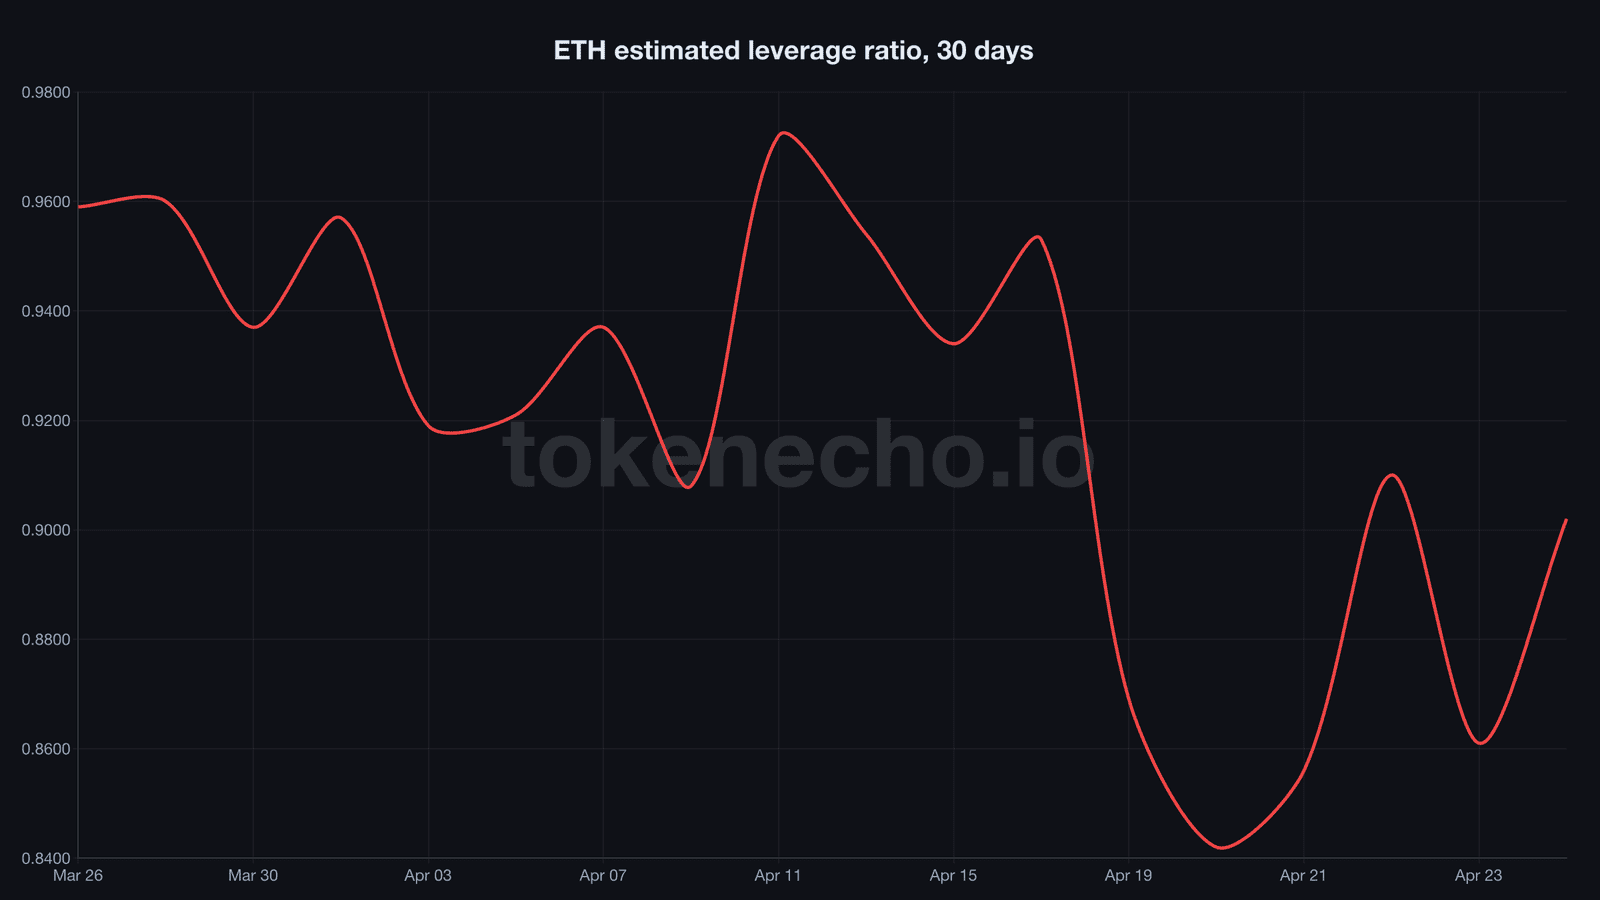
By April 24, the ratio had recovered to 0.90, still below the 30-day average of 0.92. The decline from 0.97 in late March to 0.84 represents one of the sharpest deleveraging episodes of 2026, clearing out speculative positioning that built up during Ethereum’s 14% rally in mid-April.
The eight-day streak of net inflows into spot Ethereum ETFs ended on April 23 with $75.9 million in outflows, according to CoinGlass. That streak had delivered $493.7 million in cumulative inflows, the strongest sustained buying period since ETH ETFs launched.
“The ETF pause looks like profit-taking after a strong run, not a trend reversal,” said Geoffrey Kendrick, head of digital assets research at Standard Chartered, in a note to clients on April 23. Kendrick maintained his $7,500 price target for Ethereum, citing the exchange reserve decline and Glamsterdam upgrade timeline as structural catalysts.
ETH/BTC falls below 0.03 for first time since late February
The ETH/BTC ratio slipped to 0.0299 on April 23 and has remained below the 0.03 level for three consecutive days, CoinGecko data shows. The last sustained break of that threshold came in late February, when the ratio touched a 90-day low of 0.02857 on February 15.
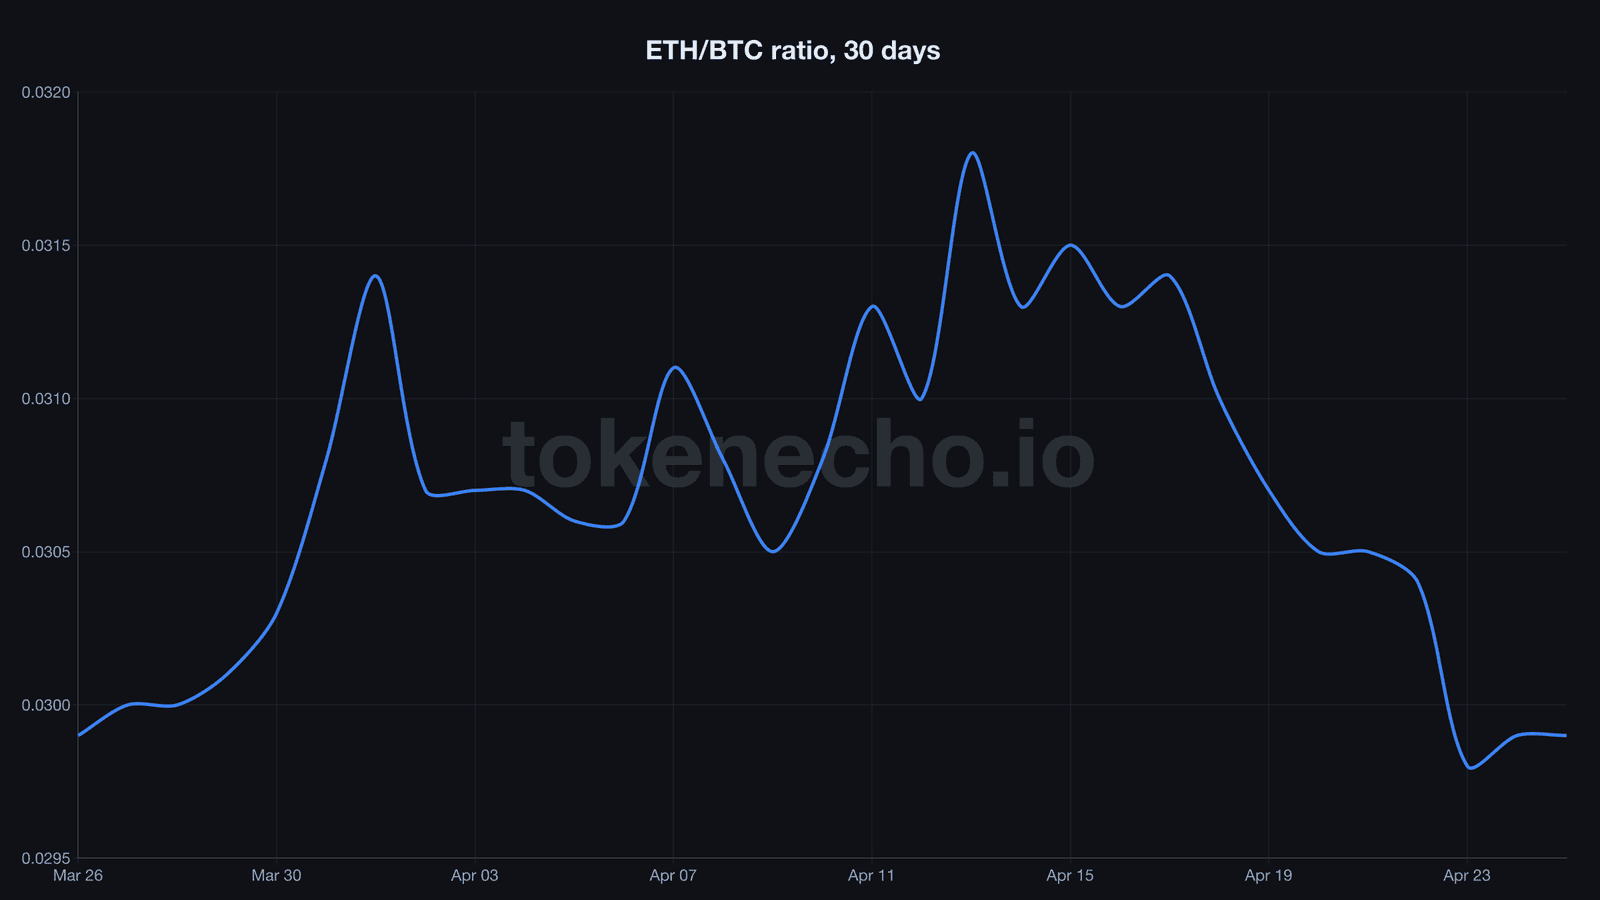
The mid-April recovery that brought the ratio from 0.0305 to 0.0318 on April 13 has completely unwound. CoinDesk reported on April 15 that analysts consider 0.035 the threshold for a “durable rotation” into Ethereum rather than a short-lived bounce. At 0.0299, the ratio sits 14.6% below that level.
Ali Martinez, a crypto analyst with 120,000 followers on X, said on April 22 that “$2,480 remains the breakout level, a sustained close above it would confirm the supply squeeze is translating into price action.”
Bitcoin, by contrast, has held above $77,000 for most of the week while Ethereum drifted lower. Ethereum’s market cap dominance has declined to approximately 10%, its lowest share since the pre-DeFi period of early 2020, according to CoinGecko.
January 2023 reserve drain preceded a 75% ETH rally
The current reserve decline shares structural similarities with January through March 2023. During that period, exchange reserves fell at a pace of 6-7% per month while ETH traded around $1,200.
Within 90 days, Ethereum rallied 75% to $2,100.
The current 30-day reserve decline of 3.35% is running at roughly half the 2023 pace. If the recent weekly acceleration to 1.9% holds for two more weeks, the monthly rate would converge with the pre-rally pattern from three years ago.
One structural difference stands between the two periods. Open interest across ETH derivatives stood at $6-8 billion in January 2023, according to CoinGlass. Current open interest sits between $25 billion and $34 billion, three to five times higher. The January 2023 rally unfolded on a much cleaner derivatives base than what exists today.
On-chain scorecard (3 of 6 bullish):
- ✅ Exchange reserves: declining to new monthly lows (14.50M ETH, -502K in 30d)
- ✅ Leverage ratio: 0.90, well below 0.97 danger zone (clean positioning)
- ✅ BitMine accumulation: 101,627 ETH purchased in single week (4.12% of supply)
- ⚠️ ETF flows: eight-day inflow streak broke on April 23 with $75.9M outflow
- ❌ ETH/BTC: below 0.03 for three days, losing ground to Bitcoin
- ⚠️ Price action: down 3.77% on the week, narrow $2,306-$2,331 range
TokenEcho verdict: cautiously bullish. The supply squeeze continues to build with 500,000 ETH leaving exchanges in 30 days and the leverage ratio dropping to its healthiest level in a month. The risk is that ETH/BTC breaks below the February low of 0.02857, which would signal deeper structural rotation away from Ethereum toward Bitcoin. Until ETH reclaims $2,400, the accumulation has not translated into price discovery.
This is an analytical assessment, not financial advice.
Conditions to watch over the next 72 hours:
- A sustained close above $2,400 with volume exceeding $15 billion would confirm that the supply squeeze is beginning to influence spot prices.
- ETH/BTC holding above 0.029. A break below would bring the February 15 low of 0.02857 into play, a level that coincided with the ratio’s weakest reading since 2020.
- ETF flow direction on April 25-28. A second consecutive session of outflows exceeding $50 million would mark the first sustained institutional selling since mid-April.
This analysis is part of TokenEcho’s daily Ethereum price tracking. See all previous analyses and key metrics on the hub page.
This is not financial advice. DYOR. Data as of April 25, 2026.
Sources: CryptoQuant, CoinGecko, CoinGlass
Leave a Reply