🕑 5 min read
Nineteen thousand dollars. That’s how much Bitcoin miners lose on every single coin they produce right now – with average production costs near $88,000 and BTC trading around $71,300 as of Wednesday morning. And instead of holding through the pain, the industry’s biggest players are dumping their treasuries and pivoting to AI.
This should terrify you. It doesn’t terrify us. Because we’ve seen this movie before.
The Great Miner Exodus
Bitdeer sold everything. All 1,132 BTC – gone in a single week back in February, including 943 freshly mined coins and every last satoshi from reserves. Treasury balance: zero. The company that once positioned itself as a Bitcoin-first miner is now an AI data center operator. Watching Bitdeer pivot from mining to machine learning feels like watching Kodak pivot to blockchain – except this time, the pivot might actually work.
But Bitdeer isn’t alone. Core Scientific offloaded roughly 1,900 BTC for $175 million in early March and openly stated it plans to “monetize substantially all” remaining reserves this year. MARA Holdings – sitting on a mountain of 53,822 BTC worth approximately $3.8 billion – quietly filed an SEC amendment in early March allowing Bitcoin sales for the first time in the company’s history. Riot Platforms already sold around $200 million worth in late 2025.
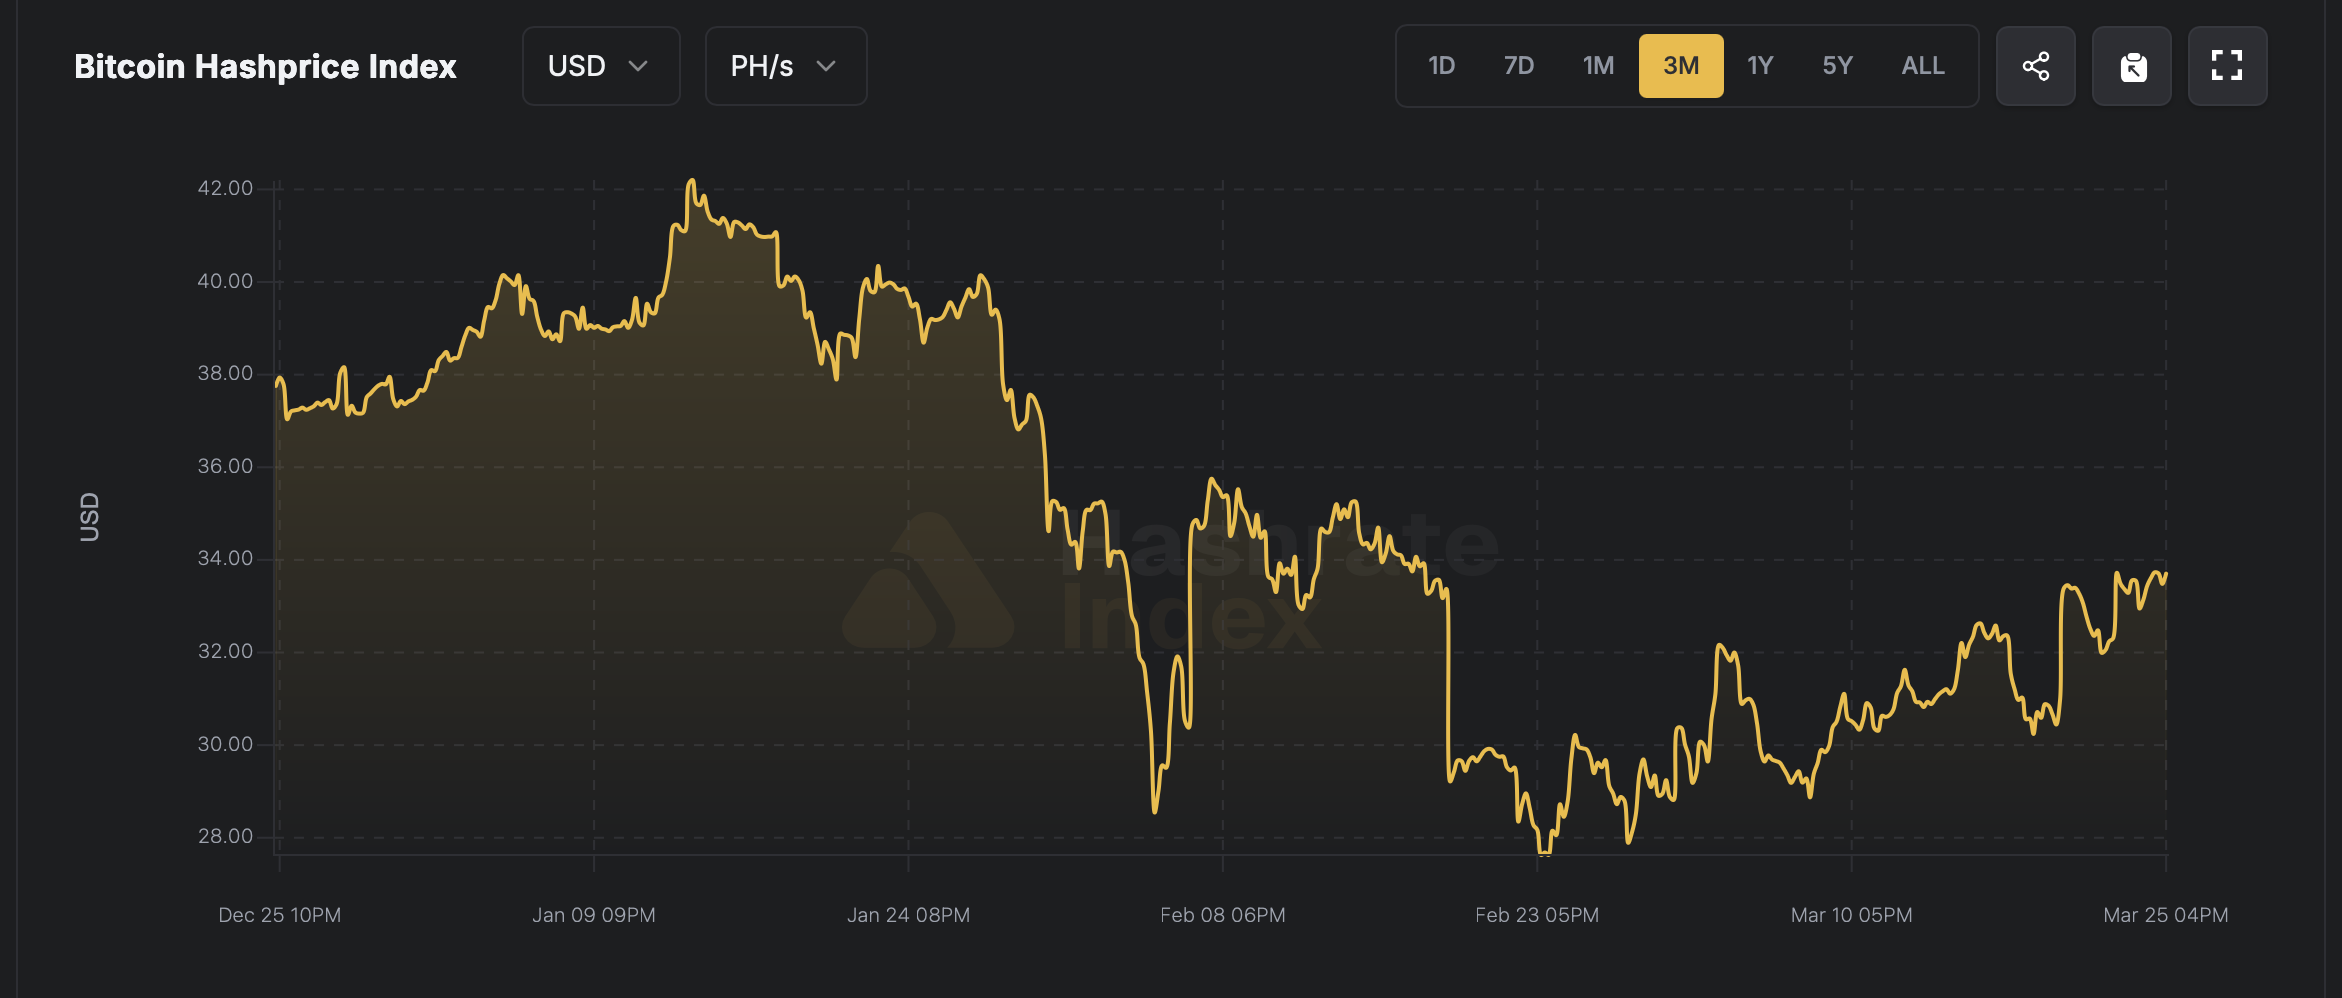
The math is brutal. At a hash price of roughly $24 per petahash per second per day, we’re staring at all-time lows. Difficulty dropped 7.76% on March 22 – the second-largest negative adjustment this year – because miners are literally switching off their rigs.
So is this the end of Bitcoin mining as we know it?
No. It’s probably the beginning of the next leg up.
Why Miner Pain Equals Market Bottoms
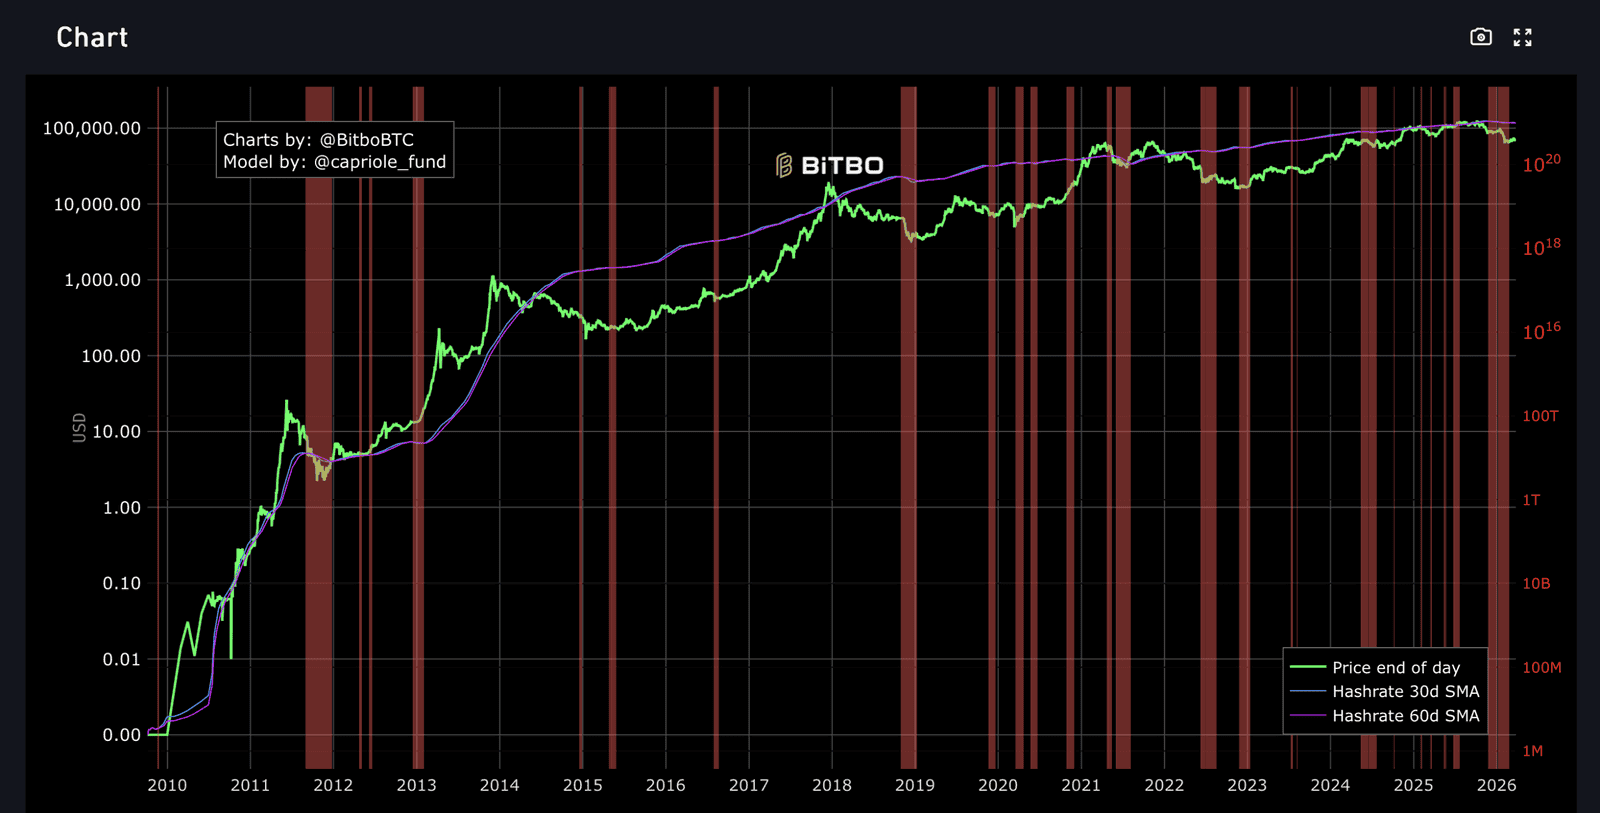
The Hash Ribbon indicator – which compares the 30-day and 60-day moving averages of Bitcoin’s hashrate – has been in capitulation territory for over three months now. That makes this one of the longest miner stress periods on record, according to Glassnode data. And it’s getting close to flashing a recovery signal.
Why does that matter? Since 2011, roughly 20 miner capitulation events have occurred. The overwhelming majority coincided with local or major price bottoms. Not some of them. Most of them – including January 2015, December 2018, and December 2022.
The statistics are hard to argue with. When Bitcoin’s hashrate declines over a 30-day window, the 180-day forward returns have been positive 77% of the time, with an average gain of 72%. That’s not a modest edge. That’s the kind of statistical pattern that makes quant traders salivate.
And the last time BTC traded below its average mining production cost? November 2022. Bitcoin was at $15,500. What followed was a 300%+ rally over the next 18 months.
Three Bottom Signals Converging at Once
Miner capitulation alone would be notable. But it’s not happening in isolation.
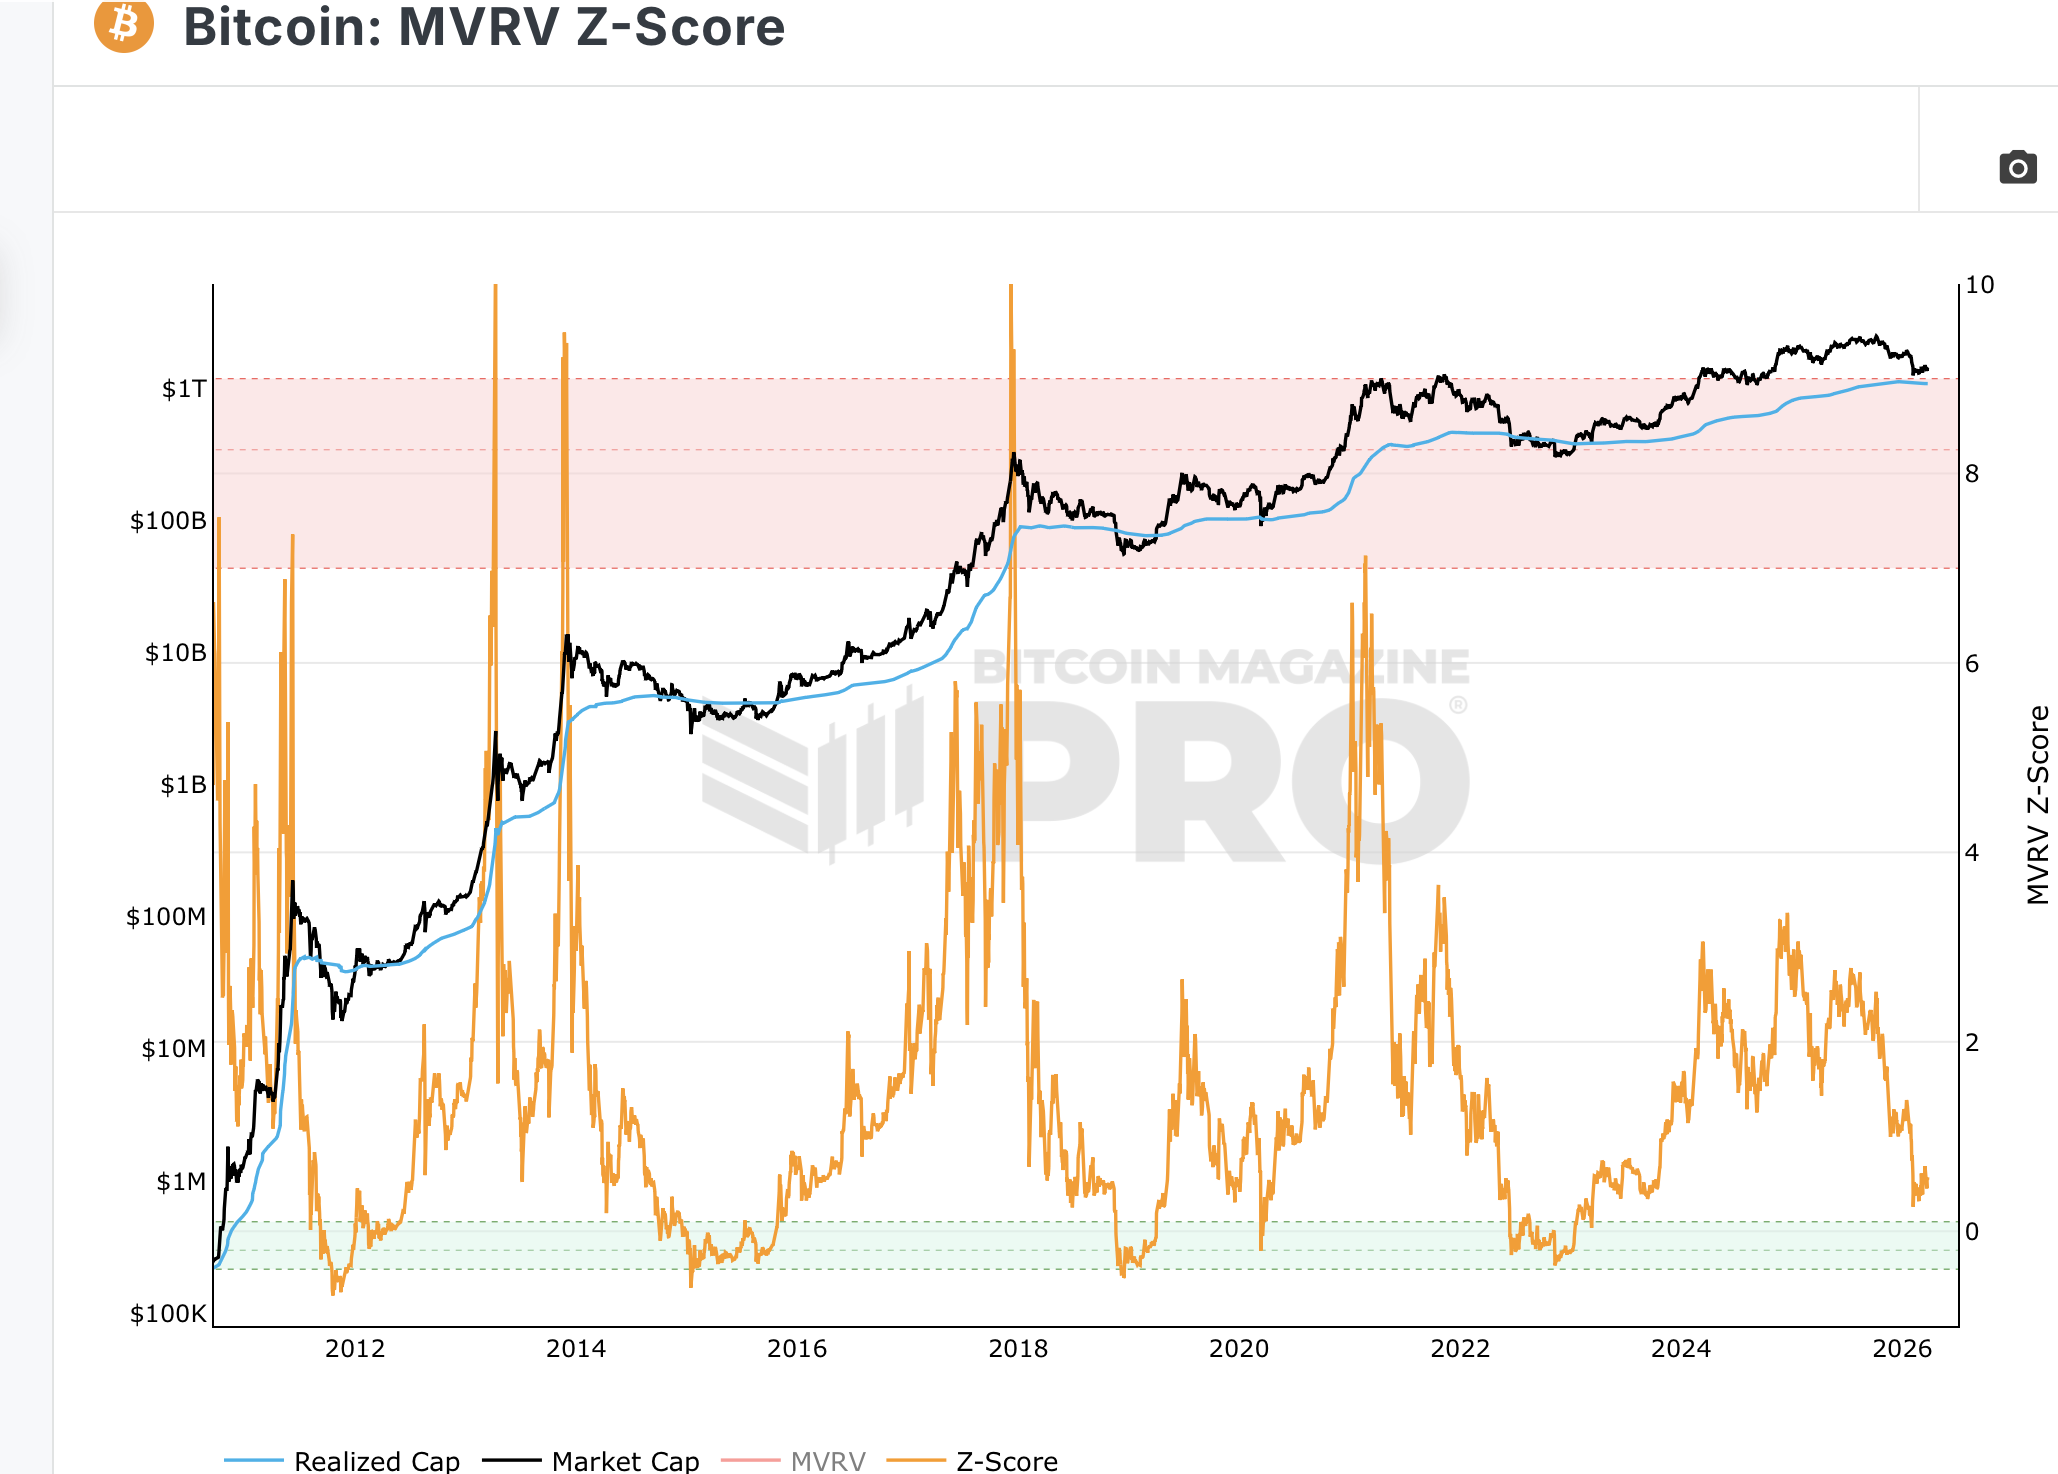
The MVRV Z-Score – which measures market value against realized value to gauge whether Bitcoin is over- or under-valued – dropped to 0.38. For context, that’s the same level we saw right after FTX imploded in November 2022. Think of MVRV like a price-to-book ratio for traditional stocks. Below 1.0 means the market is pricing Bitcoin below what holders actually paid for it. At 0.38, we’re deep in “blood in the streets” territory.
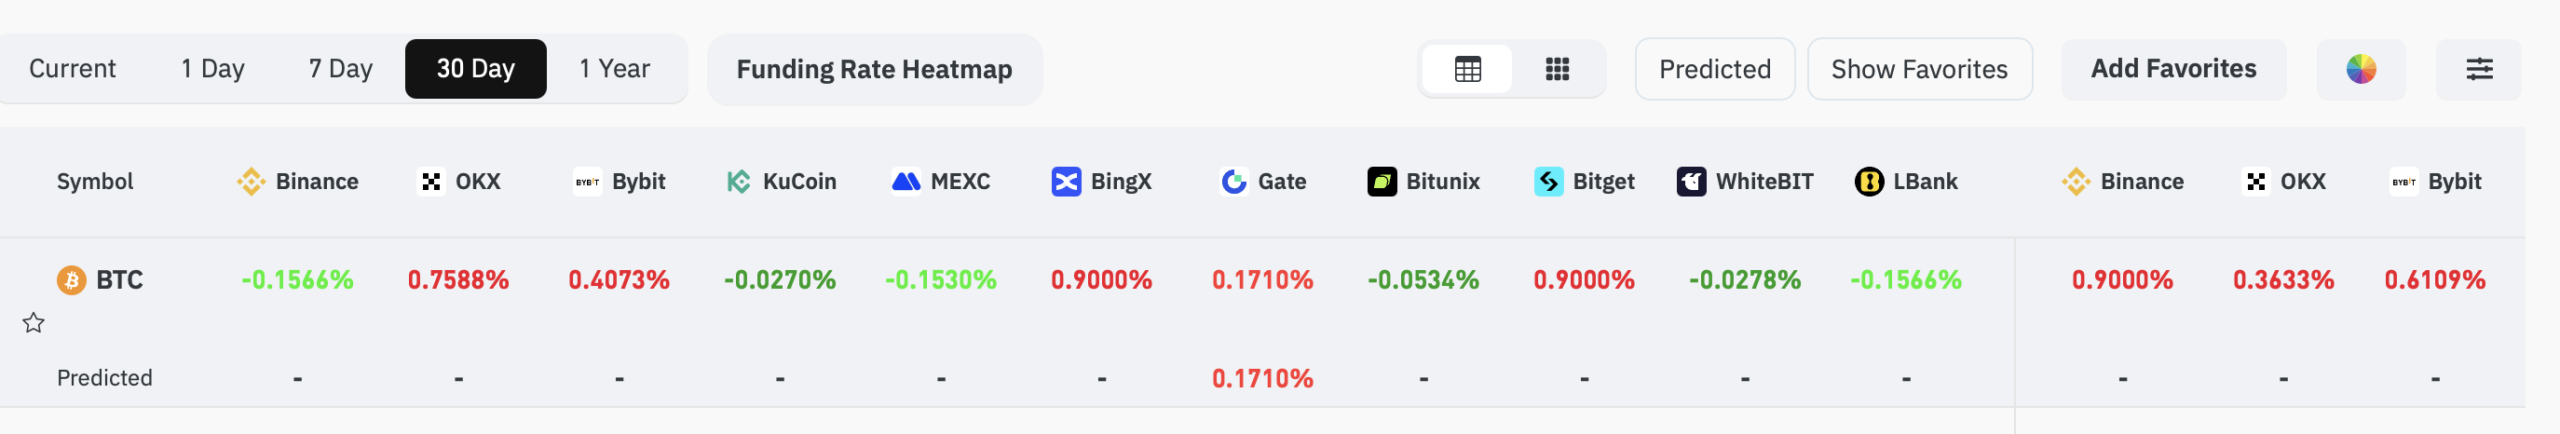
Then there’s the funding rate story. Bitcoin perpetual futures funding has been negative for 25 of the last 30 days, sitting around -0.02% – the lowest reading since early 2023. That means shorts are paying longs to keep their positions open. The 30-day funding percentile? Just 6%. Traders haven’t been this bearish in three years.
So we’ve got miners capitulating, MVRV at crisis levels, and futures traders piled into shorts at the exact price zone ($72K) where $800 million in liquidations would trigger if Bitcoin breaks through. That’s not one signal. That’s a convergence.
The Catch – And There’s Always a Catch
Not every capitulation leads to an instant recovery. The Hash Ribbon analysis suggests price bottoms typically form within two to four months of the signal – not overnight. And the macro backdrop is uglier than 2022 in some ways. The Fed’s hawkish hold on March 18 killed the rate-cut narrative, Trump’s Iran diplomacy window expires Friday, and PCE inflation data drops the same day.
On top of that, long-term holders aren’t behaving the way they did in previous bear markets. CryptoQuant’s UTXO Age Bands show something genuinely unusual: despite months of price weakness, the proportion of long-term held coins isn’t declining. It’s actually increasing. In past cycles, long-term holders distributed heavily during prolonged downtrends. Not this time.
That’s either very bullish – diamond hands on a scale we haven’t seen before – or it means the real capitulation hasn’t happened yet. We lean toward the former, but we’re not betting the farm on it.
Bottom Line
Bitcoin miners are bleeding out. Treasuries are being liquidated. Rigs are going dark. The industry that secures the network is pivoting to AI because mining Bitcoin at $88,000 per coin while it trades at $71,000 is a losing proposition by every measure.
But every time miners have thrown in the towel like this – every single time over the past decade – it marked the bottom, not the top. The Hash Ribbon is close to confirming it. MVRV is screaming undervaluation. And shorts are so crowded that one sustained push above $72,000 could trigger an $800 million liquidation cascade.
Is this the bottom? The on-chain data is making a stronger case than we’ve seen since November 2022. But the macro? That’s the wild card nobody can model.
This is not financial advice. DYOR. Data as of March 26, 2026.
Leave a Reply