🕑 5 min read
On-chain metrics flash a dangerous divergence: leverage surged 12% in five days while SOPR stayed below break-even for six straight sessions — and $260 billion in stablecoins sits on the sideline, waiting.
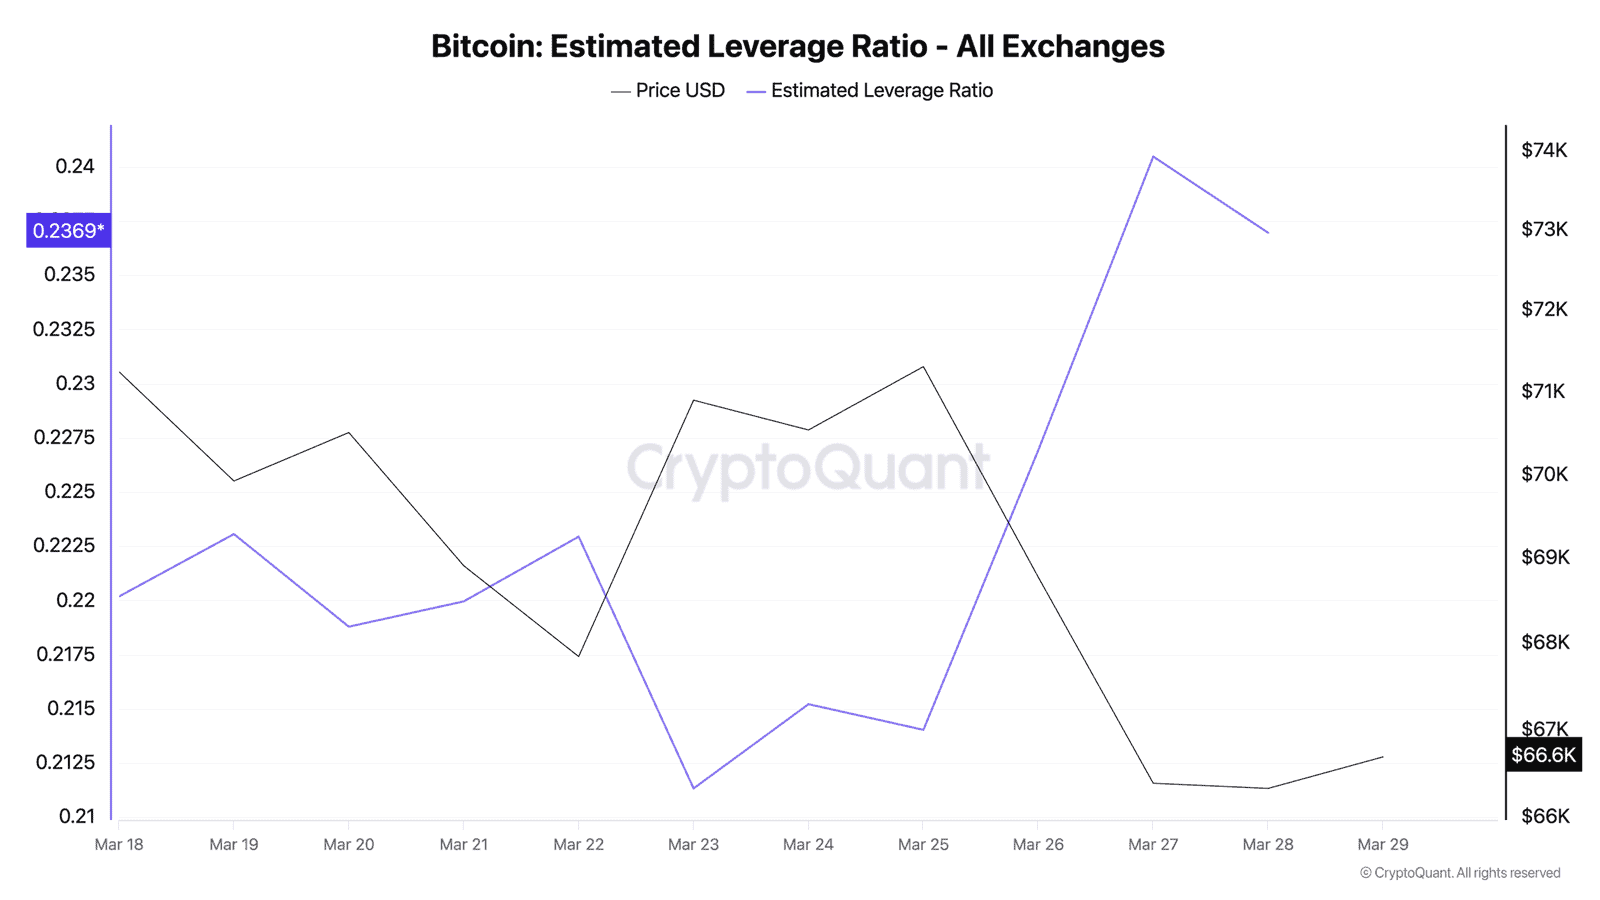
Bitcoin’s estimated leverage ratio just climbed from 0.211 to 0.237 in five days. That’s a 12% spike – the steepest weekly jump since the October 2025 liquidation event that wiped $2.3 billion in a single afternoon.
And it’s happening while almost everyone in the market sells at a loss.
Six Days of Red: SOPR Won’t Recover
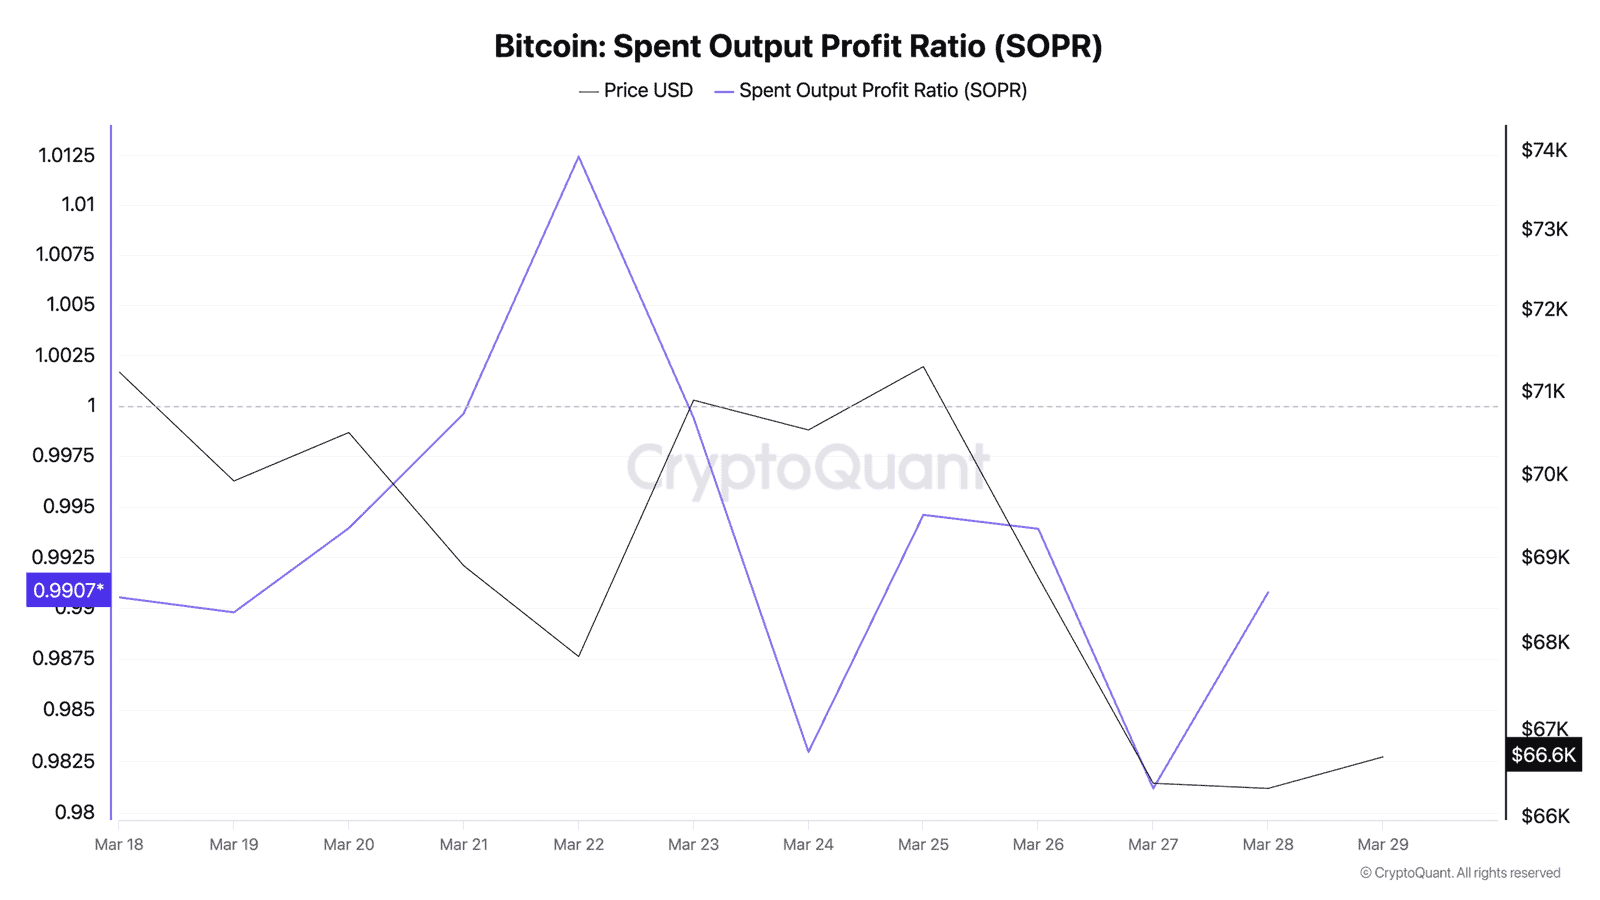
The Spent Output Profit Ratio, a metric that tracks whether coins move at a profit or loss, hasn’t crossed above 1.0 since March 22. Six consecutive days below break-even. The adjusted SOPR hovers between 0.967 and 0.991, which means the average BTC transaction on-chain is locking in losses.
But long-term holders are getting hit harder. LTH-SOPR cratered from 1.94 on March 22 to 0.723 by March 28 – a collapse that signals even the most patient investors are dumping coins they’ve held for months or years at steep discounts. That’s not a correction. That’s capitulation in real time.
“As of March 11, long-term holder SOPR fell to 0.64. This means selling occurred at about a 36% loss versus the average purchase price, and it is one of the strongest capitulation signals in recent months,” said The Enigma Trader, a CryptoQuant contributor. By late March, the ratio has partially recovered but still sits deep in loss territory at 0.72.
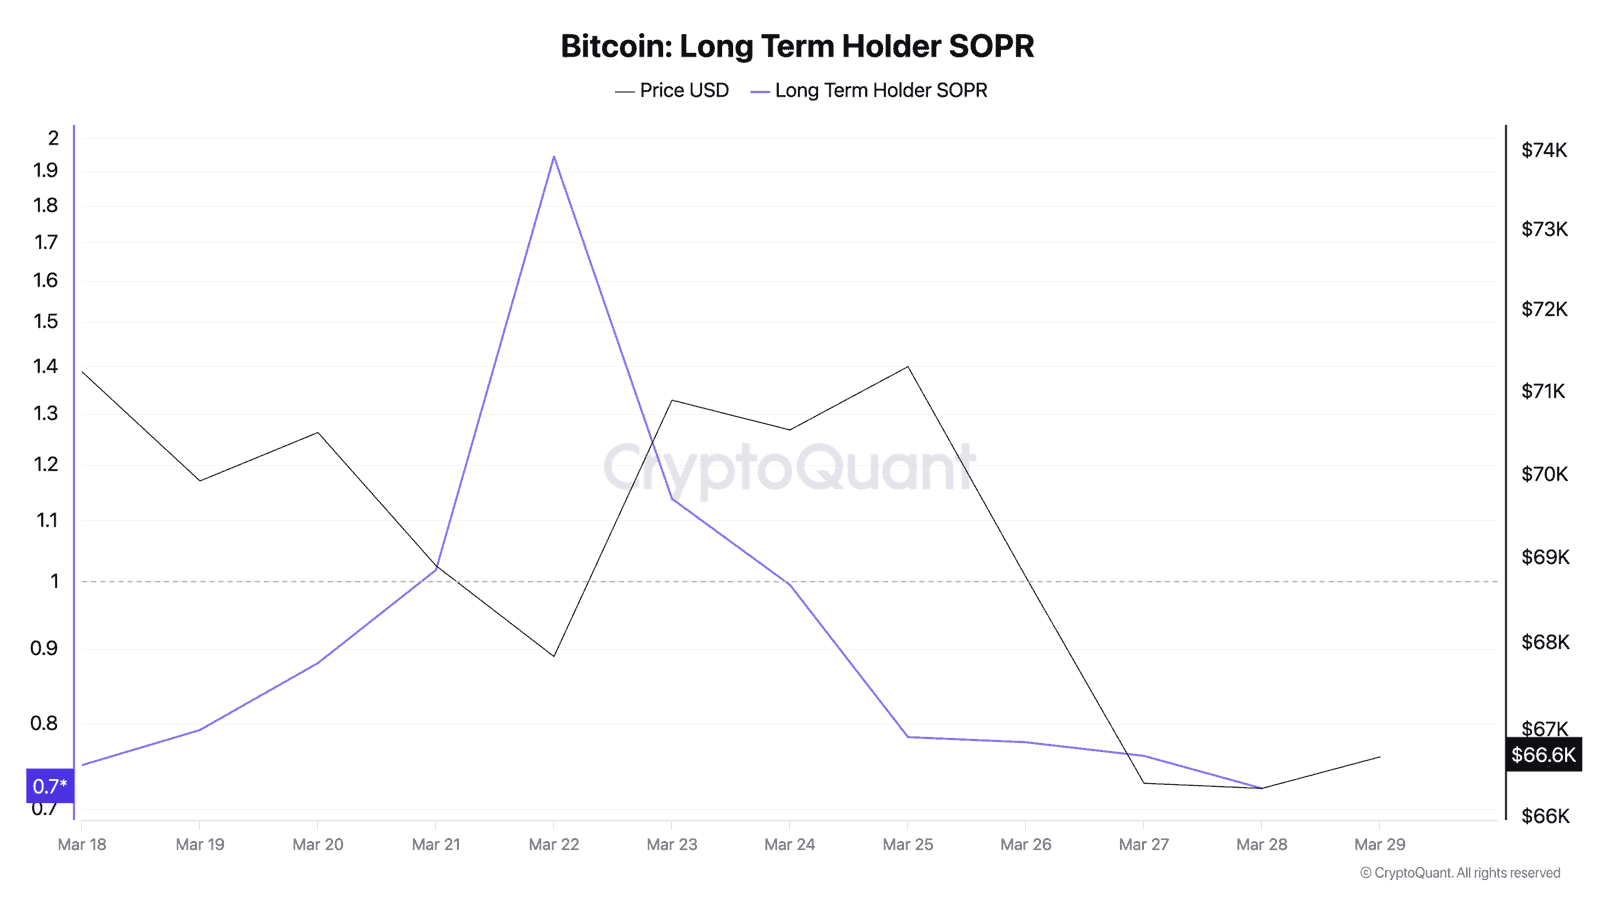
Short-term holders aren’t faring much better. STH-SOPR bounced to 0.994 on March 28 – technically a loss, but barely. These traders have largely stopped panic-selling after weeks of capitulation. They’re underwater but no longer rushing to the exit.
So who’s adding leverage?
Leverage Builds While the Ship Takes On Water
The estimated leverage ratio, which divides futures open interest by exchange BTC reserves, has climbed relentlessly since March 23. Think of it like this: traders are borrowing more while collateral shrinks. It’s the financial equivalent of adding floors to a building while removing foundation bricks.
Industry-wide crypto futures open interest sits at $112 billion. Binance alone holds $11.1 billion in BTC futures – roughly 35% of the total market. And the funding rate, while not extreme, has been oscillating around neutral, suggesting neither bulls nor bears have fully committed. Yet.
What makes the current setup dangerous isn’t the leverage alone. It’s the leverage combined with thin collateral buffers. Exchange reserves have bounced off their March 25 low of 2,701,496 BTC but remain near multi-year lows at 2,704,667 BTC. Less collateral backing more leverage means any sharp move – up or down – triggers a cascade.
Michael Marshall, Head of Research at Amberdata, previously noted that once the leverage ratio climbs toward the 0.27 zone, “a modest move can wipe out thin collateral buffers and force exchanges to close positions, turning a dip into a cascade.” We’re at 0.237 and climbing.
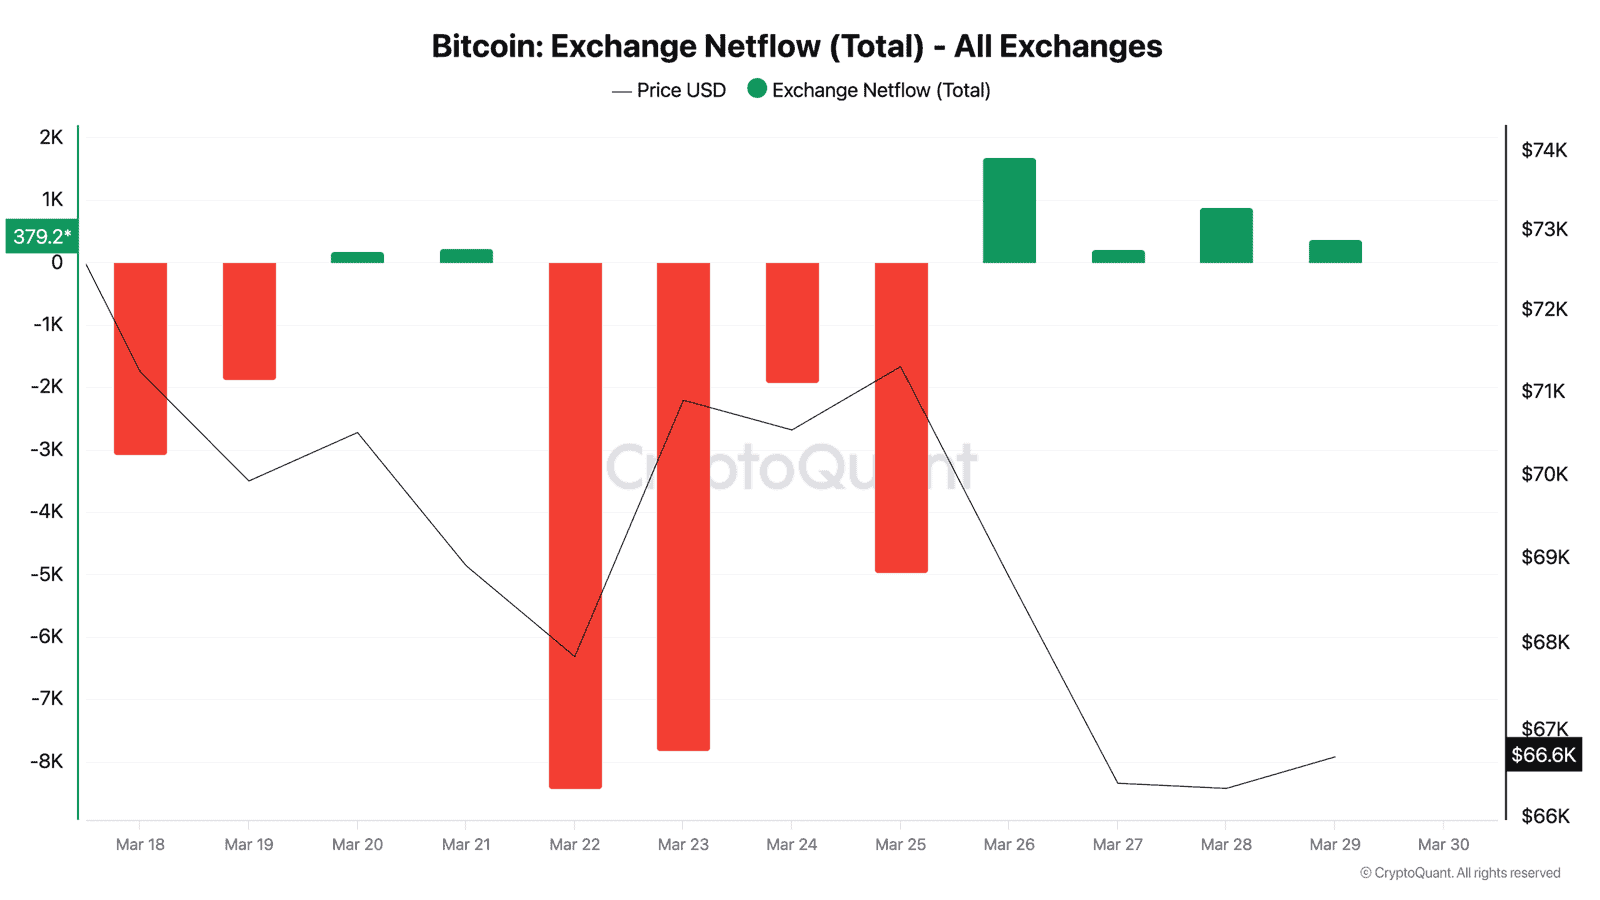
The Coins Are Flowing Back to Exchanges
Exchange netflows just flipped positive after three days of massive outflows. Between March 22-25, over 14,680 BTC left exchanges – a classic accumulation signal. But since March 26, roughly 2,770 BTC has flowed back.
Not a flood. But a reversal.
CryptoQuant netflow data tells the story: March 22 saw -8,488 BTC (outflow), March 23 added -7,810, March 25 brought -4,954. Then the flip. March 26 pushed +1,693 BTC inflow, March 28 added +885, and March 29 shows +379 so far.
When coins move to exchanges, it typically means holders are positioning to sell – or at minimum, making their BTC available for liquidation. Combined with rising leverage, this creates a setup where forced selling can feed on itself. It happened in October 2025 when $2.3 billion vanished in hours. It happened again in January 2026 when $1.7 billion in longs got liquidated in a single session.
The pattern rhymes. Every time.
ETFs Quietly Trimming, Not Buying
Spot Bitcoin ETFs held 1,324,711 BTC on March 23. By March 29, that number dropped to 1,318,737 – a net reduction of 5,974 BTC worth roughly $397 million at current prices.
Nobody’s talking about this.
The narrative says institutional adoption marches forward. And yes, Strategy absorbed 45,000 BTC in 30 days while other corporate buyers vanished. But the broader ETF complex is quietly heading for the exit. IBIT remains the lone positive outlier, while the rest bleeds.
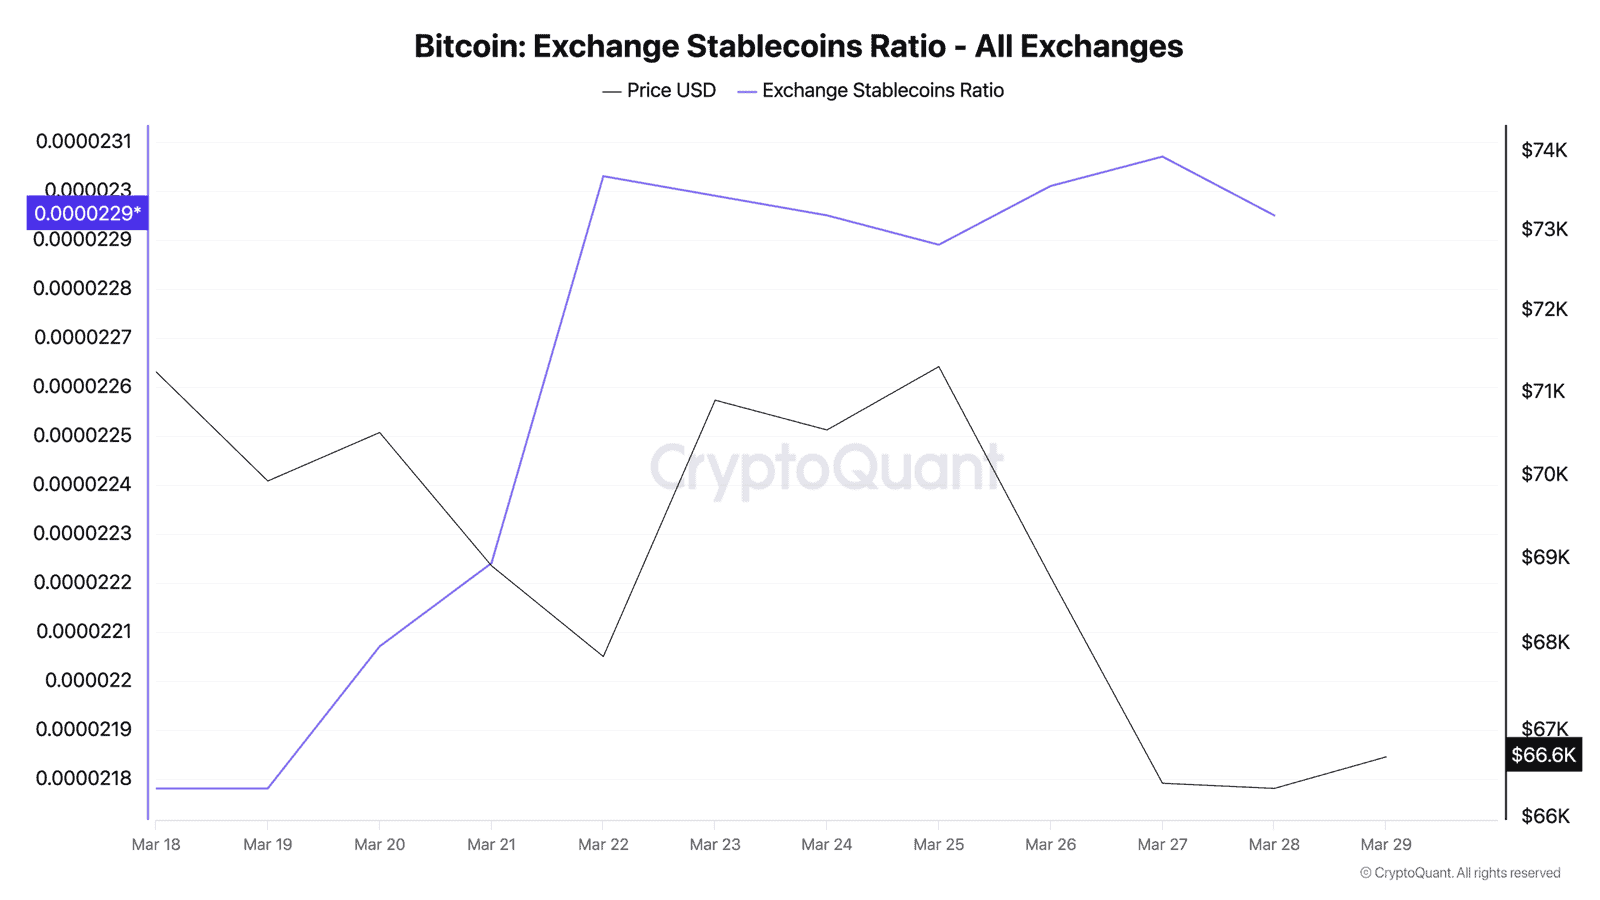
Stablecoin Buying Power Keeps Growing – and Nobody’s Pulling the Trigger
The Exchange Stablecoins Ratio, which measures BTC reserves against stablecoin reserves on exchanges, has been declining steadily. A falling ratio means stablecoins are piling up faster than Bitcoin on trading platforms – in plain English, there’s more ammunition sitting on the sideline than usual.
How much? USDT alone commands $184 billion. USDC adds $77.7 billion. Throw in USDS, USDe, and smaller stablecoins, and you’re looking at roughly $280 billion in dry powder. Even if just 10% of that rotates into BTC, that’s $28 billion – more than enough to rip through the current order books.
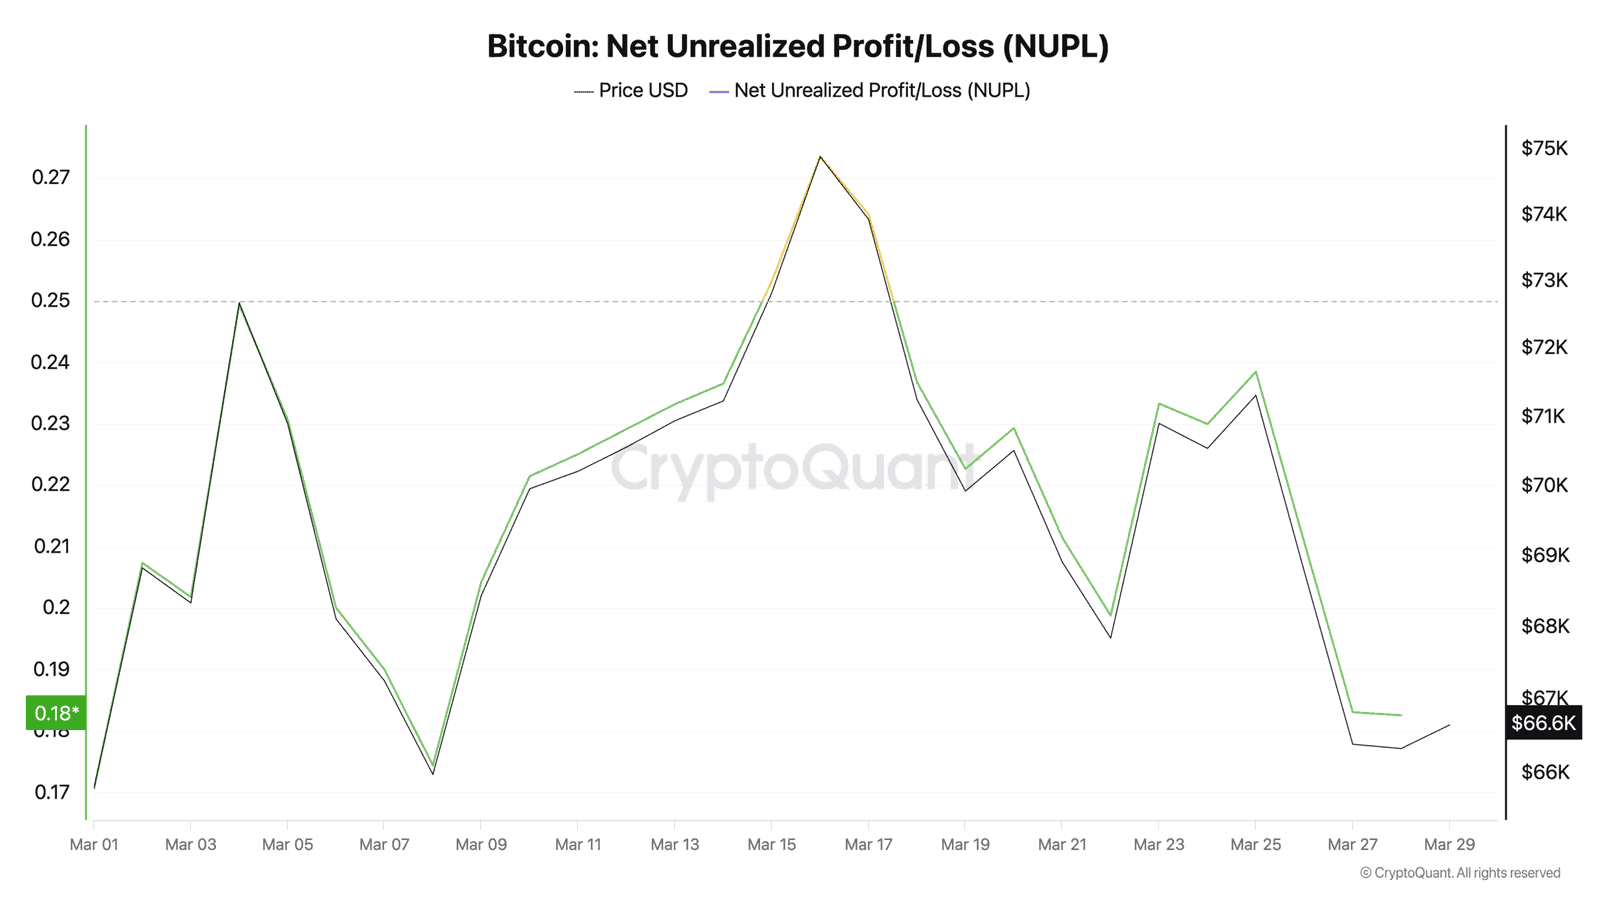
But nobody’s buying yet. NUPL, which measures net unrealized profit and loss across all holders, has slid to 0.183. That’s the “anxiety” zone, one step above outright capitulation. Historically, when NUPL drops below 0.15, it marks cycle bottoms – March 2020, June 2022, November 2022.
We’re not there yet. Close, though.
The Puell Multiple Says What Price Can’t
Miners are struggling. The Puell Multiple, which compares daily miner revenue to the 365-day average, hit 0.619 on March 24 – deep inside the green zone that’s historically marked generational buying opportunities.
It bounced to 0.814 by March 28, but the damage is visible. Bitcoin miners are earning barely 62-81% of their yearly average revenue. The last time Puell stayed this low for this long, BTC rallied 300% within 12 months. But “historical parallel” doesn’t mean “guaranteed replay.” The macro environment – Iran tensions, 4.5% Treasury yields, $112 billion in leveraged futures – didn’t exist in those prior setups.
MVRV at 1.22 and declining confirms the picture. Bitcoin’s market value barely exceeds its realized value by 22%. Not oversold enough for a screaming buy. Not healthy enough for a sustained rally. Stuck in no-man’s land while leverage builds underneath.
Something’s going to break. The only question is which direction.
This is not financial advice. DYOR. Data as of March 29, 2026.
Leave a Reply