
🕑 4 min read
Ethereum’s biggest daily gain in two weeks arrives as derivatives traders quietly deleverage – and exchanges keep bleeding ETH.
A Bounce With Teeth
Ethereum clawed back above $2,040 on Sunday, gaining 2% in 24 hours. That’s the strongest single-day move since mid-March. Market cap recovered to $246.6 billion, and 24-hour volume hit $12.7 billion – nearly double last week’s Sunday numbers.
On the surface, this looks like a routine weekend bounce. Underneath? Three different data points are shifting at once.
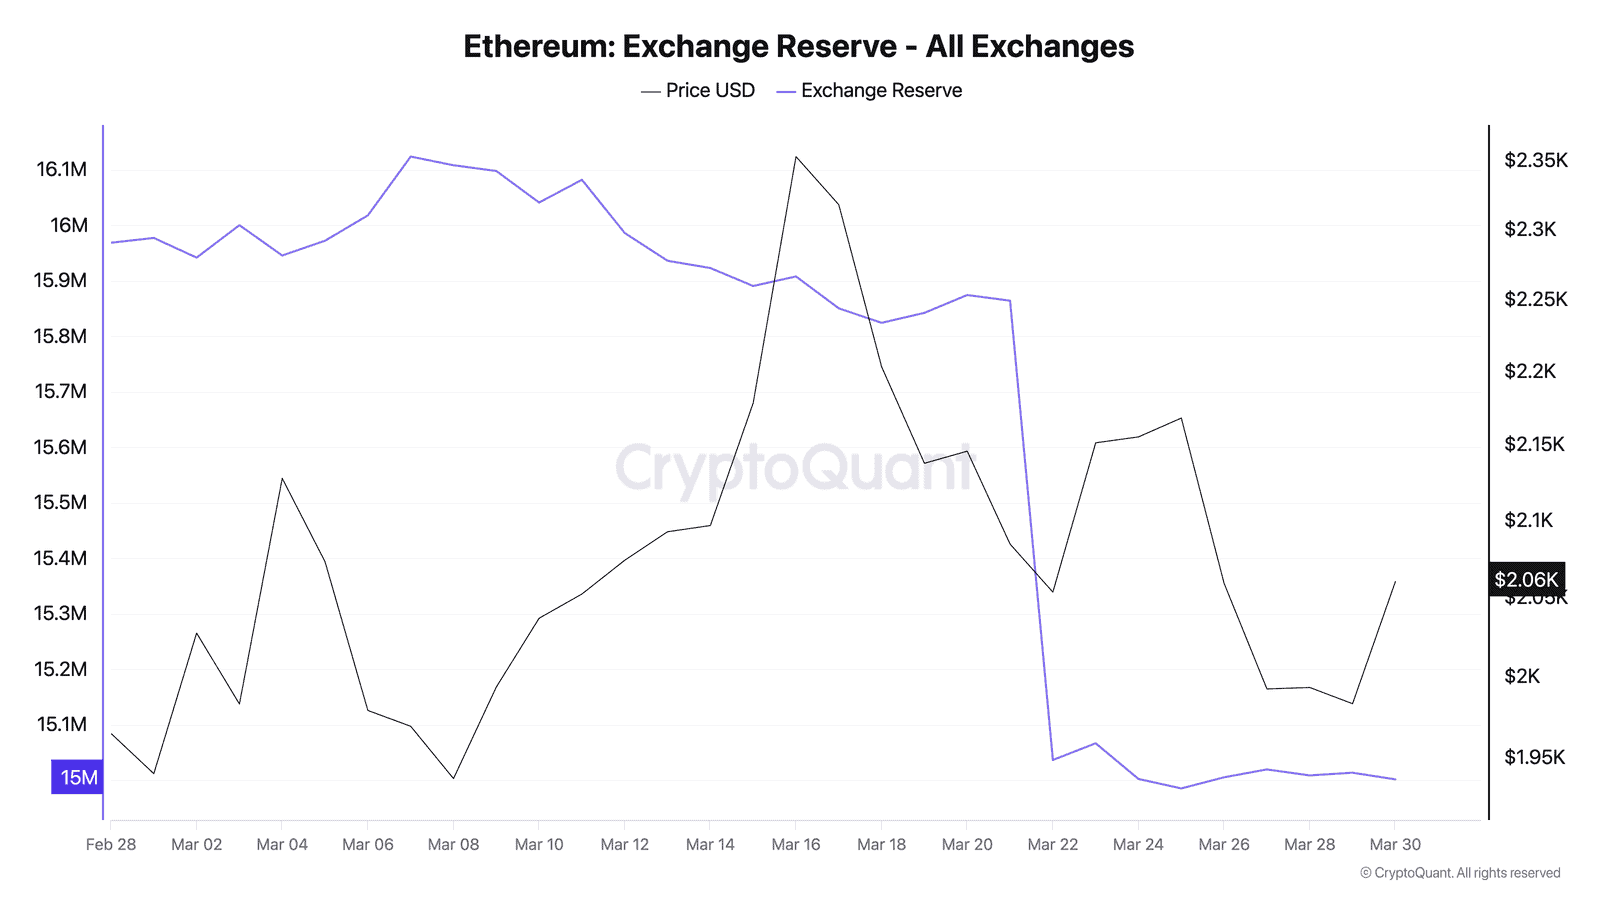
53,000 ETH Walked Off Exchanges This Week
Exchange reserves dropped from 15,066,899 ETH on March 23 to 15,013,892 by March 29. That’s 53,007 ETH gone – worth roughly $108 million at current prices.
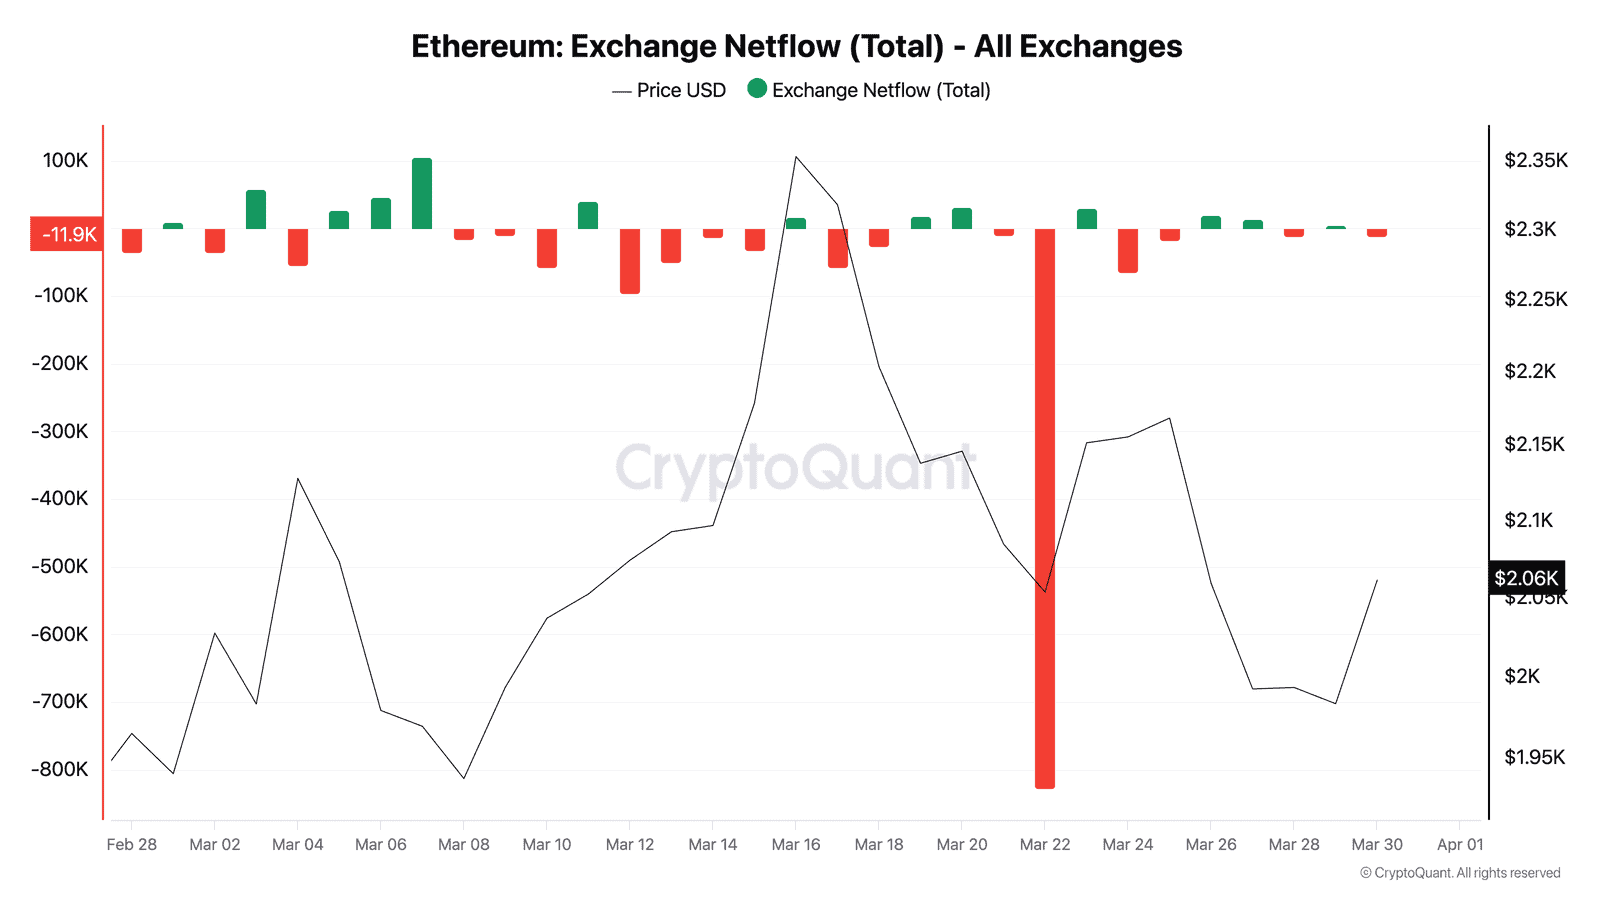
The move wasn’t gradual. On March 24, exchanges saw a single-day outflow of 64,271 ETH – one of the largest daily withdrawals since the Merge. March 25 added another 17,019 ETH in outflows. Then the pattern got messy: 20,050 ETH flowed back on March 26, 14,135 on March 27, before another 10,770 left on March 28.
The net result? Reserves are down and the trend is clear, even if the path isn’t smooth. Compare this with BTC where exchange reserves actually climbed this week. ETH is doing the opposite.
Someone is accumulating. And they’re not being subtle about it.
The Leverage Pressure Valve Is Opening
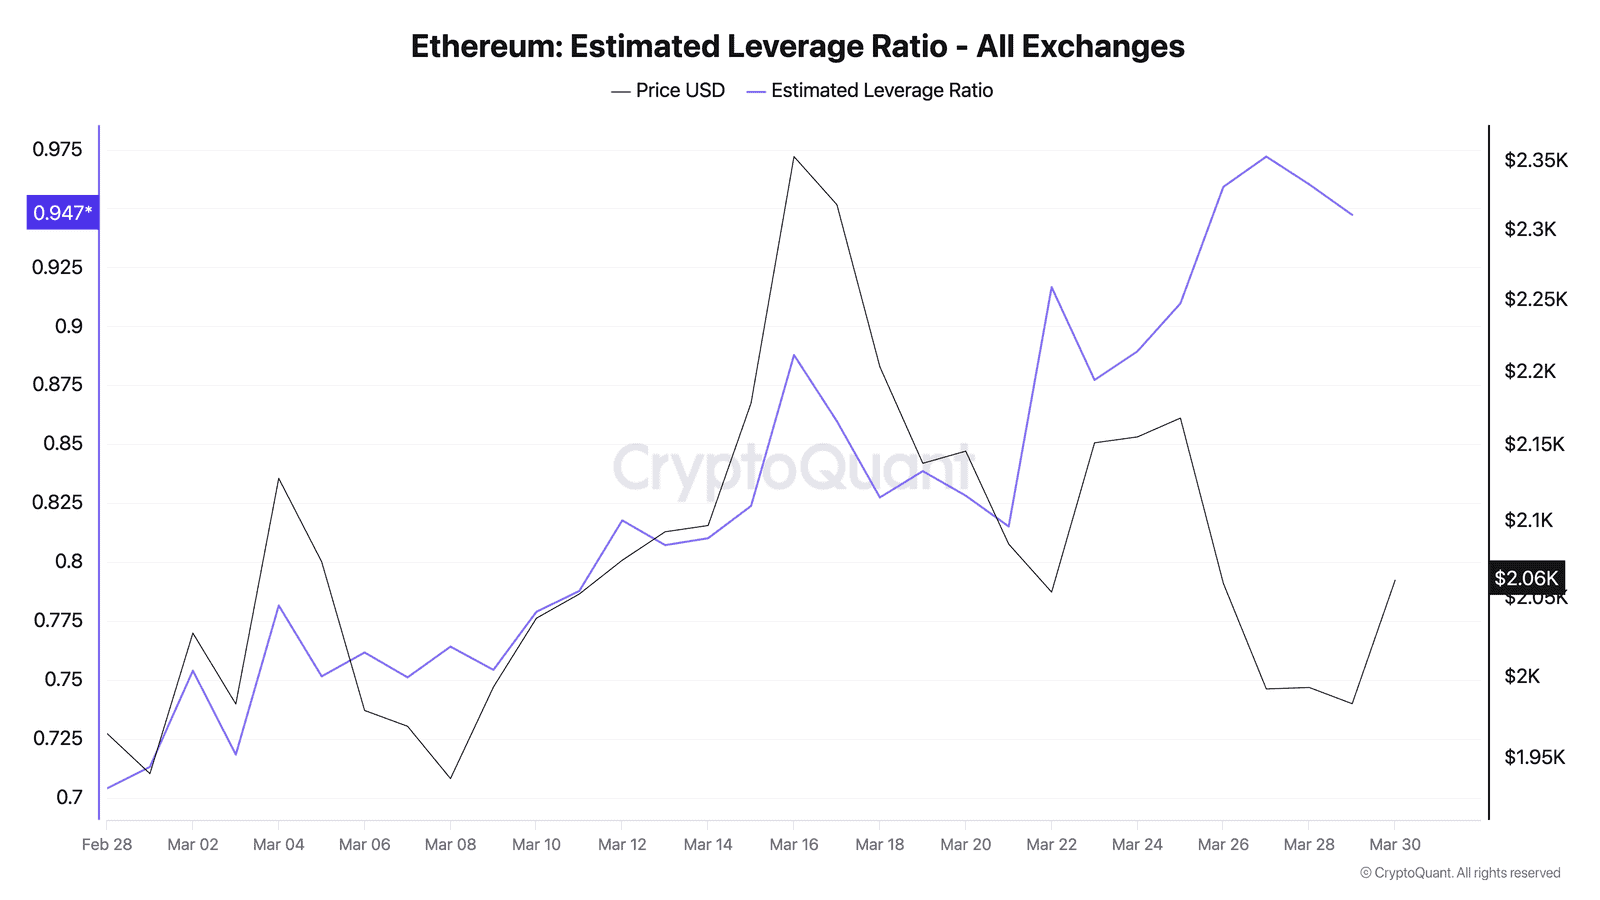
ETH’s estimated leverage ratio tells a story that contradicts the fear in crypto Twitter. It surged from 0.877 on March 23 to a peak of 0.972 on March 27 – an 11% increase that signaled overcrowded derivatives positions.
Then it started cooling. By March 29, leverage dropped to 0.947. That’s still elevated, but the direction matters more than the level.
When leverage unwinds without a crash, it means positions are closing voluntarily – not getting liquidated. Traders are taking risk off the table in an orderly fashion. That’s the kind of reset you want to see before a sustainable move higher.
BTC’s leverage ratio is still climbing (0.236, up 12% weekly). ETH’s is already pulling back. The derivatives market is treating them differently.
The ETH/BTC Ratio Won’t Budge
At 0.0304, ETH/BTC sits at a five-year low. It barely moved despite today’s 2% bounce – because BTC also gained 1%. The ratio has been stuck in the 0.029-0.031 range for three weeks. Not breaking down further, but not recovering either.
Dominance tells the same story. ETH’s share of total crypto market cap hovers around 10%. For context, it was 18% a year ago and 22% at its peak in 2023.
This is the elephant in the room that no ETH analysis can ignore. The asset is 58.7% below its $4,946 all-time high from August 2025 – deeper in drawdown than BTC’s 46.6%. ETH is underperforming on every timeframe.
But the divergence between ETH’s price weakness and its exchange outflows is exactly the pattern that preceded the Q4 2025 rally. Back then, ETH/BTC hit 0.032, exchange reserves dropped for six consecutive weeks, and then BlackRock’s ETHB filing leaked. ETH rallied 82% in 11 weeks.
Bitmine, BlackRock, and the Institutional Undercurrent
The exchange outflows aren’t happening in a vacuum. Bitmine just bought another $108 million in ETH despite sitting on $7.8 billion in unrealized losses – the kind of conviction trade that makes Wall Street uncomfortable. BlackRock’s staked ETH fund ETHB pulled in $155 million on day one, beating its own Bitcoin ETF debut by 40%.
Retail is selling. Institutions are building positions. And the on-chain data confirms it – those 53,000 ETH didn’t walk themselves off Coinbase.
Levels to Watch
Support sits at $2,000 (psychological and recent floor), $1,850 (late-February low), and $1,750 (if everything breaks).
Resistance: $2,100 (20-day moving average), $2,150 (early March rejection), and $2,400 (the level ETH needs to reclaim for any trend reversal conversation).
The 2% bounce is encouraging. But ETH needs to flip $2,100 to signal anything more than a dead cat. Until then, the real story lives on-chain – in the 53,000 ETH quietly leaving exchanges while everyone argues about whether the flippening is dead.
If exchange outflows continue at this pace while leverage keeps cooling, ETH’s next move could surprise the same traders who gave up on it.
This analysis is part of our daily Ethereum price tracking. See all previous analyses and key metrics on our hub page.
This is not financial advice. DYOR. Data as of March 30, 2026.
Sources
- CoinGecko Ethereum data: coingecko.com/en/coins/ethereum
- CryptoQuant ETH Exchange Reserve: cryptoquant.com
- CryptoQuant ETH Exchange Netflow: cryptoquant.com
- CryptoQuant ETH Leverage Ratio: cryptoquant.com
Leave a Reply