
🕑 4 min read
BTC surged 2.5% overnight – but exchange data shows someone is selling into the rally.
Bitcoin kicked off Q2 at $68,749, posting its sharpest single-day gain in two weeks. This bitcoin price analysis breaks down whether the bounce has legs – or whether 4,645 BTC worth of exchange inflows since Saturday are about to kill the momentum.
After BTC closed its worst quarter since the FTX collapse at $66,878, the overnight pop to $69,136 before pulling back felt almost too clean. Q2 opens are historically volatile for crypto – and the on-chain picture backing this one is messy.
SOPR Crawls Toward Break-Even
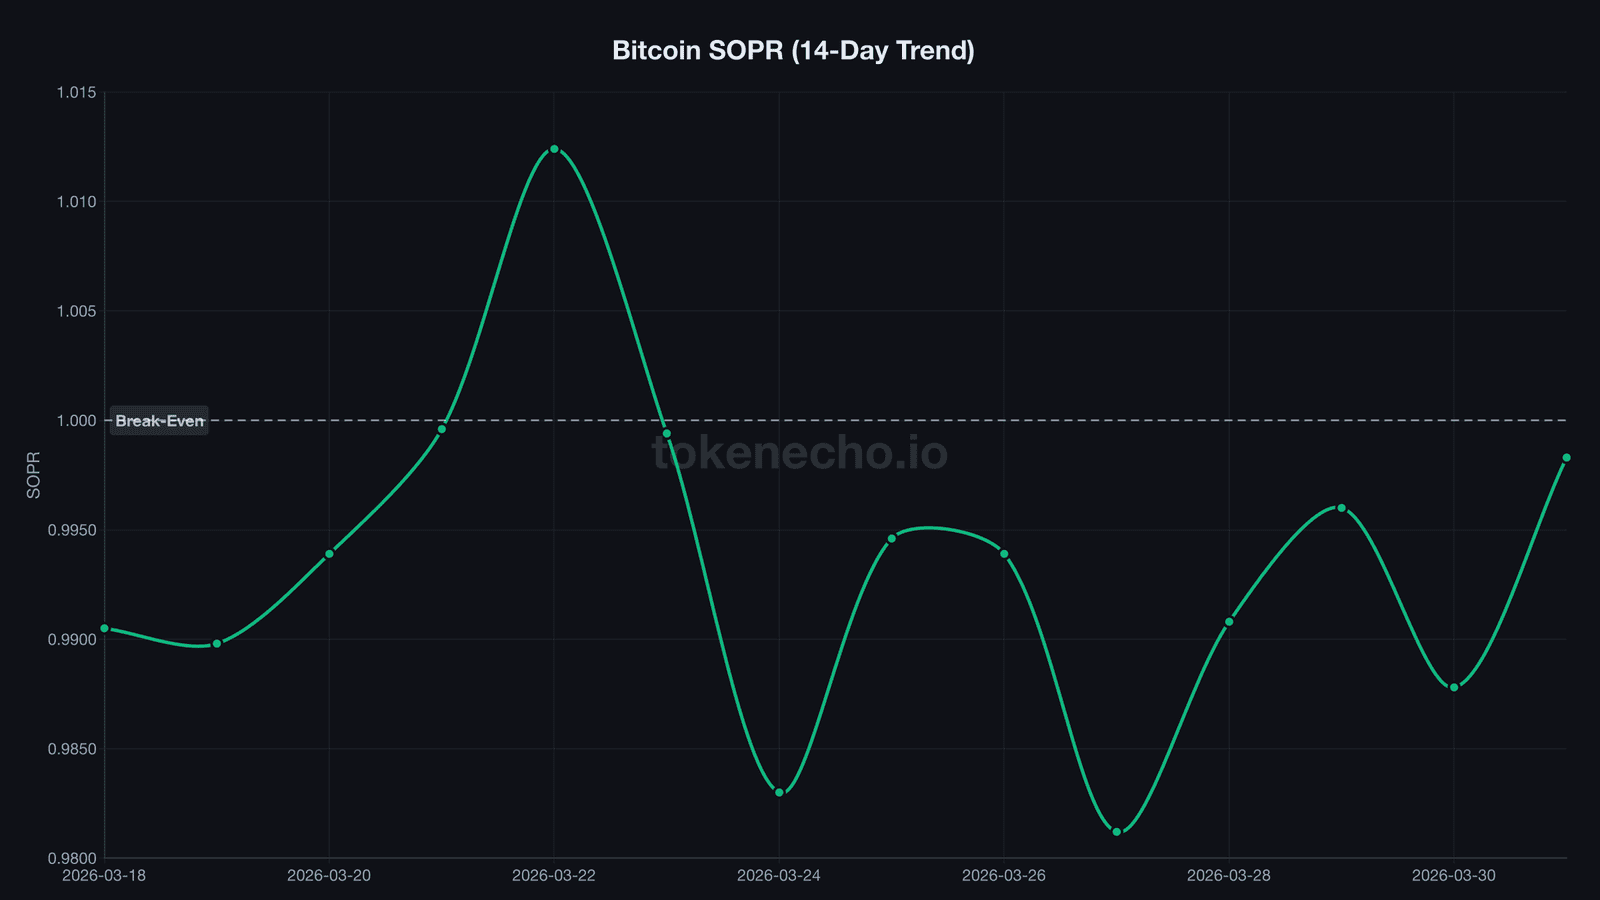
For ten straight days, every bitcoin that changed hands did so at a loss.
SOPR, the spent output profit ratio that tracks whether moved coins are sold above or below their cost basis, hasn’t touched 1.0 since March 22. It closed March 31 at 0.998 – agonizingly close to break-even after bottoming at 0.981 on March 27.
Why does 1.0 matter so much? Because it’s the psychological line where holders stop taking losses. The last time SOPR ran below 1.0 for this long was during the FTX aftermath in late 2022. That streak ended – and BTC rallied 300% over the next 14 months.
But there’s a wrinkle nobody’s discussing.
LTH-SOPR, which isolates long-term holders specifically, whipsawed from 0.687 on March 30 to 0.994 on March 31. That’s a one-day jump of 44%. Coin Days Destroyed spiked to 23.9 million from 6.5 million the same day – meaning old coins, dormant for months or years, moved on the last day of Q1.
Someone with diamond hands finally blinked. And they sold almost exactly at break-even.
Exchange Inflows Won’t Quit
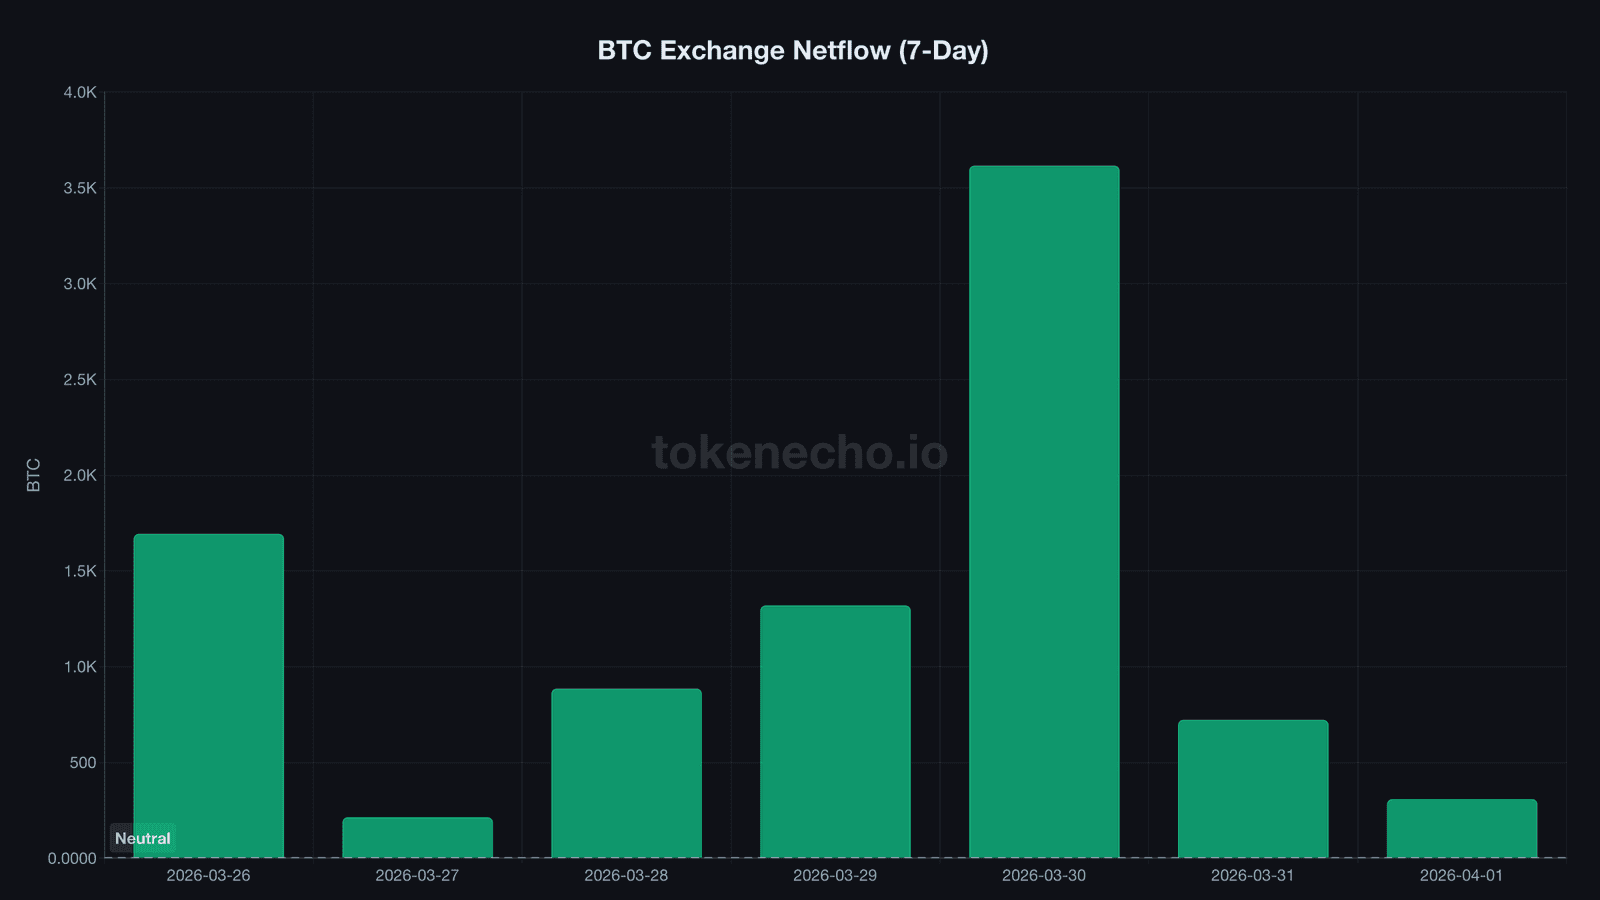
The bounce looks encouraging until you check exchange flows.
Since March 29, a net 4,645 BTC have flowed into exchanges – that’s deposits exceeding withdrawals across all platforms. March 30 alone saw 30,478 BTC hit exchange wallets against just 26,862 leaving. That’s a net positive of 3,615 BTC in a single day.
For context, that March 30 inflow spike was the largest daily net deposit since March 22, when the capitulation wave started.
So who’s depositing? The CDD spike and LTH-SOPR recovery suggest long-term holders moved significant positions. But the mean inflow size dropped from 1.21 BTC on March 30 to 0.82 BTC on March 31 – consistent with smaller holders panic-selling into strength rather than whale-sized liquidations.
“When price bounces but exchange inflows accelerate, that’s distribution,” said Ki Young Ju, CEO of CryptoQuant. “Smart money sells rallies in bear trends.”
The Leverage Flush That Actually Worked
One genuinely bullish signal buried in the noise: the derivatives market is cleaning itself up.
Estimated leverage ratio peaked at 0.240 on March 27 and has since dropped to 0.223 – a 7% decline in four days. That’s the kind of deleveraging that builds a healthier base for the next move. Less leverage means less liquidation risk, which means less forced selling on the next dip.
Compare that to the week of March 25-27, when leverage climbed 12% while SOPR stayed sub-1.0. Traders were doubling down on losing positions. Reckless. Now they’re unwinding.

NUPL Bounces Off the Edge
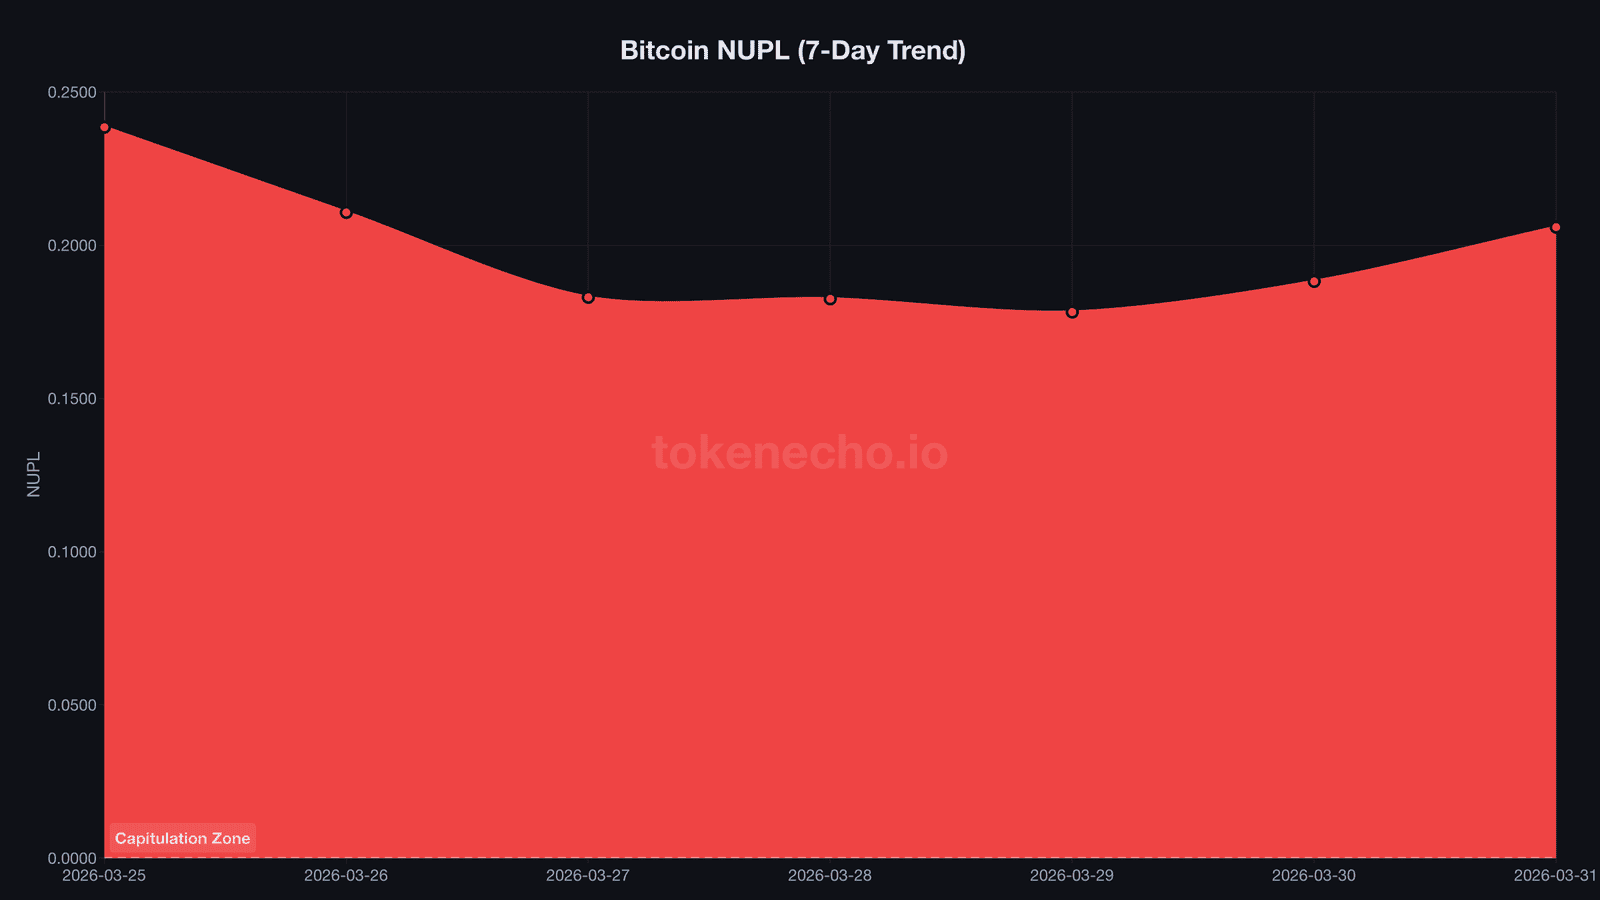
Net Unrealized Profit/Loss recovered to 0.206 from 0.178 – the lowest reading since the FTX implosion. Capitulation territory starts around 0.0.
The recovery is modest. BTC went from “staring into the abyss” to “one step back from the ledge.” Hardly confidence-inspiring, but the direction matters more than the level right now. NUPL had been falling for six weeks straight. This is the first meaningful uptick.
MVRV sits at 1.259 against a realized price of $54,174. That’s a 27% premium over the network’s aggregate cost basis – enough that a further correction wouldn’t shock anyone, but low enough that we’re nowhere near overheated territory.
ETFs Aren’t Helping
Spot Bitcoin ETFs shed 4,177 BTC between March 25 and March 30, bringing total holdings down to 1,317,304 BTC. That’s not catastrophic – the daily pace of outflows has slowed compared to the $1.8 billion weekly hemorrhage in mid-March.
But it’s not accumulation either. Institutional buyers are sitting on their hands while retail panics.
Puell Multiple dropped to 0.647, its lowest since mid-2023. Miners are earning 35% below their historical daily average. Some of them, as we covered in our BTC price prediction outlook, are selling reserves to cover operational costs. That adds persistent sell pressure regardless of what the broader market does.
Where Bitcoin Price Goes From Here
Support: $66,038 (today’s 24h low and multi-day floor), $64,000 (March structural support).
Resistance: $69,136 (today’s 24h high), $70,000 (psychological), $72,000 (late-March rejection zone).
The 2.5% bounce is real – leverage is unwinding, NUPL stopped falling, and SOPR is one good day away from flipping positive. But exchange inflows of 4,645 BTC in three days tell you that plenty of holders are using this bounce as an exit.
If SOPR crosses above 1.0 and exchange netflow flips negative in the same session, that’s the confirmation signal. Until then, this rally remains guilty until proven innocent.
This is not financial advice. DYOR. Data as of April 1, 2026.
This analysis is part of our daily Bitcoin price tracking. See all previous analyses and key metrics on our hub page.
Sources
- CoinGecko API – bitcoin market data (real-time)
- CryptoQuant API – SOPR, MVRV, NUPL, exchange flows, leverage ratio, Puell Multiple, CDD
Leave a Reply