
🕑 5 min read
Five red months. Then silence. Now the on-chain data is screaming.
Bitcoin closed March at $66,878 – barely a 1.8% gain, the kind of candle you’d normally scroll past. But context changes everything. That tiny green bar snapped the longest monthly losing streak since the 2022 bear market, and it arrived at the exact moment seven on-chain bottom signals fired simultaneously for the first time since the FTX collapse.
BTC trades at $68,448 as of Tuesday morning, up 2% in the past 24 hours but still 45.7% below its $126,080 all-time high. The broader market sits at $2.43 trillion with Bitcoin commanding 56.3% dominance.
None of those numbers are impressive on their own. What caught our attention is what’s happening underneath.
Seven Bottom Signals Fired at Once
We’ve been watching these metrics individually for weeks. Seeing all seven flip within the same window hasn’t happened since November 2022.
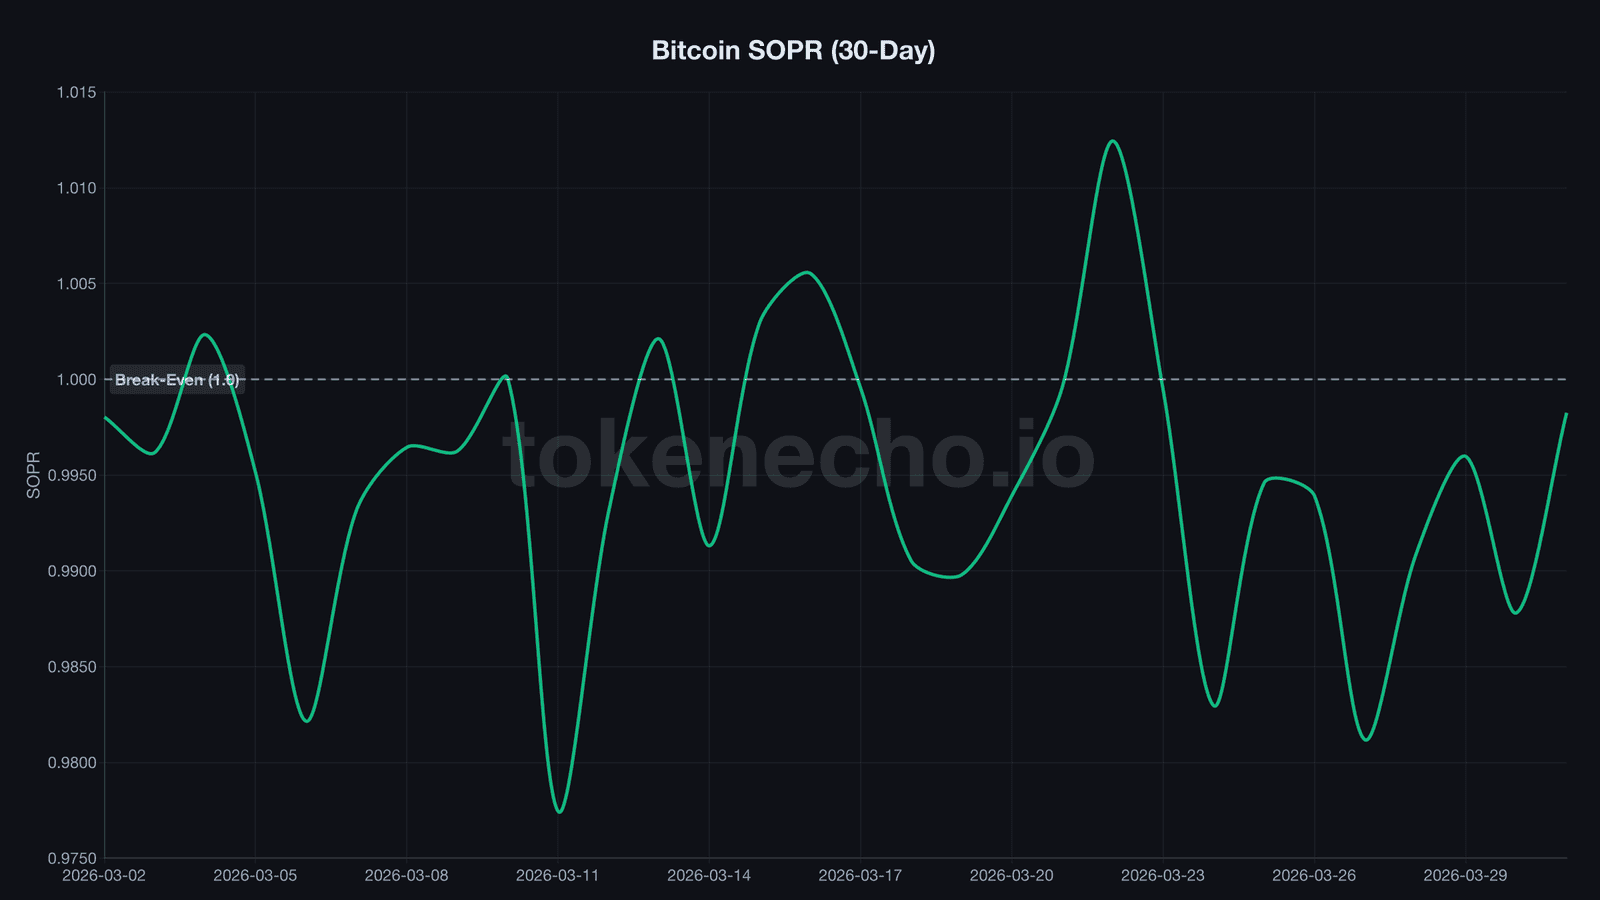
1. SOPR crawls to 0.998 – sellers are running out of coins to dump at a loss.
SOPR, the Spent Output Profit Ratio, measures whether people are selling Bitcoin at a profit or loss. Below 1.0 means the average seller is locking in losses. It’s been sitting under that threshold for 10 consecutive days – the longest streak since mid-March. But on March 31, it clawed to 0.998. That’s almost break-even. When SOPR crosses 1.0 from below after extended time underwater, it historically marks a local bottom. The sellers who wanted out are already gone.
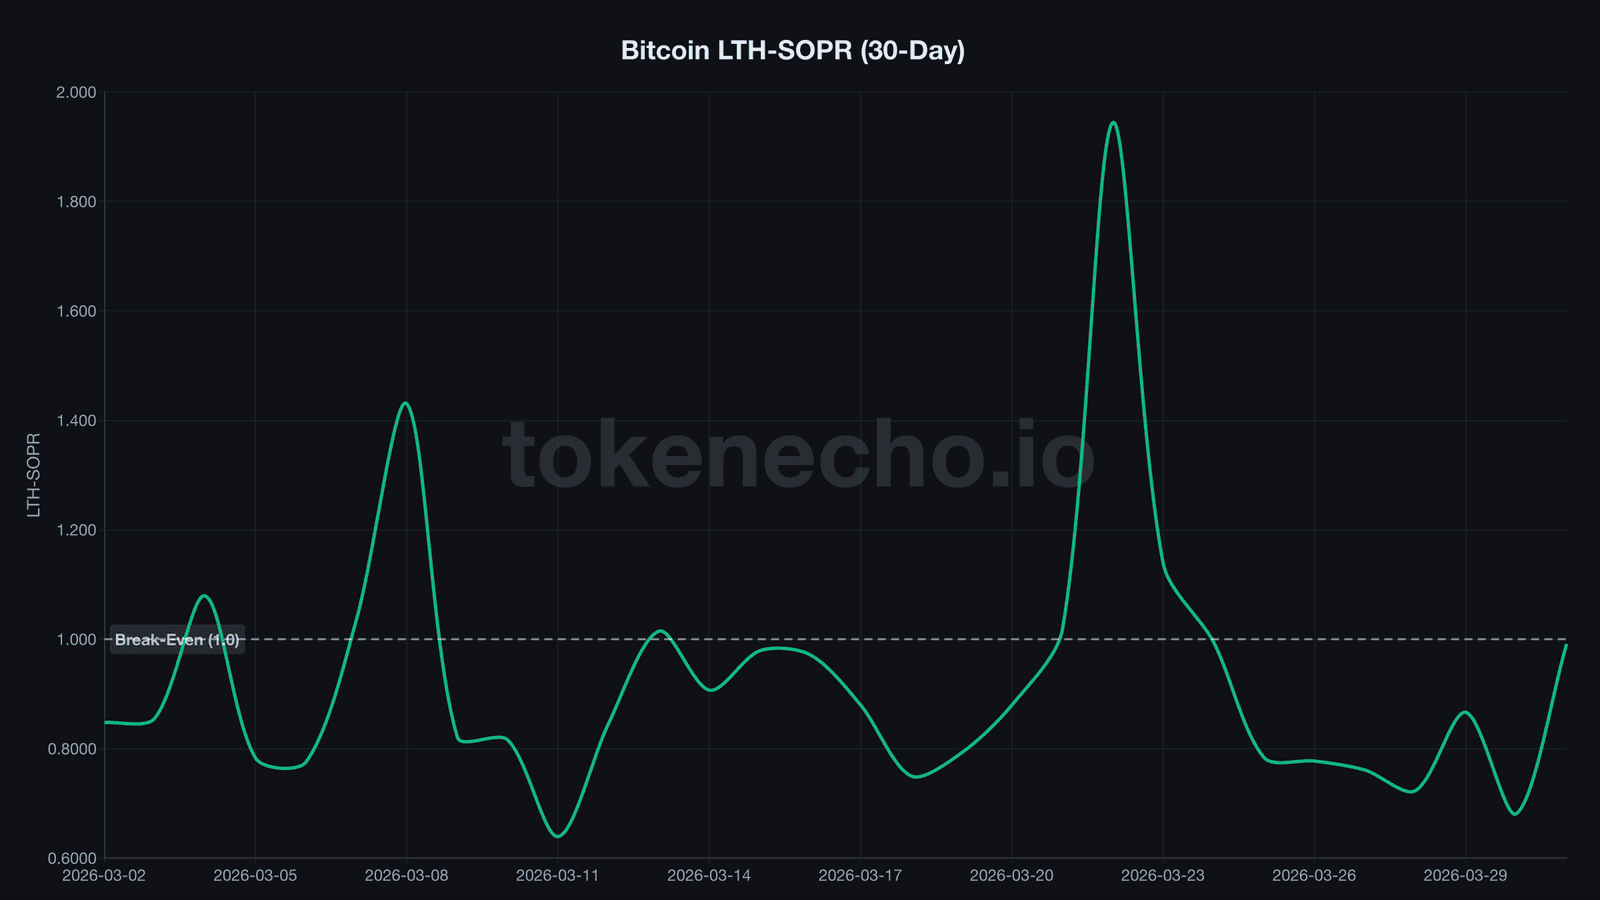
2. LTH-SOPR whipsawed from 0.681 to 0.991 in four days.
This is the jaw-dropper. Long-term holders – wallets that haven’t moved coins in 155+ days – were selling at a 32% average loss on March 30. That 0.681 reading was the cycle’s absolute low, worse than any single day during the Luna crash. By March 31, LTH-SOPR rocketed to 0.991.
What happened? The weakest long-term hands – those who bought near the $126K top and held through five months of pain – finally capitulated. And once they did, the remaining LTH cohort is far stronger. They’re not selling at these prices.
“We are probably closer to the bottom than the top,” said André Dragosch, Head of European Research at Bitwise, noting that sentiment has reached FTX-era capitulation levels.
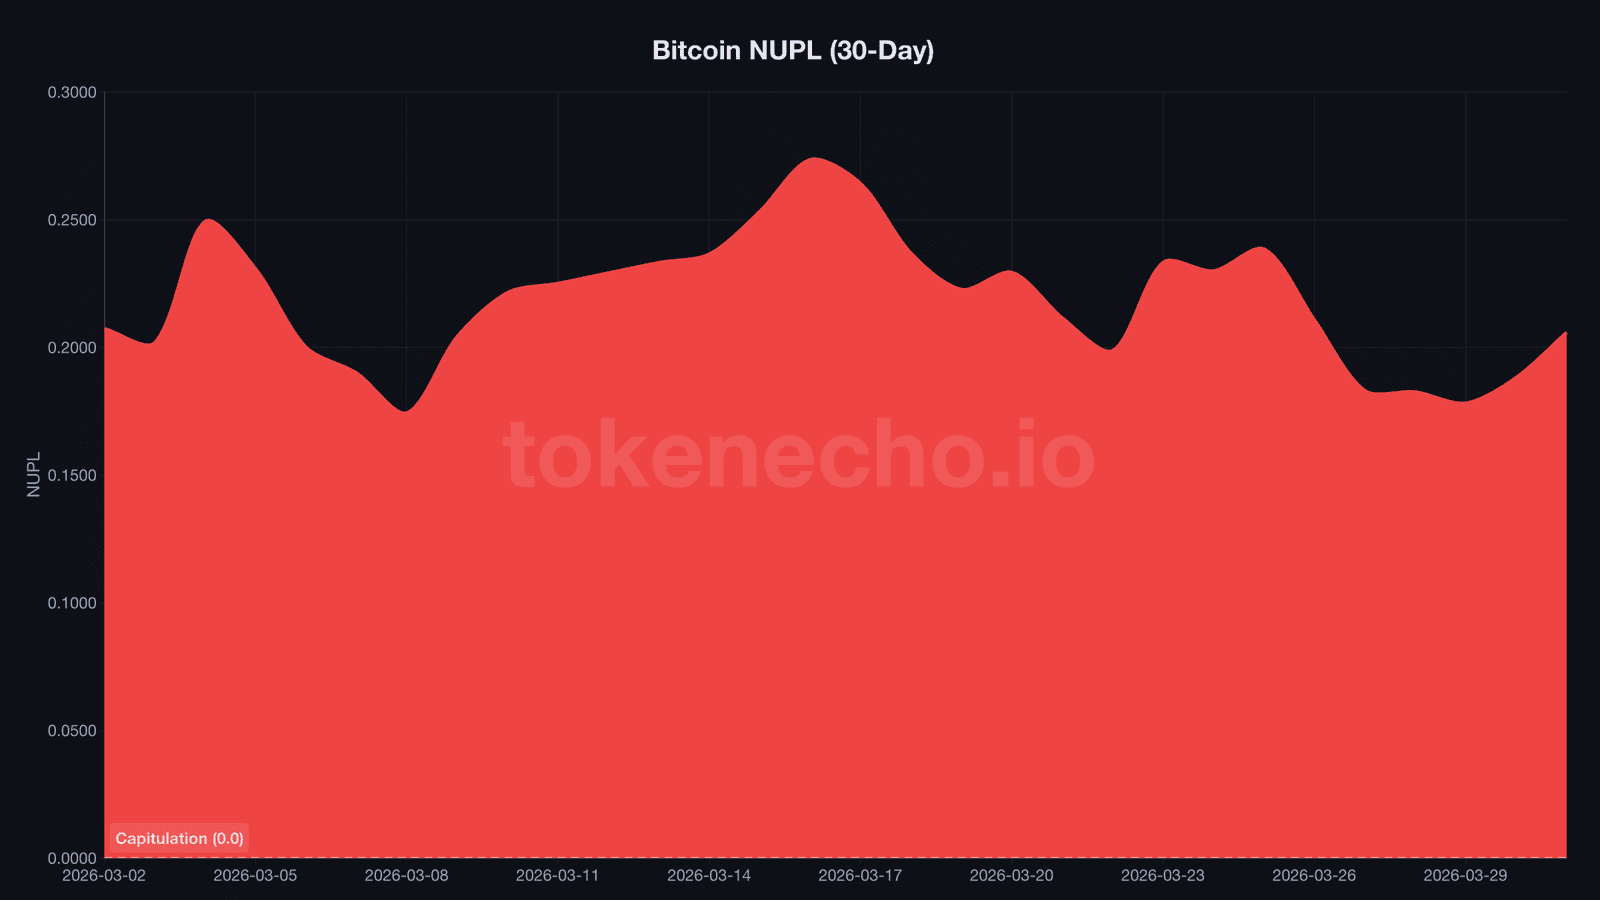
3. NUPL recovers from the edge.
Net Unrealized Profit/Loss, a gauge of how much of the network sits in profit versus loss, dipped to 0.178 on March 29 – the closest reading to outright capitulation (0.0) since the FTX implosion. Two days later it’s 0.206 and climbing. Not out of danger, but the trajectory flipped.
4. Puell Multiple hits 0.645 – miners are producing at a loss.
The Puell Multiple, a ratio comparing daily miner revenue to its yearly average, dropped to 0.645. Below 0.5 is the classic “buy” zone, and 0.645 is uncomfortably close. Bitcoin miners are essentially losing money on every coin produced right now. But – and this is the interesting part – miner reserves actually increased by 162 BTC over the past week to 1,804,909 BTC ($128.3 billion). They’re hoarding, not panic-selling. Miners who survived the 2022 bear remember what comes after these levels.
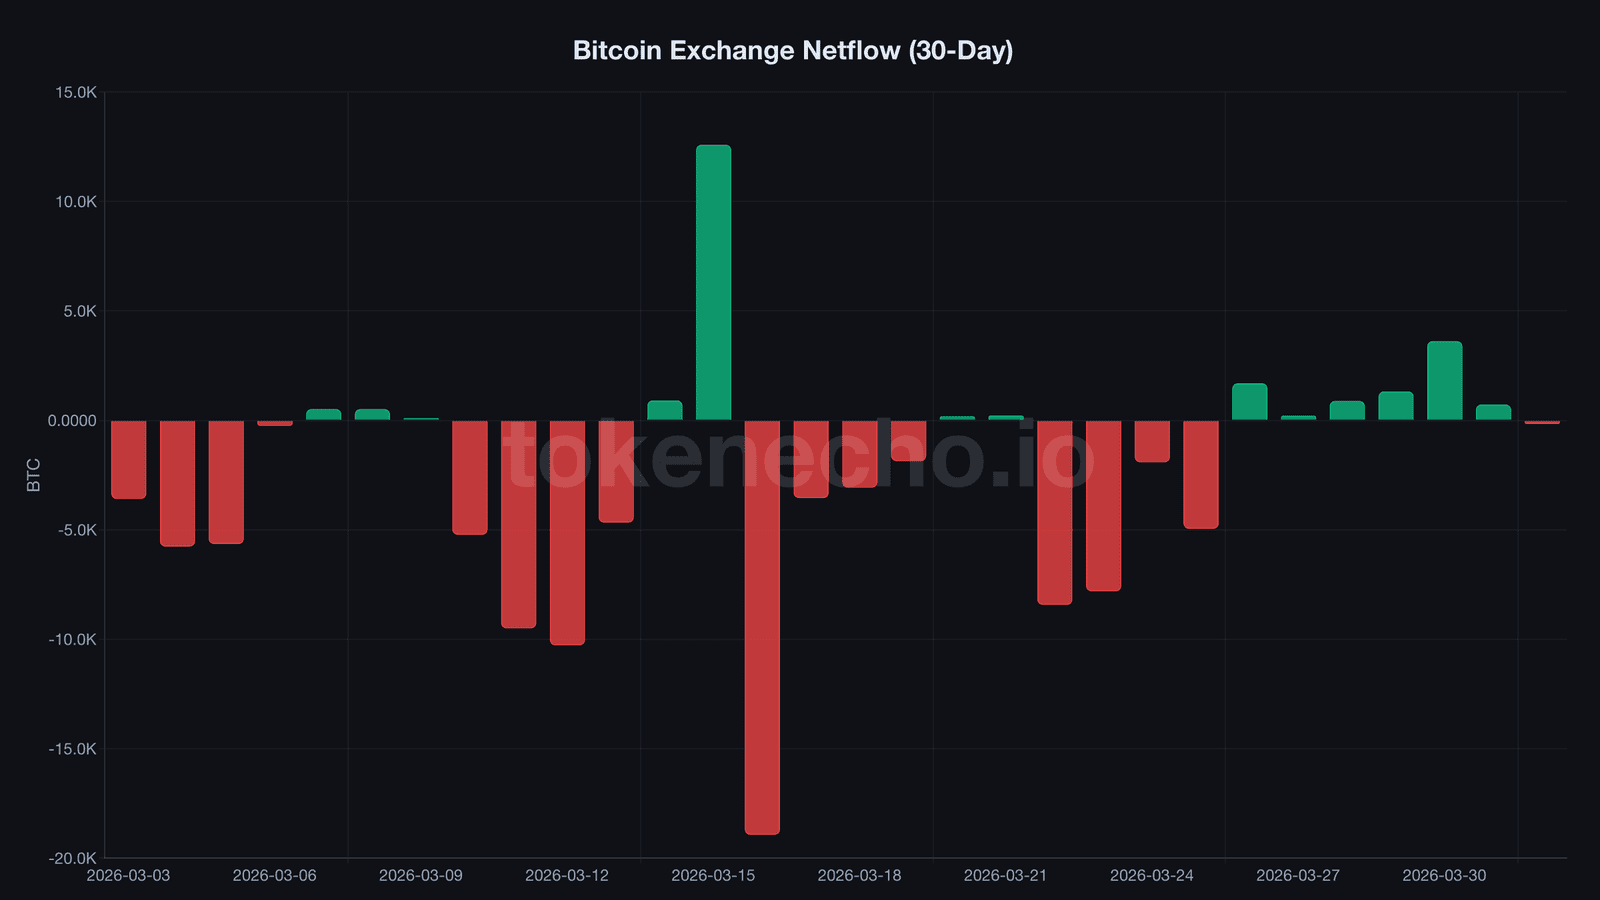
5. Exchange netflow just flipped negative.
After six consecutive days of positive netflow – meaning more BTC flowing INTO exchanges than out (a bearish signal totaling +8,448 BTC) – the tide turned on April 1. Exchange netflow registered -166 BTC. It’s a small number. But direction changes matter more than magnitude, especially when they coincide with everything else on this list.
6. Leverage ratio dropped from 0.240 to 0.223.
The estimated leverage ratio peaked at 0.240 on March 27 and has since declined to 0.223 – a 7% drop in five days. That’s a healthy flush of speculative positioning. Overleveraged longs got liquidated, and the market reset. Lower leverage means the next move up – if it comes – will be built on spot buying rather than derivatives. That’s more sustainable.
7. CDD spiked to 23.9 million while SOPR stayed near 1.0 – redistribution, not panic.
Coin Days Destroyed, a metric tracking old coins moving, spiked to 23.9 million on March 31. Binary CDD flipped to 1. Old Bitcoin moved. But during the March 22 CDD spike (27.1 million), SOPR was at 0.98 – old coins were dumped at a loss. This time, SOPR sat at 0.998. Old coins changed hands near break-even.
That’s textbook redistribution. Weak hands pass coins to strong hands at fair prices. It’s the mechanism that builds bottoms.
The $136B Stablecoin Powder Keg
The Stablecoin Supply Ratio, which divides Bitcoin’s market cap by the total stablecoin supply, jumped from 9.68 to 10.07. That still implies roughly $136 billion in stablecoins parked on exchanges – dry powder that hasn’t deployed into BTC yet.
For context: when SSR bottomed at 9.68 on March 29, it marked the most buying power relative to Bitcoin’s market cap since late 2022. The stablecoin market is already reshuffling – USDC bleeding $1.4 billion in 10 days while Trump’s USD1 gained $1.1 billion – but the aggregate capital hasn’t left. It’s waiting.
April historically favors Bitcoin. Since 2013, average April returns hover around 12.1%, making it one of the two strongest calendar months for BTC. Obviously, past performance isn’t a guarantee. But when you combine seasonal tailwinds with the kind of on-chain setup that hasn’t existed since FTX – the confluence deserves attention.
ETF holdings tell a more nuanced story. Spot Bitcoin ETFs shed 4,259 BTC over the past week, bringing total holdings to 1,317,221 BTC. Institutional sellers haven’t finished yet. But on-chain analyst Ali Martinez flagged that Bitcoin’s 50/200 SMA crossover “has marked the absolute bottom of every major cycle since 2014” – and we’re roughly 30 days into the current signal.
Who’s right – the ETF sellers or the on-chain accumulators? Our Bitcoin price forecast lays out three scenarios for this exact divergence.
The losing streak broke. Seven signals fired. $136 billion in stablecoins sit ready. None of this guarantees a rally – if you’d told FTX victims in November 2022 that “every signal says buy,” they’d have laughed. But the data doesn’t lie. It just doesn’t care about your feelings.
This is not financial advice. DYOR. Data as of April 1, 2026.
Sources:
Leave a Reply