
🕑 5 min read
Bitcoin trades at $68,767 but the network’s aggregate cost basis sits at $54,174 – a shrinking gap that’s defined every major cycle bottom.
Sixty-eight thousand dollars sounds comfortable for Bitcoin.
It isn’t.
Strip away the headline price and look at what the network actually paid for its coins – a metric called realized price, the aggregate cost basis of every BTC on the blockchain – and the picture flips. The average Bitcoin holder is sitting on just $14,593 in profit per coin. That’s a 27% margin above the $54,174 realized price.
Eight months ago, that margin was 142%.
From 142% Profit to 27% – The Vanishing Safety Net
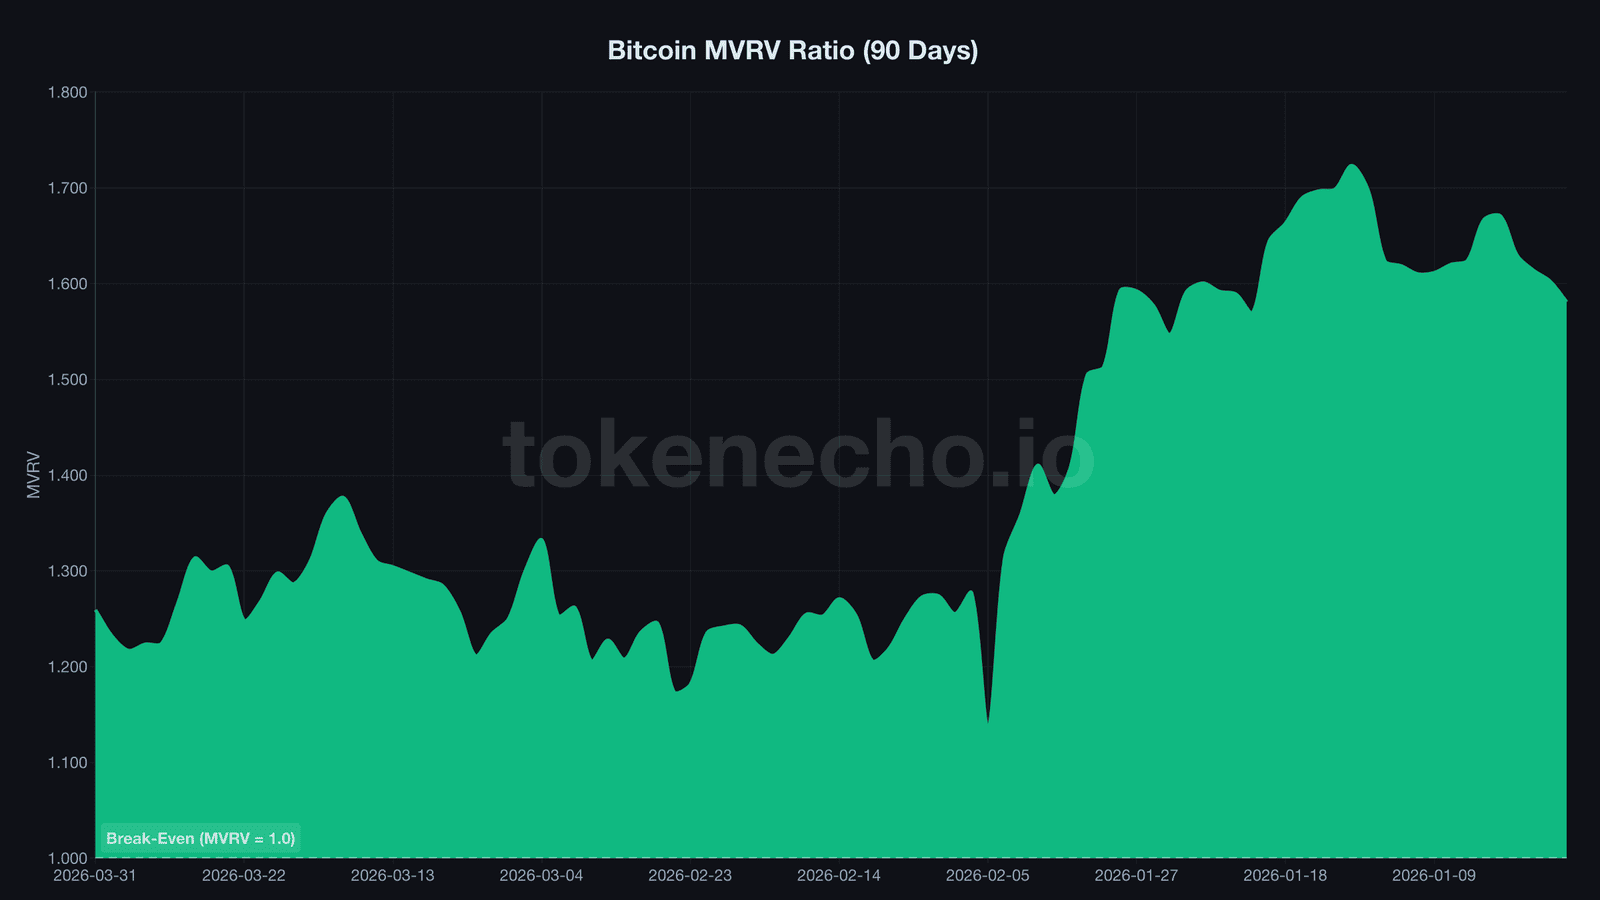
MVRV, the ratio of Bitcoin’s market price to its realized price, peaked at 2.42 on May 22, 2025. BTC was hovering around $104,000, and the network was fat with unrealized profit. Comfortable. Euphoric, even.
Then came the grind.
By December, MVRV had slipped to 1.55. Nobody panicked – the network still held 55% in unrealized gains. January dragged it to 1.50, and the mood shifted from complacency to caution. Then February 5 hit. MVRV cratered to 1.135 – the average holder had just 13.5% profit left, with BTC clinging to $62,854.
For context, the only times MVRV has dipped below 1.0 in Bitcoin’s history – meaning the entire network sits underwater – marked absolute cycle bottoms: March 2020, November 2022. February 5 came dangerously close.
MVRV has since recovered to roughly 1.27 as BTC bounced above $68,000. But the realized price itself tells a darker story. It’s declining – from $54,212 on March 29 to $54,174 by March 31. Might look like decimal noise. It’s not. A falling realized price means holders are actively selling coins at a loss, dragging down the network’s collective cost basis.
Capital is being destroyed. Slowly, quietly, and continuously. And the question becomes: who exactly is doing the selling – and have they run out of coins to dump?
21 Days of Veteran Capitulation – Then a One-Day Reversal
The damage wasn’t distributed evenly.
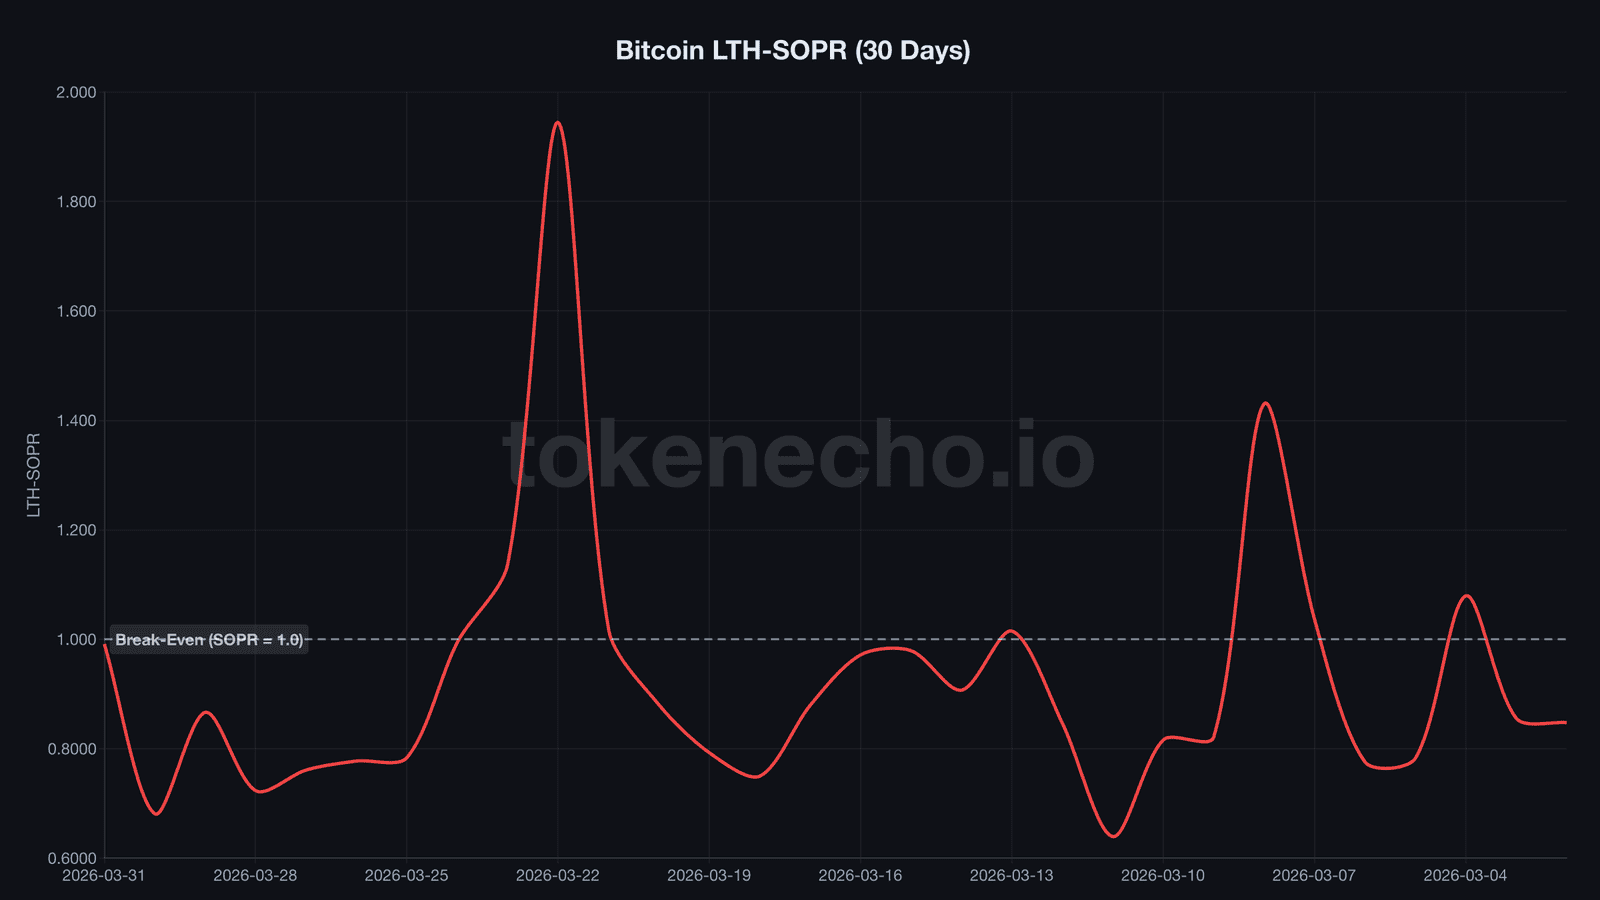
The SOPR ratio, which compares how much long-term holders are losing relative to short-term holders, dropped below 0.85 on 21 separate days over the past year. Every single one of those 21 days landed in February and March 2026.
For eleven straight months before that, long-term holders were consistently more profitable than newcomers. Then the relationship inverted – and stayed inverted for weeks.
On March 30, LTH-SOPR hit 0.681. Long-term holders – wallets that held BTC for 155+ days – were selling at a 32% loss per coin. These aren’t degens who aped in at the top. These are wallets that survived FTX, Luna, and COVID.
And then, in 24 hours, LTH-SOPR whipsawed from 0.681 to 0.991.
One day. From 32% loss to near break-even. The weak hands among long-term holders flushed out in a single session, and what remained by March 31 were sellers sitting close to their cost basis. The distressed sellers? Gone.
“Bitcoin is not pumpable at this point,” CryptoQuant CEO Ki Young Ju said in a late-March post. But we’ve tracked MVRV and SOPR across three full cycles now. This kind of sustained LTH capitulation cluster doesn’t show up in sideways markets – only at inflection points. Selling exhaustion has historically been the setup for the pump, not the evidence against it.
So the sellers are flushing out. But a vacuum isn’t bullish on its own – someone has to fill it. The question shifts from “who’s still selling” to “who’s got the capital to buy.”
$136B in Stablecoins and a Deleveraging Market
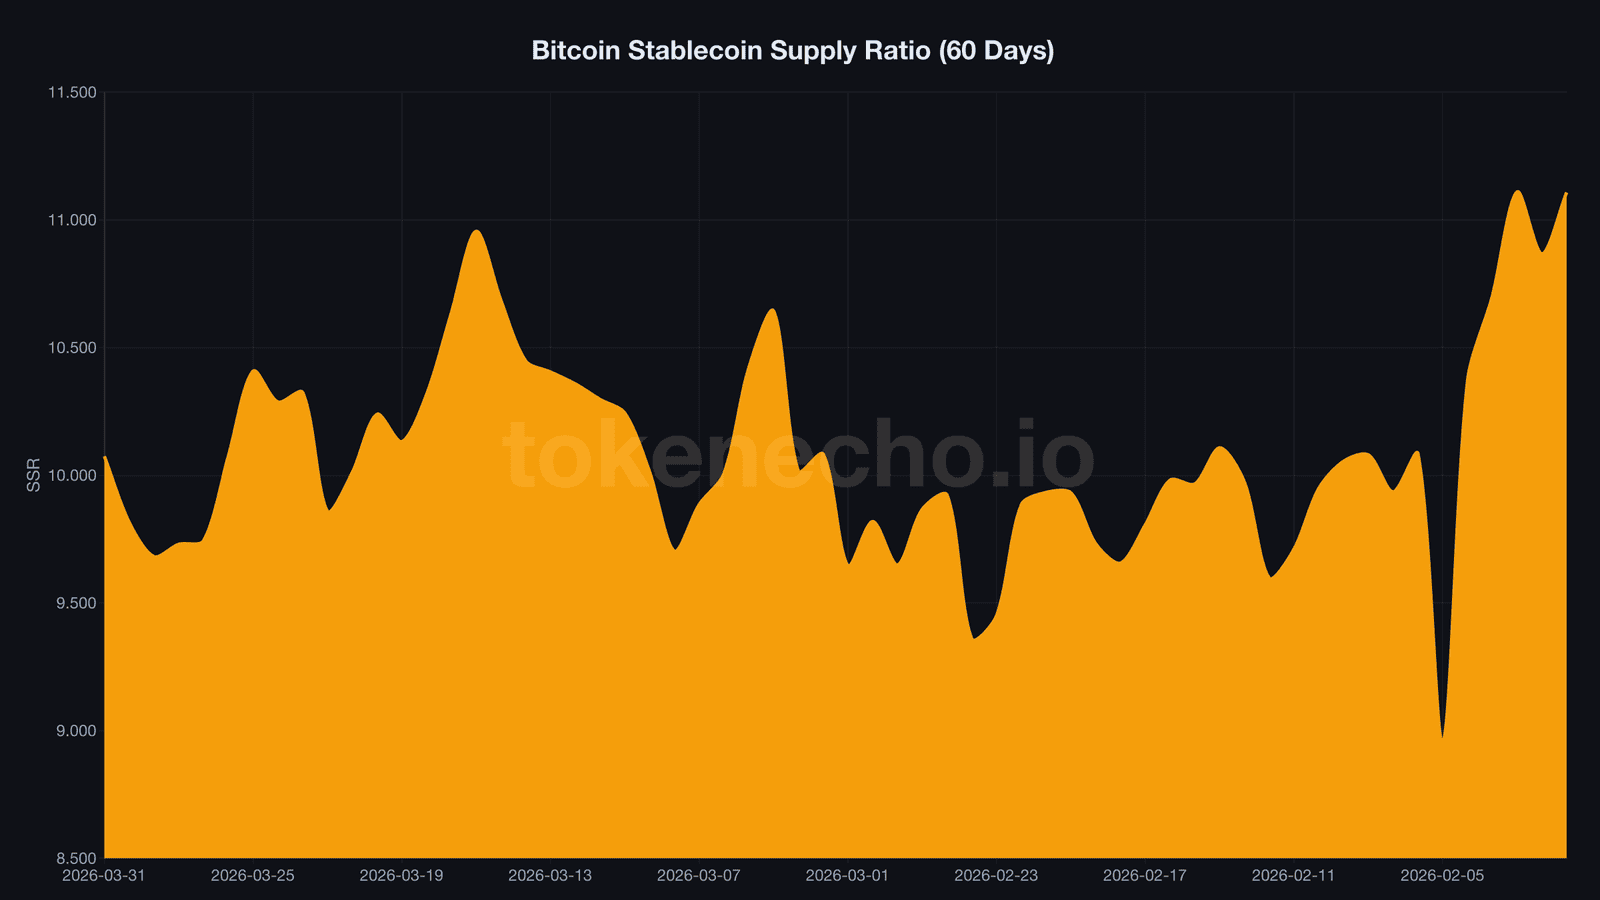
While holders bled profit, stablecoins kept piling up.
The Stablecoin Supply Ratio dropped to 9.74, meaning roughly $136 billion in stablecoin buying power sits idle relative to Bitcoin’s market cap. Think of it as a parking lot packed with cars, engines idling. The capital exists. It’s liquid. It just hasn’t pulled onto the highway.
Leverage, meanwhile, cooled off. The estimated leverage ratio across all exchanges climbed from 0.213 to 0.240 in late March – exactly the kind of buildup that precedes liquidation cascades – but pulled back to 0.223 by April 1. Traders voluntarily unwound positions. That’s a healthier foundation for any rally than a forced liquidation flush.
Two of the three ingredients for a sustainable move – liquid capital and reduced leverage – are in place. The third is conviction from the participants who actually produce Bitcoin.
Miners are providing it. Despite a Puell Multiple of 0.72 – signaling revenue well below the 365-day average – miner reserves ticked up to 1,804,909 BTC. Why sell into weakness when you can stockpile and wait?
None of this is unprecedented. The same cocktail – thin profit margins, idle stablecoins, exhausted sellers, miners hoarding – has appeared before. And the outcomes carry a pattern worth examining.
The MVRV 1.0-1.3 Zone – Where Rallies Keep Starting
Warren Buffett never bought Bitcoin. But his framework maps perfectly onto on-chain valuation.
“Price is what you pay, value is what you get.” In Bitcoin’s world, realized price IS the book value – the price the network collectively paid for every coin. When MVRV sits between 1.0 and 1.3, the market trades at a thin premium to its own cost basis. Downside from these levels has historically been limited because buyers are acquiring BTC near what everyone else paid.
So what happened the last time MVRV lingered in this zone?
After FTX collapsed and pushed MVRV into the 1.0-1.3 range in late 2022, BTC traded around $20,000. Within 15 months, it hit $73,000. That’s a 3.3x return – the “tripled” in our headline, and it’s actually conservative.
After COVID crashed MVRV below 1.0 in March 2020, BTC sat at $5,000. It eventually reached $64,000. Over 12x.
The pattern isn’t guaranteed – nothing in markets ever is. But we’ve watched this zone produce rallies three cycles running, and the current setup carries more dry powder than either previous instance. At 1.27, Bitcoin sits squarely in that zone for the 46th time in the last 90 days. That’s the longest sustained compression since the metric gained mainstream adoption among institutional desks.
Whether this compression resolves up or down hinges on what the $136 billion in stablecoin capital decides to do – and whether the seven bottom signals that just aligned can hold through Q2.
This analysis is part of our daily Bitcoin price tracking. See all previous analyses and key metrics on our hub page.
The $14,000 margin keeps thinning. What arrives first – the stablecoin flood or a break below realized price – determines whether Q2 rhymes with post-FTX recovery or slides into full capitulation.
This is not financial advice. DYOR. Data as of April 1, 2026.
Sources:
Leave a Reply