🕑 4 min read
Ethereum’s derivatives open interest now nearly matches all available ETH on exchanges – a setup that hasn’t ended quietly before.
Ethereum lost 4.27% in 24 hours. Derivatives traders responded by adding more leverage.
That single sentence captures today’s Ethereum price analysis better than any chart could. ETH dropped to $2,046.53 as of April 2, touching an intraday low of $2,042.49 – yet the estimated leverage ratio climbed to 0.957, meaning open interest on derivatives platforms now covers 96% of all ETH sitting on exchanges.
Two weeks ago, 0.78 was considered a record. We’re way past that.
Leverage Blows Past March Record, Nears Uncharted 1:1 Territory
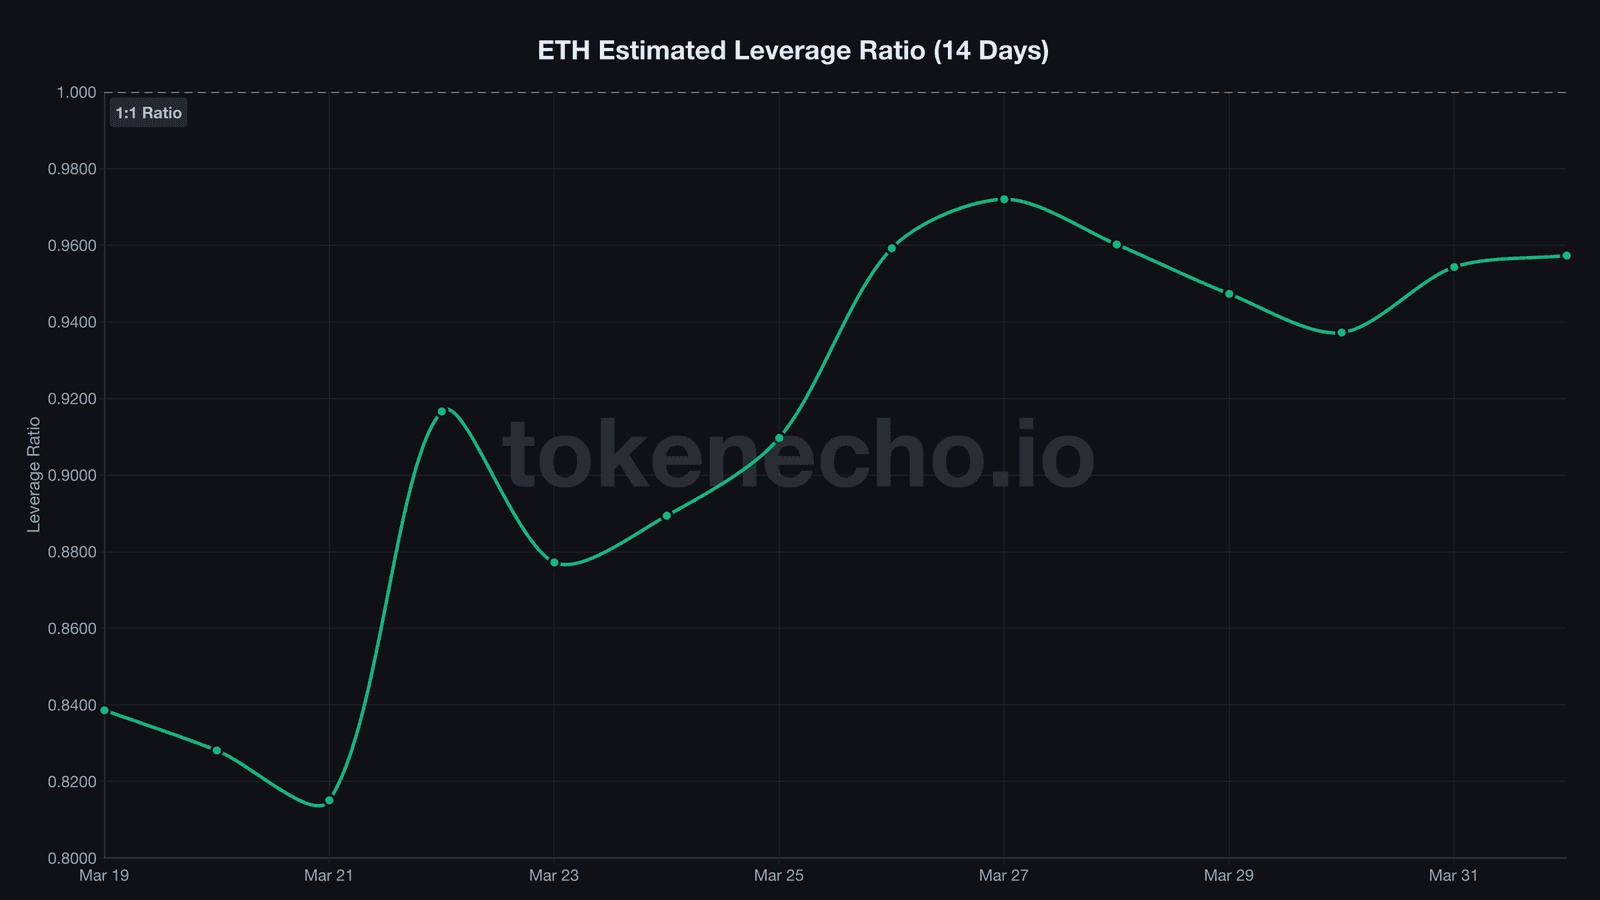
On March 19, FXStreet ran a headline calling ETH’s leverage ratio of 0.78 “a new record.” That number looks quaint now.
The ratio, a metric that divides total derivatives open interest by exchange reserves, surged from 0.839 on March 19 to a peak of 0.972 on March 27. It’s cooled slightly since – sitting at 0.957 on April 1 – but “cooling” from 0.972 to 0.957 is like saying a fever dropped from 104 to 103.5.
What caught our attention isn’t the absolute number. It’s the mechanics behind it. Exchange reserves keep shrinking (more on that below), which means the denominator in this equation gets smaller every day. Open interest doesn’t need to grow for the ratio to climb. Supply just needs to keep draining.
And it is.
At 0.957, for every ETH available on exchanges, there’s nearly one ETH worth of leveraged bets riding on its price. That’s running a restaurant where dinner reservations almost match the number of chairs – one full house turns orderly service into a stampede for the exits.
Traders watching derivatives markets will note that leverage ratios above 0.90 have historically preceded violent moves in both directions. The direction depends on what triggers the unwind.
Exchange Reserves Hit Monthly Low – 1M ETH Gone in Two Weeks
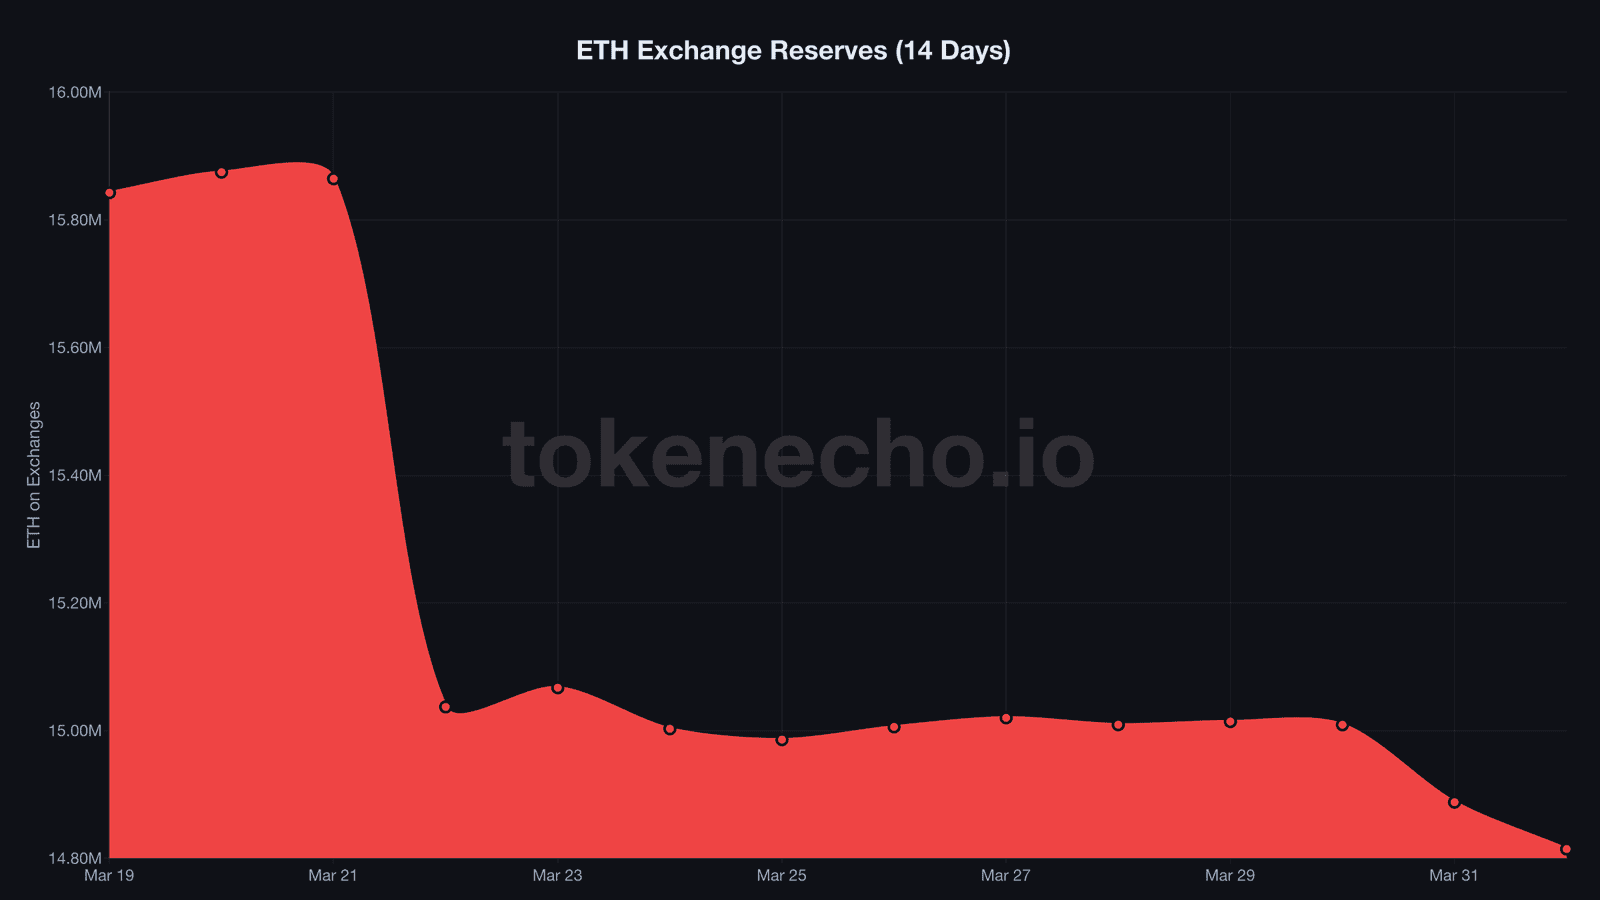
14,814,248 ETH. That’s all the supply sitting on exchanges as of April 1 – a fresh monthly low.
Rewind to March 19: reserves stood at 15,842,284 ETH. In just 13 days, 1,028,036 ETH vanished from exchange wallets. At current prices, that’s roughly $2.1 billion worth of Ethereum pulled into cold storage, staking contracts, or DeFi protocols.
The exodus wasn’t gradual. March 22 saw a single-day drain of 827,000 ETH – likely institutional repositioning during the broader capitulation event that hammered both BTC and ETH. But the reserves never recovered. They’ve drifted lower ever since, shedding another 194,000 ETH in just the last three days of March and into April.
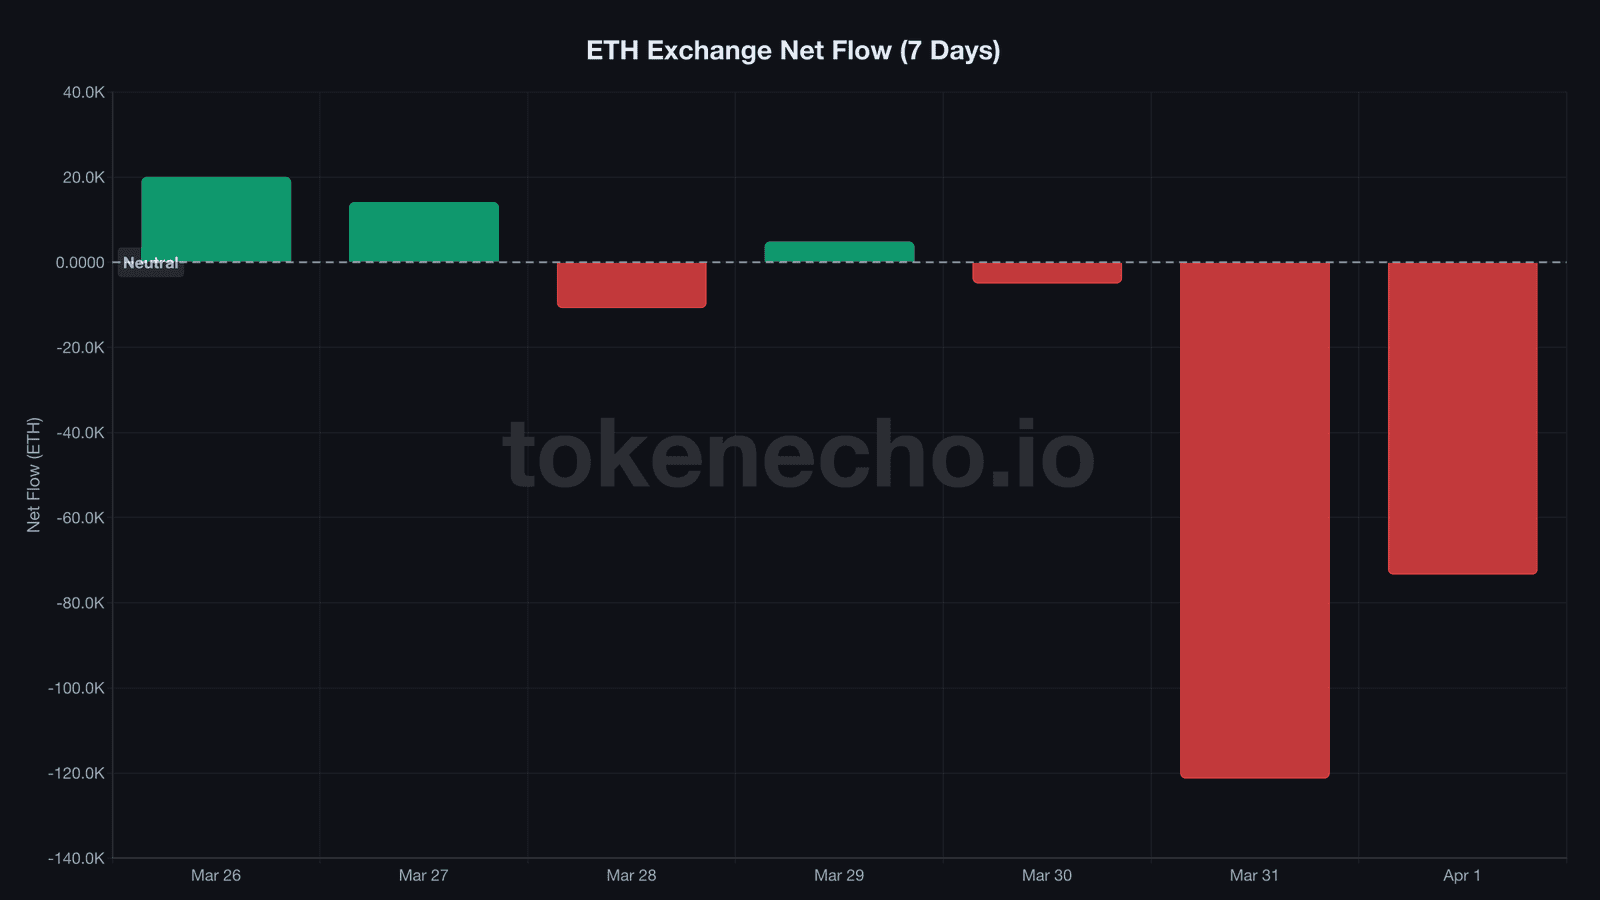
So who’s buying this dip? The weekly pattern tells a story. Outflows accelerated on March 31 (121,296 ETH net) and continued April 1 (73,375 ETH net). Weekend and holiday flows – when retail typically goes quiet – stayed heavily negative. That profile screams institutional or whale-sized accumulation, not panic selling.
“When we see whale wallets adding positions aggressively during extreme fear periods with negative funding rates, it historically creates a coiled-spring dynamic,” said Will Clemente, co-founder of Reflexivity Research. He compared current conditions to the setup before ETH’s 2023 rally.
Spring or not, the coil is tightening.
Where ETH Breaks From Here – $2,000 or $2,150?
Everyone loves calling bottoms. The data doesn’t cooperate that neatly.
ETH trades at $2,046.53, down 58.6% from its all-time high of $4,946.05 reached in August 2025. The ETH/BTC ratio sits at 0.0308 – marginally above the 0.0304 five-year low printed last week, but nothing to celebrate. Ethereum’s market cap of $247 billion puts it at roughly 18.6% of Bitcoin’s $1.33 trillion. For context, Netflix’s market cap hovers around $280 billion. Ethereum, the backbone of DeFi, NFTs, and a $12 billion tokenized Treasury market, is worth less than a streaming service.
The 7-day picture isn’t encouraging either: -3.57%. Over 14 days, -5.57%. Over 60 days, -15.06%. The one bright spot – a 2.55% gain over 30 days – reflects that brief Q2 opening bounce on April 1, which has already evaporated.
Immediate support rests at $2,042 (today’s intraday low) and the psychological $2,000 floor that’s held since late March. Below that, $1,850 marked the March lows. On the upside, $2,100 offers light resistance, with today’s high of $2,161 and the $2,400 zone as the next meaningful hurdles.
But we’ve tracked this divergence for two weeks now, and one pattern keeps repeating: spot buyers pull ETH off exchanges while leveraged positions pile on top of a shrinking base. Something has to give.
If exchange reserves continue declining while the leverage ratio pushes toward or above 1.0, even a modest catalyst – NFP data, CPI print, a Glamsterdam hard fork timeline update – could trigger cascading liquidations or a violent short squeeze. The spring compresses in both directions.
Until leverage unwinds meaningfully below 0.90 or reserves stabilize above 15 million ETH, this market sits on a hair trigger.
This analysis is part of our daily Ethereum price tracking. See all previous analyses and key metrics on our hub page.
Spot buyers keep pulling ETH off exchanges. Leveraged traders keep piling on bets. One side is wrong – and at 0.957 leverage-to-reserve, the reckoning won’t be gentle.
This is not financial advice. DYOR. Data as of April 2, 2026.
Sources:
- CoinGecko ETH data via API – real-time price, market cap, ATH, supply
- CryptoQuant ETH exchange reserves, leverage ratio, inflow/outflow via API
- ETH Estimated Leverage Ratio – CryptoQuant
- ETH Exchange Reserve – CryptoQuant
Leave a Reply