

🕑 4 min read
ETH exchange inflows collapsed from 1.13 million to 286,000 while leverage cools and 1.1 million coins drained from exchanges in a month.
286,488 ETH.
That’s all that flowed into exchanges on April 3 – down from 1.13 million just three days earlier. An Ethereum price analysis rarely starts with a number this stark, but a 75% collapse in exchange deposits doesn’t happen quietly.
It means the sellers are gone. Not on a coffee break. Gone.
Ethereum trades at $2,052 as of April 4, 2026, barely twitching – down 0.78% in 24 hours and still 58.5% below its August 2025 all-time high of $4,946. But beneath a price that looks comatose, something caught our attention this week. The pipeline that feeds sell pressure just dried up.
Exchange Deposits Crater 75% – Sellers Just Stopped Showing Up
On March 31, exchanges absorbed 1,133,365 ETH in a single day. That was the tail end of a selling wave building since mid-March, when Iran escalation fears and tariff fallout sent traders scrambling for exits.
Three days later? 286,488 ETH. That’s it.
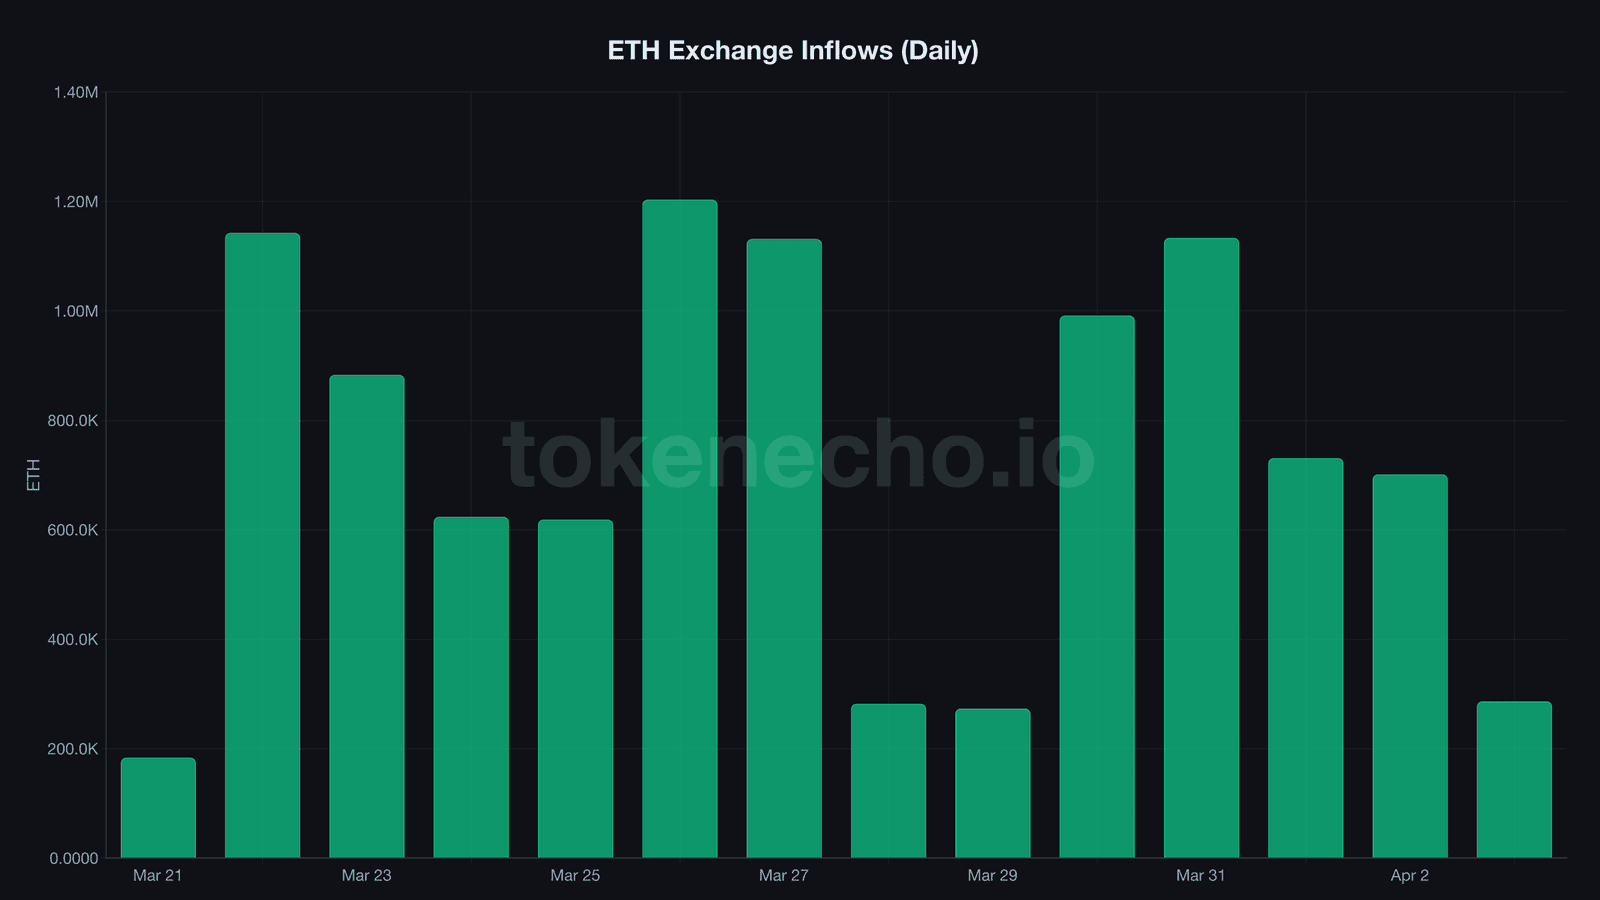
The outflow side kept pace. On 5 of the last 7 days, more ETH left exchanges than entered. April 3 posted a net outflow of 2,217 ETH – modest on its own, but it extended a streak that’s pulled 171,593 ETH off exchanges in the past week alone.
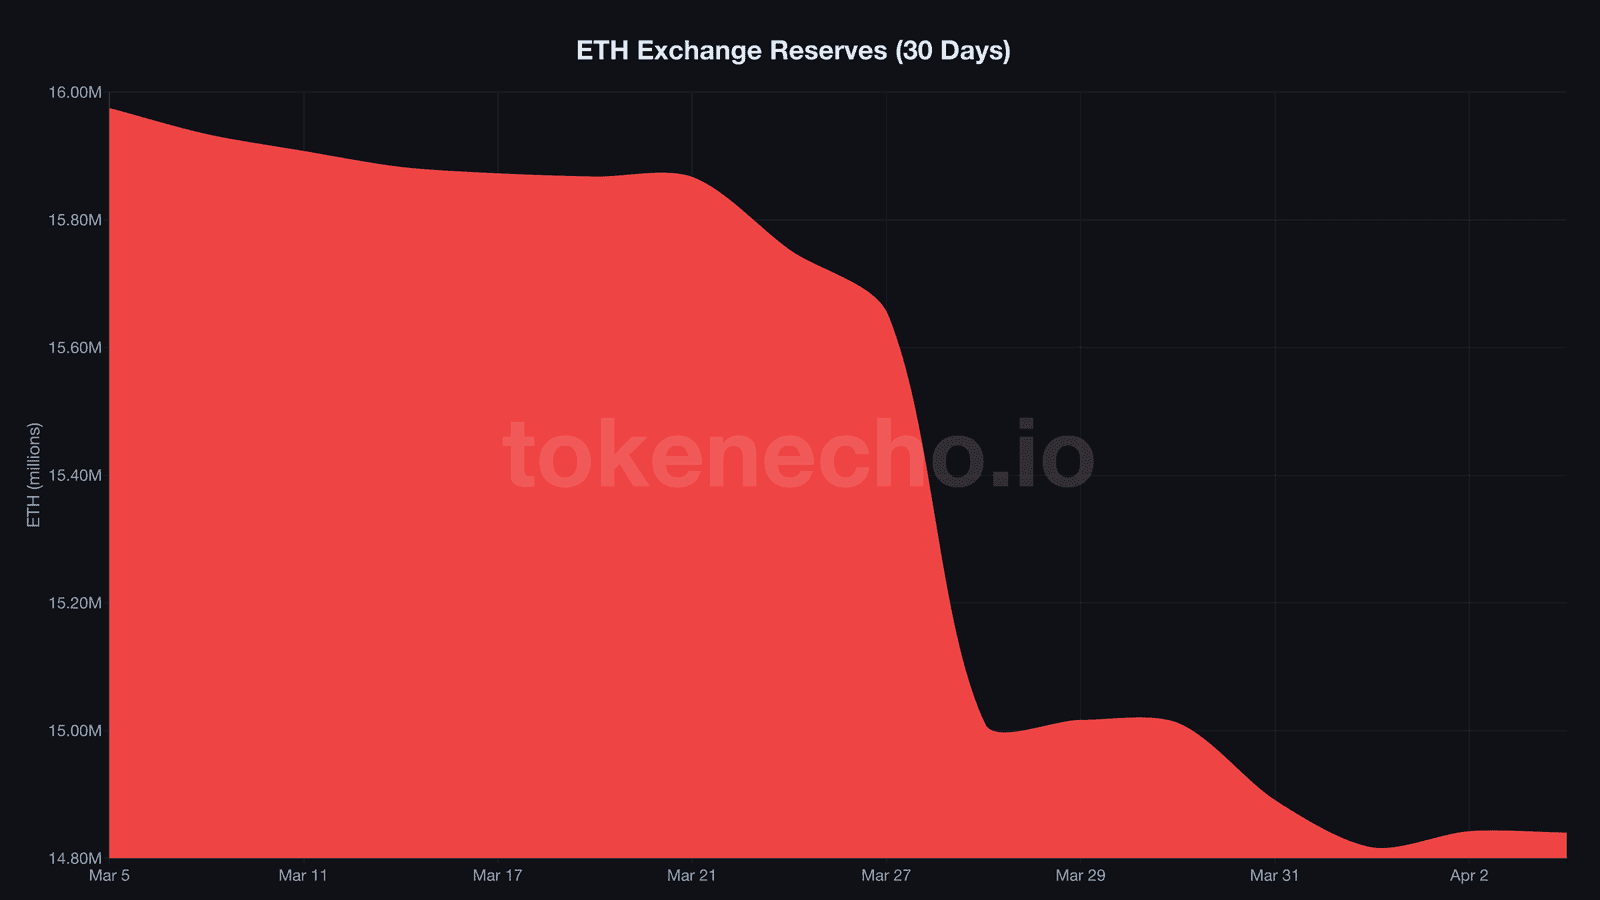
Zoom out and the picture sharpens. Exchange reserves sit at 14,837,430 ETH – down 1,134,802 from 30 days ago. That’s a 7.1% decline, or roughly $2.3 billion in ETH no longer available for spot selling on any exchange.
Accumulating wallets – addresses that have never recorded an outflow and hold at least 100 ETH – now control about 27 million coins, roughly 23% of total supply. The exit doors are emptying while the vaults keep filling.
Think of it like a highway during rush hour. For weeks, the on-ramp to exchanges was packed – over a million ETH per day flooding in. Then the on-ramp emptied. The off-ramp didn’t. Cars keep leaving, but almost nobody’s getting on.
Leverage Peaked and Cracked, Quietly
You’d expect leverage to spike when price compresses into a $25 range for days. Instead, it’s doing the opposite.
ETH’s estimated leverage ratio, a measure of open derivative positions relative to exchange reserves, peaked at 0.957 on April 1. That’s uncomfortably close to the kind of readings that precede liquidation cascades. By April 3, it dropped to 0.919.
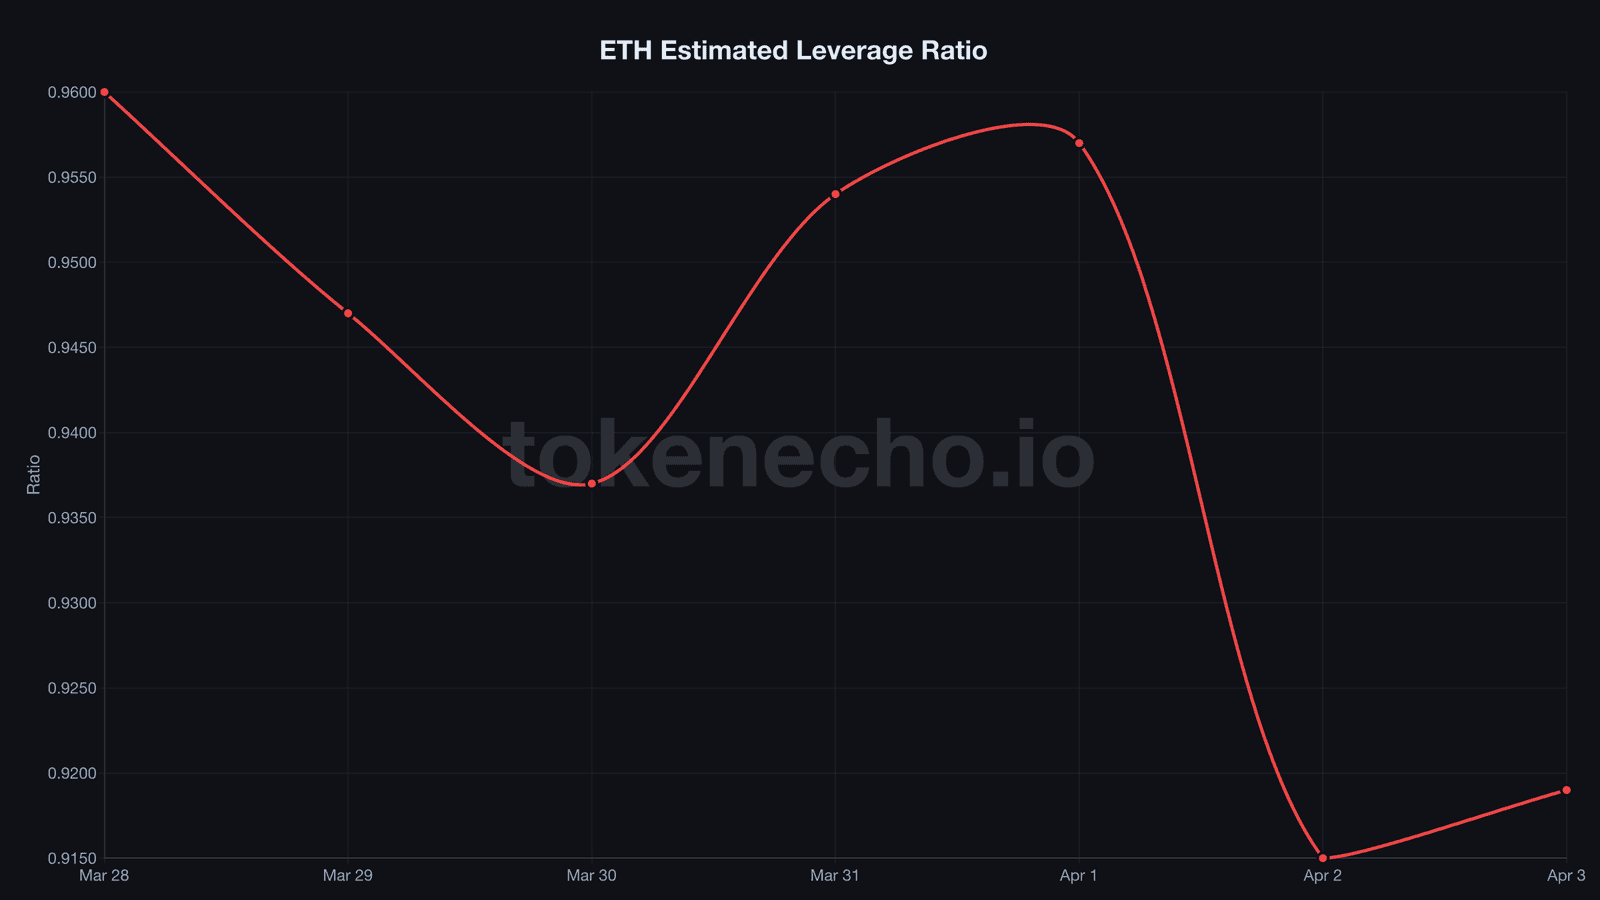
A 4% decline in two days doesn’t scream headline material. But leverage in crypto doesn’t unwind gently – it usually gets liquidated. The fact that it’s cooling without a price crash suggests traders are voluntarily closing positions, not getting blown out.
We’ve seen this pattern before. When leverage peaked near similar levels in early March, ETH dropped 12% within 48 hours. This time the ratio came down and price held $2,050.
Combined with the inflow collapse, it creates an unusual setup: spot selling pressure evaporating AND speculative positioning unwinding simultaneously. The market’s resetting itself without the usual fireworks.
There’s no single catalyst for this reset. More like the market simply ran out of things to panic about. The tariff noise faded. Iran stabilized. And the people who wanted to sell ETH between $1,800 and $2,100 already did – weeks ago.
ETH Sits on a Compressed Spring – Or a Trapdoor
So what breaks this stalemate?
The bull case writes itself: 1.1 million ETH drained from exchanges, sellers exhausted, leverage unwinding cleanly. If fresh demand enters – from BlackRock’s staked ETH fund ETHB, DeFi yield farming, or just a BTC rally dragging altcoins higher – reduced exchange supply could amplify any move up.
“ETH could outperform BTC in the near term as price aligns with stronger on-chain fundamentals,” said Luke Nolan, a research associate at CoinShares, pointing to the divergence between declining exchange reserves and flat price action.
But the contrarian signals are real. ETH/BTC sits at 0.0307 – deep in five-year-low territory. Ethereum’s market dominance hovers around 10%, a number that would’ve been unthinkable two years ago. And spot ETH ETFs have bled $2.76 billion over the past four months, according to CoinShares data.
This should be bullish. It isn’t – not yet.
Key levels: $2,044 held as intraday support on April 3, with $2,000 the psychological floor that’s survived multiple tests since March 29. On the upside, $2,070 and $2,100 have capped every relief rally this week. A break above $2,150 – the level that rejected the Q2 opening-day surge – would be the first sign buyers can push through meaningful resistance.
Traders watching this consolidation will note that falling exchange inflows combined with declining leverage has historically preceded directional moves – though direction depends entirely on the catalyst.
If inflows stay suppressed below 400,000 ETH per day while exchange reserves keep declining, the supply compression becomes difficult to ignore – especially with staking demand from ETHB and Lido absorbing newly withdrawn coins. But if ETH/BTC cracks below 0.030, the structural weakness in Ethereum’s relative position could override any supply-side tailwind.
This analysis is part of our daily Ethereum price tracking. See all previous analyses and key metrics on our hub page.
Sellers vanished. Leverage cooled. Reserves keep shrinking. But at 0.0307 on the BTC ratio, Ethereum’s relative weakness tells a different story than its supply data. Which signal wins defines Q2.
This is not financial advice. DYOR. Data as of April 4, 2026.
Leave a Reply