
🕑 8 min read
130 EH/s of Bitcoin hashrate vanished in two weeks.
That’s roughly the entire mining capacity of Kazakhstan – gone, in the time it takes most altcoin projects to ship a roadmap update. We’ve been tracking the Iran war’s impact on crypto markets since Operation Epic Fury launched on February 28, and while most coverage fixated on the short-term price whipsaw – BTC dropped 8.5% in an hour, then clawed back above pre-war levels within a week – the real story isn’t what happened in 36 days.
It’s what unfolds over the next 1,826.
Five structural forces are already reshaping the crypto market. Most won’t reverse when the bombs stop falling.
130 EH/s Gone – The Biggest Hashrate Shock Since China’s 2021 Ban
The last time Bitcoin’s hashrate dropped this fast was June 2021, when China banned crypto mining overnight. Back then, roughly 50% of global hashrate went dark. BTC crashed to $29,000.
Iran’s share was smaller – 6-8% of the network – but the speed caught everyone off guard. Global hashrate peaked at 1,083 EH/s on March 1, the day after the first strikes hit Tehran’s power grid.
By March 16, it had plummeted to 937 EH/s. That’s a 13.5% decline in barely two weeks, and the network’s first quarterly hashrate drop since 2020.
Bitcoin’s difficulty, the self-adjusting mechanism that keeps block times near ten minutes, responded with one of its sharpest downward adjustments in five years.
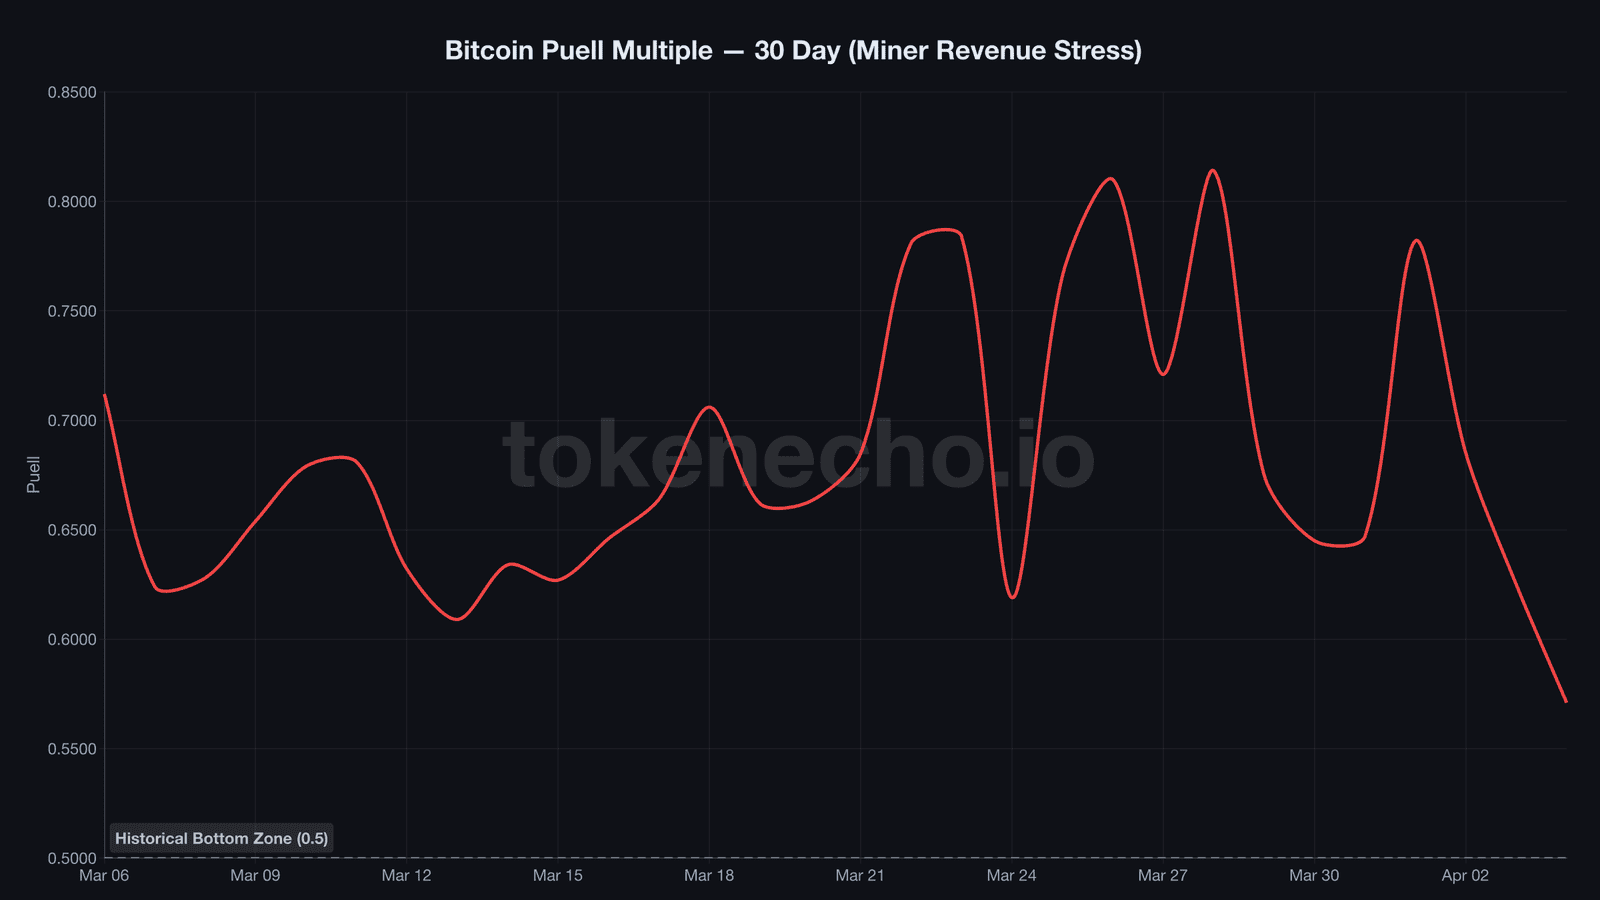
So where does that hashrate go? Not back to Iran anytime soon. US-based miners, already operating at compressed margins with the Puell Multiple, a ratio measuring daily miner revenue against the 365-day average, sitting at just 0.645, will absorb some capacity.
But the real winner might not be crypto at all. Tom’s Hardware reported in March that Iranian mining operators were already pivoting infrastructure toward AI compute before the strikes. War just accelerated the exit.
For context, the 2021 China ban triggered a 55% BTC crash followed by a 600% rally over the next 12 months – and hashrate recovered within five months, but from a completely different geography.
Iran’s Central Bank Bought $507M in USDT – And That Changes Everything
$507 million. That’s what Iran’s central bank quietly spent on Tether between April and May 2025, paid in Emirati dirhams through intermediaries.
Elliptic and CoinDesk broke the story in January 2026. The implications haven’t fully landed yet.
Iran isn’t using crypto as speculation. It’s using it as plumbing – a replacement for SWIFT access it lost years ago. Miners produce BTC at roughly $1,320 per coin thanks to $0.002/kWh state-subsidized electricity, route it through the central bank to overseas counterparties, and goods flow back into the country.
IRGC-linked addresses alone accounted for over $3 billion in inflows during Q4 2025.
What matters for the next five years: the FATF’s March 2026 report flagged stablecoins as the primary vehicle for sanctions evasion, responsible for 84% of the $154 billion in illicit virtual asset flows tracked during 2025. And the US Treasury responded in January by sanctioning crypto exchanges Zedcex and Zedxion – the first-ever Iran-specific exchange sanctions.
This is the crypto equivalent of the post-9/11 financial surveillance expansion. Except instead of SWIFT wiretaps, regulators are building stablecoin monitoring frameworks that’ll define the next decade of digital finance.
Traders watching the regulatory pipeline will note that every major 21st-century conflict has produced financial surveillance legislation within 18-24 months.
The last time sanctions drove a country into crypto at scale – Russia in 2022 – ruble-denominated BTC volume surged 400% overnight. Iran’s adoption is quieter, built over years rather than weeks. And far deeper.
Oil at $109, Hormuz Closed – The Inflation Domino Nobody Priced In
Oil should’ve crushed crypto. Historically, energy shocks kill risk assets – and Bitcoin still trades like one most of the time.
Brent crude sits at $109 per barrel – up 70% from where it sat before Operation Epic Fury launched. Energy shocks of this magnitude have historically ended bull markets.
BTC doesn’t seem to have gotten the memo. It clings to $66,924 as of April 5, barely scratched.
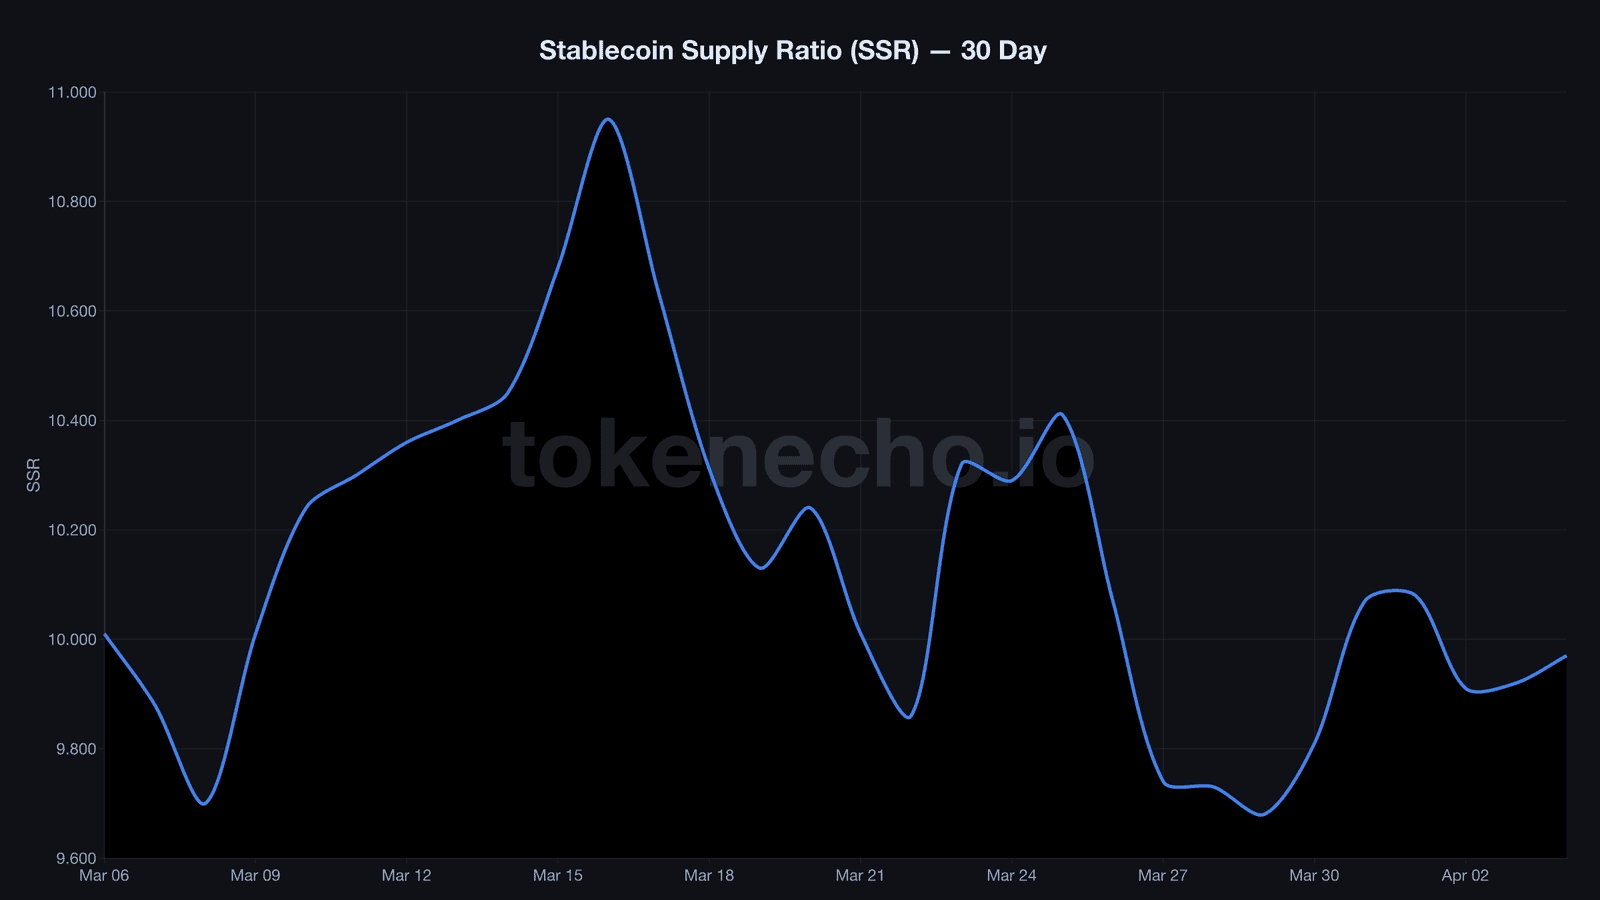
Part of the answer sits in $139 billion worth of stablecoins parked on the sidelines. The Stablecoin Supply Ratio (SSR), a measure of Bitcoin’s market cap relative to total stablecoin supply, hovers at 9.81. That’s a loaded spring.
The IRGC formally closed the Strait of Hormuz to Western-allied shipping on March 27. About 20% of the world’s daily oil supply flows through that chokepoint. The Dallas Fed already warned of “recession-level supply disruption.”
Is this bullish or bearish for crypto? Depends on the timeline.
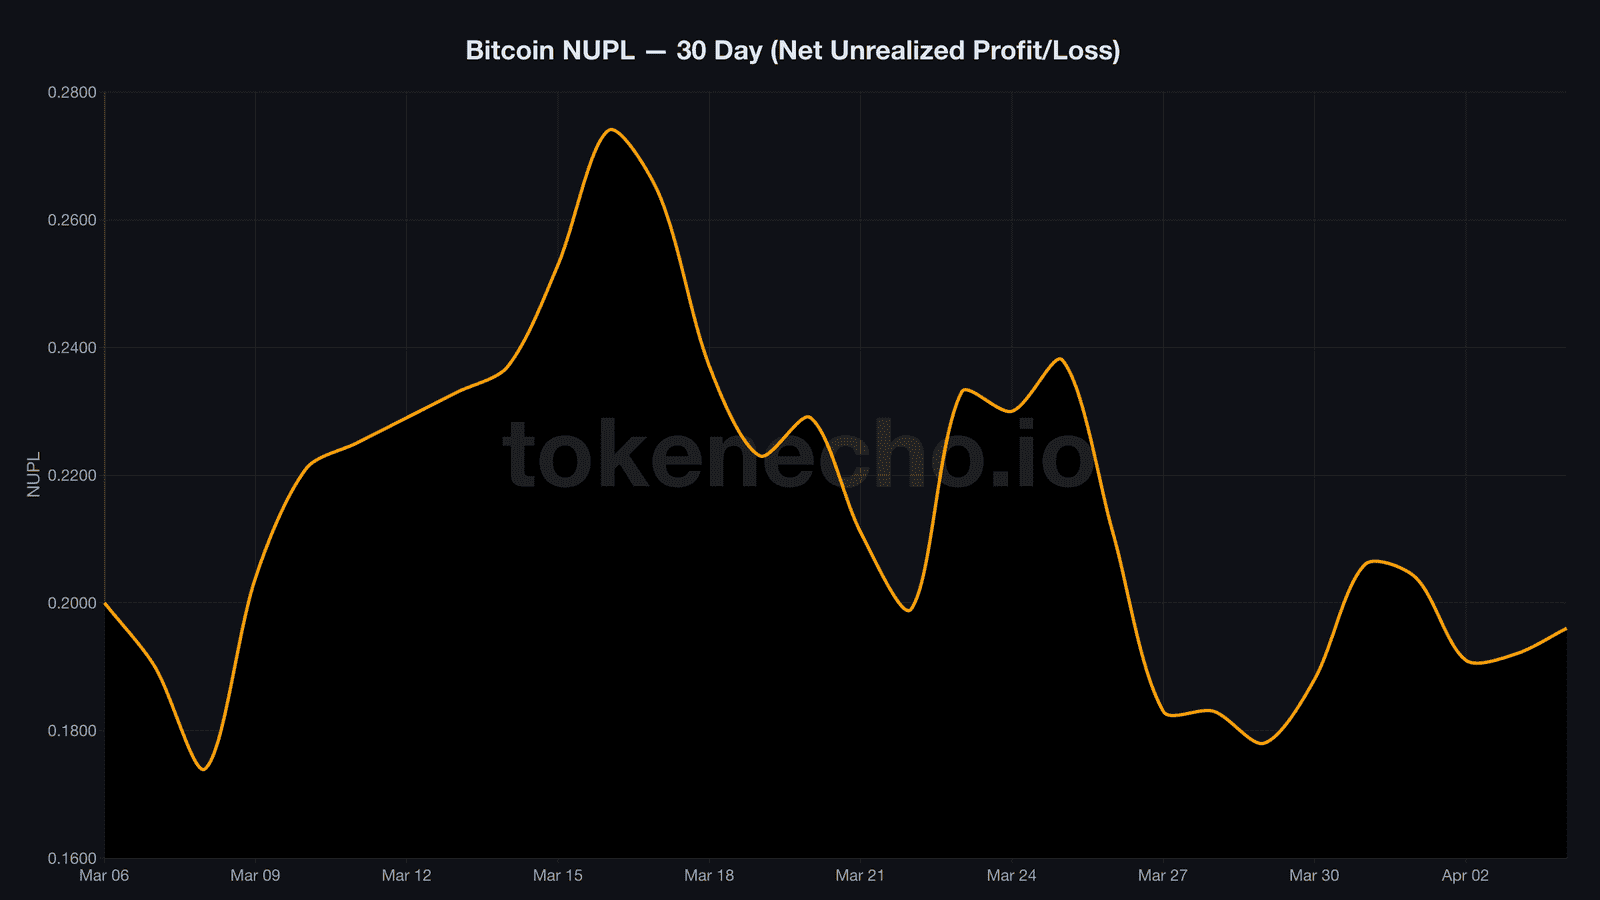
Short-term pain from an oil-driven recession would drag BTC down alongside equities. NUPL, the Net Unrealized Profit/Loss indicator that measures how much of the network sits in profit, already rests at a fragile 0.188 – firmly in the “hope/fear” zone, miles from euphoria.
But if the Fed cuts rates to combat the slowdown – and oil shocks have historically triggered rate cuts, including in 2001, 2008, and 2020 – the resulting liquidity wave has launched BTC into new cycle highs every single time.
The old playbook – sell everything, buy gold – didn’t work this time. Tokenized gold outperformed physical gold during this conflict, and BTC outperformed both within two weeks.
Bitcoin Dropped 8.5%, Then Outperformed Gold and the S&P 500
Is Bitcoin a risk asset or a safe haven? The honest answer after 36 days of war data: it’s becoming something entirely new.
On February 28, BTC dumped 8.5% within an hour of the first strikes. Over $300 million in long positions evaporated.
Classic risk-asset behavior.
But then something broke the historical pattern.
Within seven days, BTC had fully recovered. Spot Bitcoin ETFs absorbed $1.1 billion in net inflows across just three trading sessions during the initial panic.
That doesn’t happen in a risk-off environment.
“Bitcoin has acted as the canary in the macro coal mine,” said Andre Dragosch, Head of Research at Bitwise.
And the canary isn’t dying – it’s singing.
The pre-war BTC-Gold correlation sat at -0.49, deeply inverse. Post-strike, it jumped to +0.16 within days – a shift analysts called a “statistically significant regime change” not observed during any prior geopolitical crisis.
Crypto also had a structural advantage nobody talks about enough. When Operation Epic Fury launched on a Saturday night, stock markets were closed. Bond markets were closed. Commodities were closed.
Crypto wasn’t.
Oil-linked perpetual contracts on Hyperliquid surged 5% within minutes. For the first 36 hours of a major war, crypto was the only global market absorbing risk sentiment in real time.
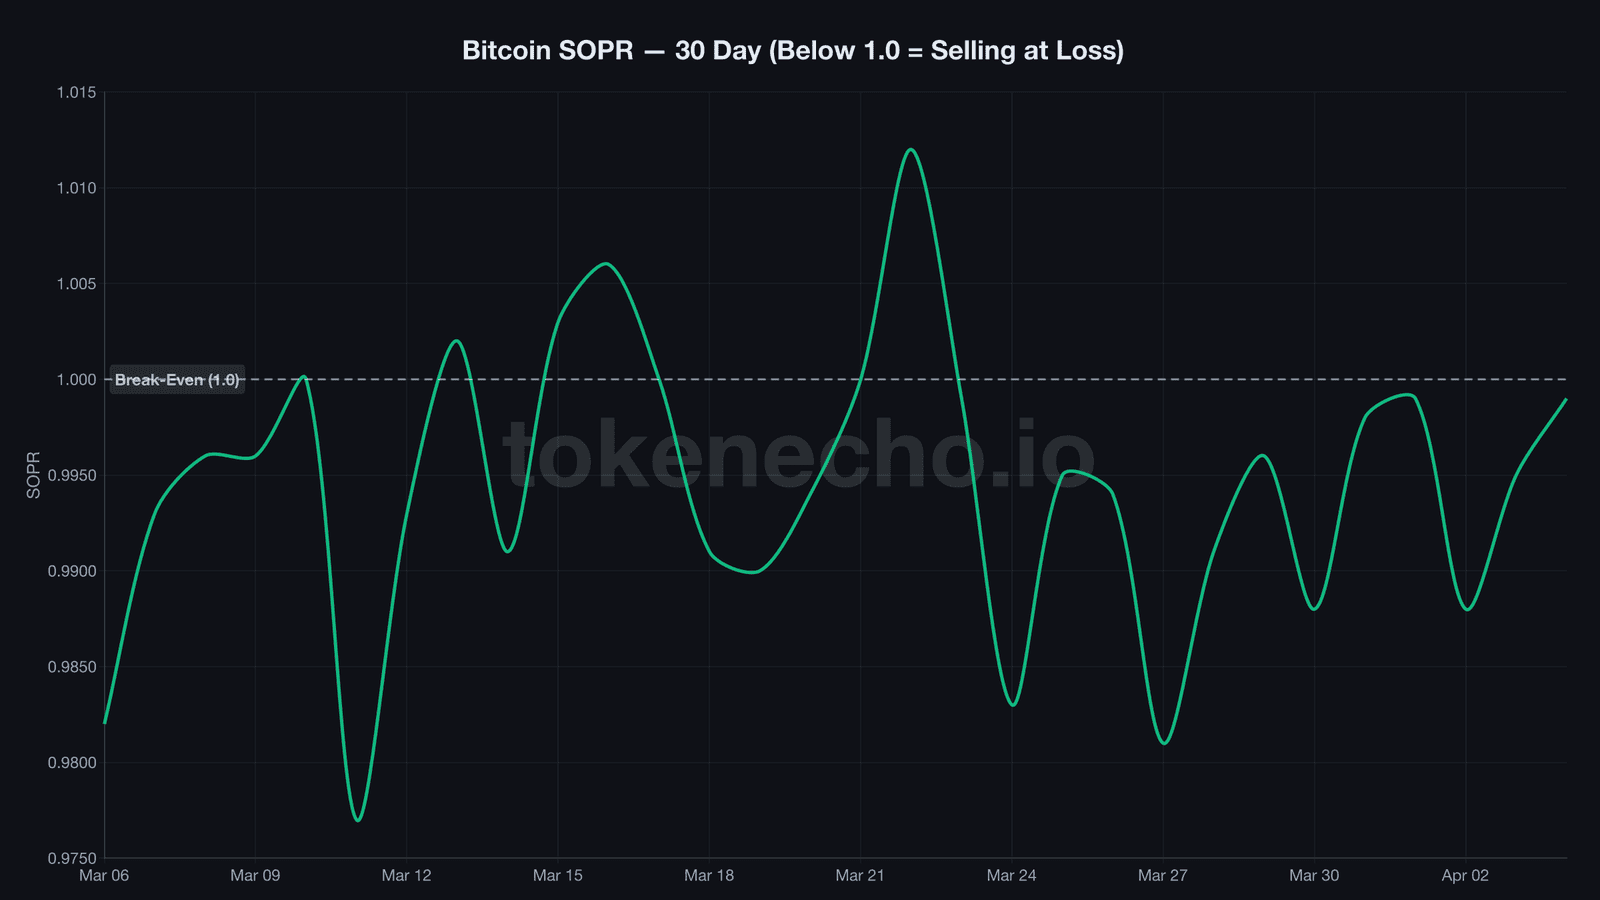
SOPR, the Spent Output Profit Ratio that tracks whether sellers are booking gains or losses, has spent seven consecutive days below 1.0. That means the average Bitcoin seller is locking in a loss. The last time SOPR stayed below 1.0 for this long was November 2022, when BTC sat at $16,000 – and within 60 days, it doubled.
The Russia-Ukraine invasion in February 2022 produced a nearly identical pattern: an 8% crash followed by a 27% rally above pre-invasion levels within one month.
And that’s the real story. Not what happened in 36 days – but what unfolds over the next 1,826.
Five Forces That Reshape Crypto Through 2031
We’ve tracked 36 days of wartime data. Five structural shifts stand out – and none of them require a peace deal to play out.
Mining decentralization accelerates. Iran’s hashrate isn’t coming back. It’ll re-emerge across the US, Latin America, and Central Asia, fragmenting geographic concentration in a way that makes the network more resilient. The China ban taught us this in 2021.
Stablecoin regulation arrives globally. The $507M CBI purchase and the FATF’s illicit flows report made stablecoins impossible for regulators to ignore. Comprehensive licensing frameworks across the G20 by 2028 look increasingly inevitable – and they’ll resemble banking regulation more than crypto regulation.
BTC’s safe-haven narrative gets real data behind it. ETF infrastructure gave Bitcoin an institutional liquidity floor that didn’t exist during prior conflicts. $1.1 billion in ETF inflows during peak panic is the kind of data point that eventually rewrites allocation models at sovereign wealth funds – not overnight, but over the next three to five years.
Crypto becomes geopolitical infrastructure. Iran used BTC mining to fund imports. Russia used USDT to settle oil trades. The question isn’t whether nation-states adopt crypto – they already have. The question is whether the West builds parallel systems or tries to regulate the ones that exist.
The correlation regime changes. BTC-Gold shifting from -0.49 to +0.16 isn’t noise.
If Bitcoin increasingly trades as a macro hedge alongside gold rather than as a risk asset alongside tech stocks, portfolio allocation models across the entire wealth management industry need to be rewritten.
But none of this matters if the war escalates further. If Hormuz stays closed past mid-April and oil hits $150, the resulting global recession would likely drag BTC below $45,000 before any of these structural forces can play out. CryptoQuant flagged this risk explicitly – Bitcoin’s market structure was already fragile before geopolitics poured gasoline on it.
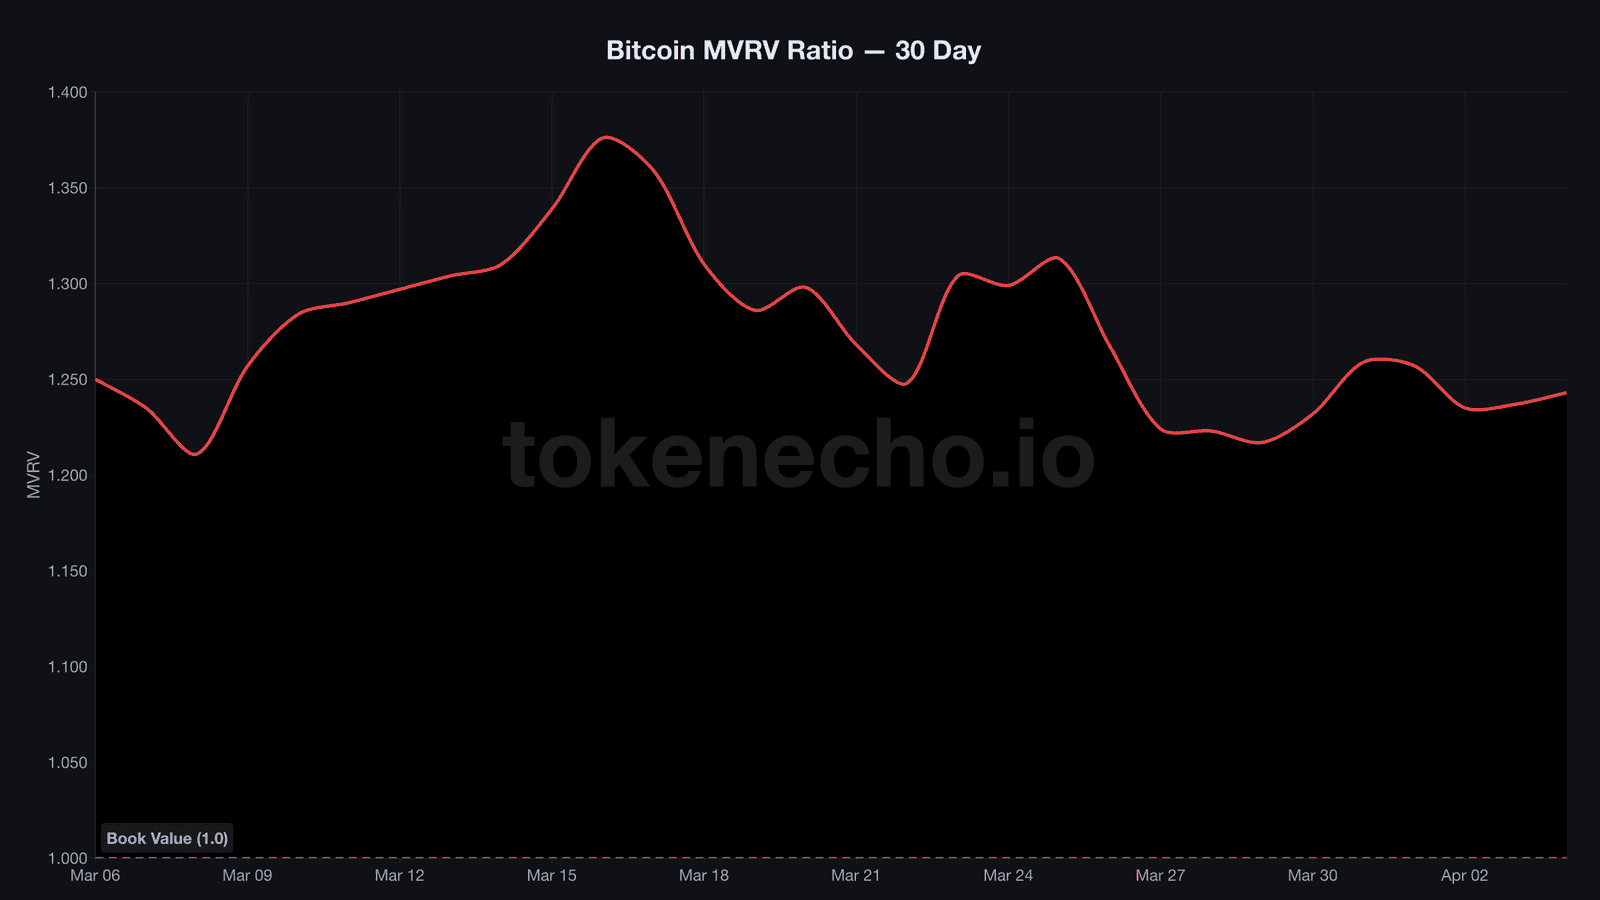
MVRV, the Market Value to Realized Value ratio comparing current price to the network’s average purchase price, sits at just 1.243. Barely above “book value.”
For ongoing Bitcoin market analysis, see our daily Bitcoin price tracking hub.
The war gave Bitcoin its first real stress test with ETF infrastructure in place. Whether that infrastructure holds through a prolonged Hormuz closure – or buckles under a $150 oil shock – will define crypto’s identity for the next market cycle.
This is not financial advice. DYOR. Data as of April 5, 2026.
Sources
- CryptoQuant API: MVRV, SOPR, NUPL, SSR, exchange reserves, Puell Multiple (accessed April 5, 2026)
- CoinGecko API: BTC market data, global crypto market cap (accessed April 5, 2026)
- Elliptic: Iran Central Bank $507M USDT report (January 2026)
- FATF: Stablecoin illicit finance report (March 2026)
- CoinDesk: Bitcoin hashrate decline, ETF flows (March 2026)
- Chainalysis: Iranian crypto ecosystem $7.78B (February 2026)
- Al Jazeera, CNN, NPR: Iran war timeline, Strait of Hormuz updates (April 2026)
- Tom’s Hardware: Iranian mining pivot to AI infrastructure (March 2026)
- Bitwise Research: Andre Dragosch quote on BTC macro correlation
Leave a Reply