🕑 5 min read
A derivatives flush wiped overleveraged shorts and flipped funding rates bullish for the first time in five days.
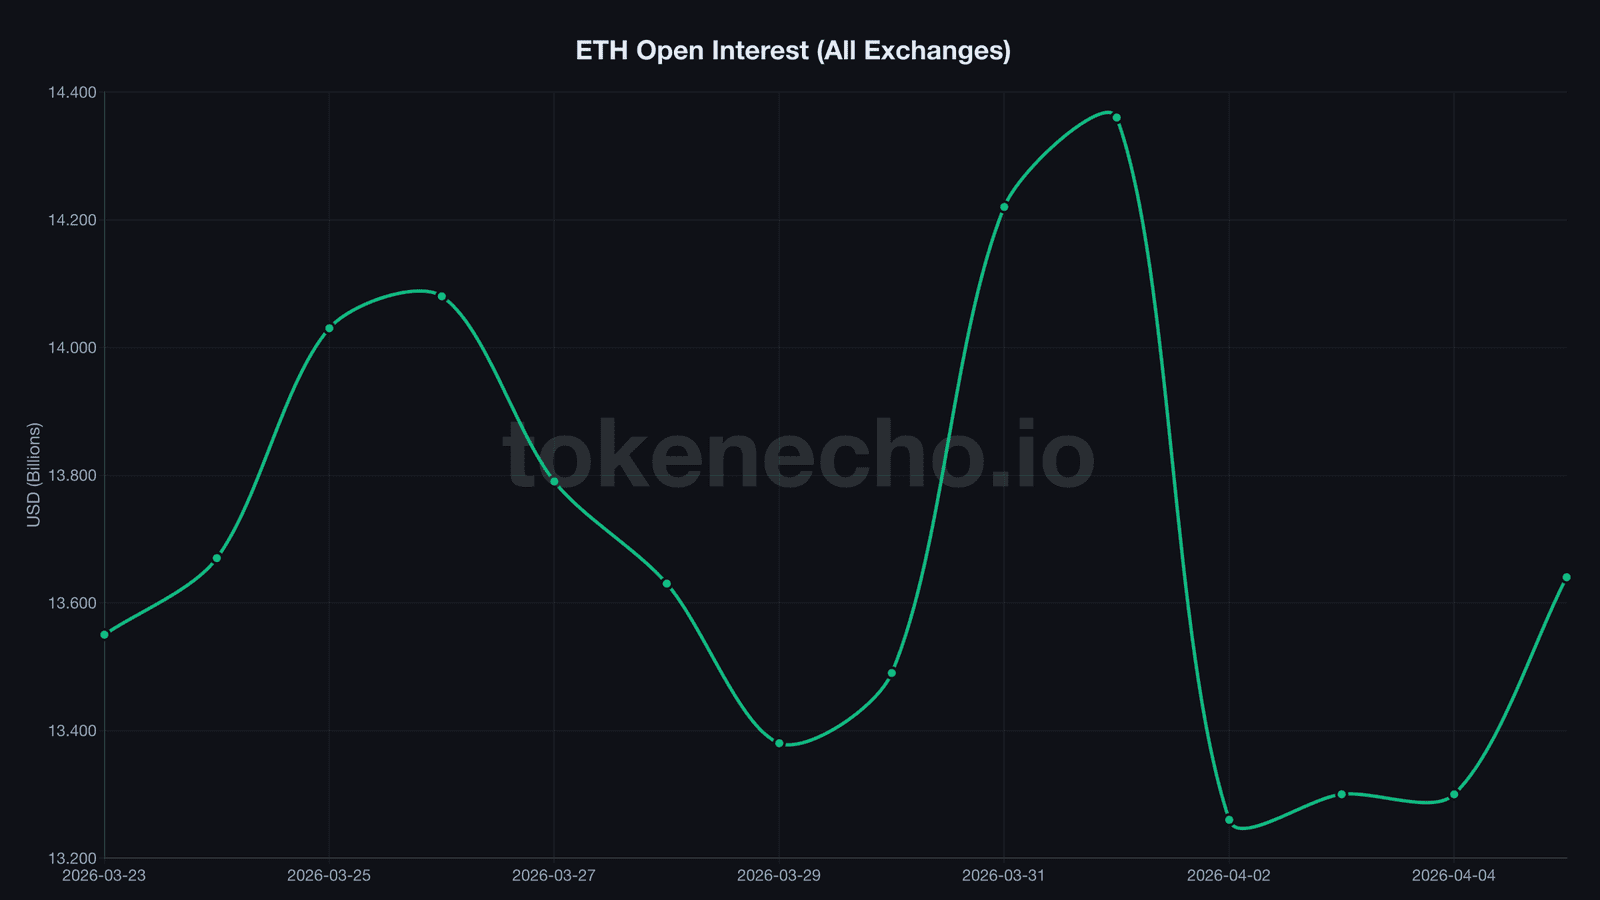
One point one billion dollars in Ethereum open interest — the total value of active futures bets — disappeared between April 1 and April 2.
The price didn’t crash. It rallied.
ETH climbed to $2,136 on April 6, posting a 4.83% gain in 24 hours and breaking above $2,100 for the first time since late March. This wasn’t driven by a headline or an ETF filing. The derivatives market ate itself, and what emerged on the other side is cleaner, lighter, and — if history is any guide — ready to run.
A $1.1B derivatives flush that nobody saw coming
Ethereum’s total open interest plunged from $14.36 billion on April 1 to $13.26 billion the next day. That’s $1.1 billion in leveraged positions erased in roughly 24 hours — the kind of single-day wipeout that tends to happen when one side of a crowded trade gets completely and catastrophically wrong-footed by a market that refused to break.
And the timing tells the whole story.
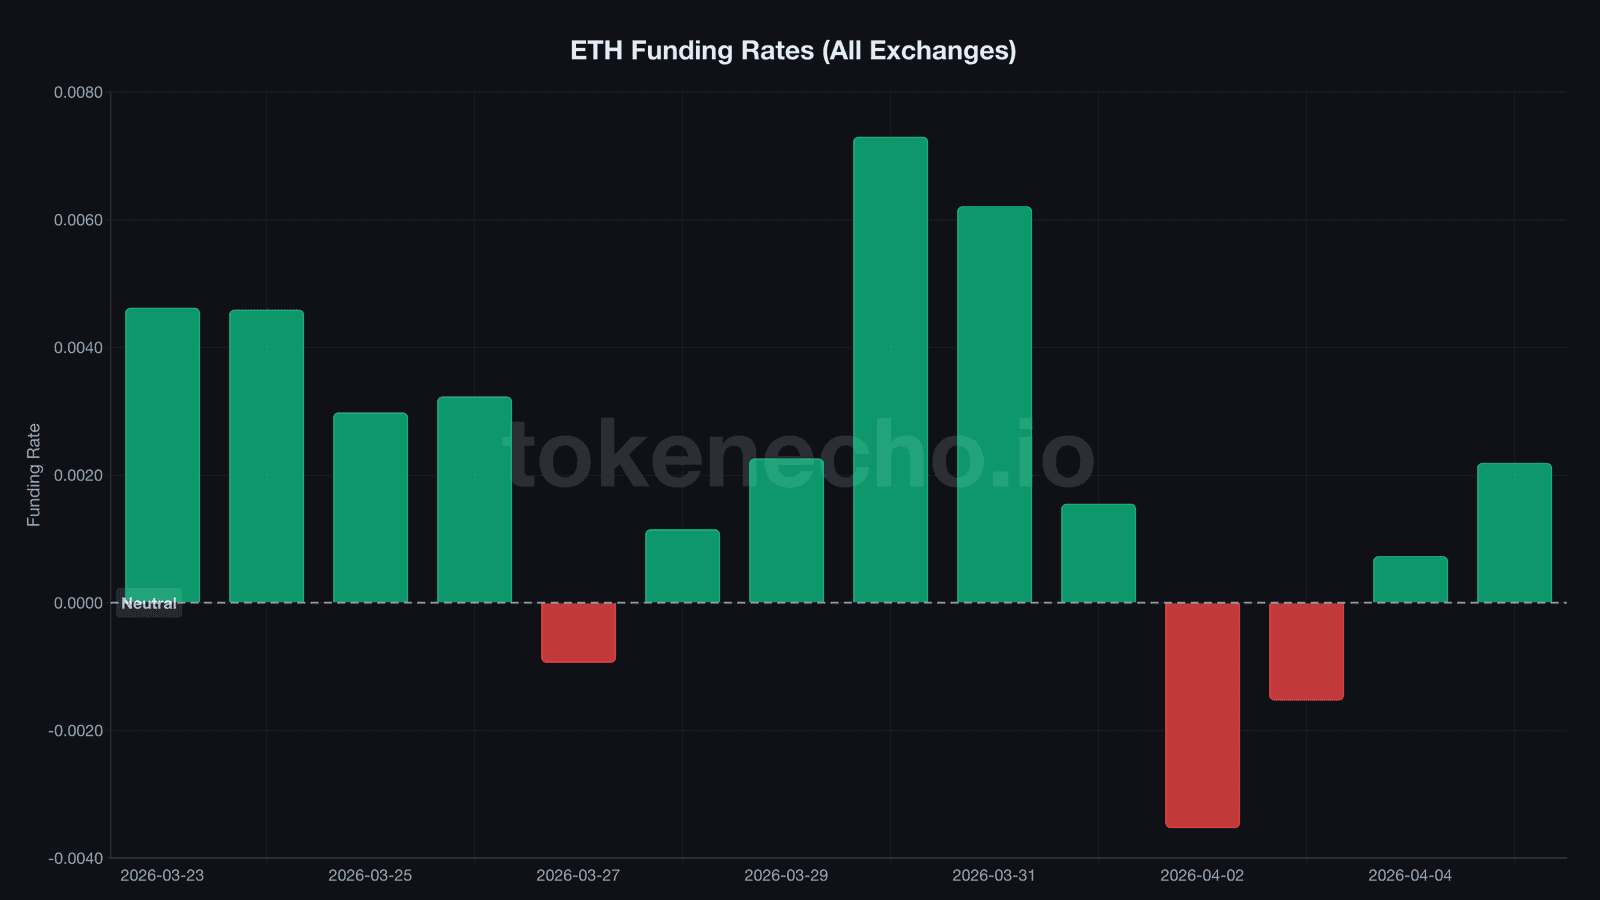
Funding rates, the recurring fee that signals whether longs or shorts control the futures market, had turned negative on April 2. At -0.00353, that was the most bearish reading in two weeks — shorts were piling in, betting ETH would crack below $2,050.
They were wrong.
Instead of breaking down, ETH ground higher from its $2,046 low and never looked back. By April 5, funding had flipped to +0.00219 — a complete sentiment reversal in just 72 hours. Open interest started climbing again, reaching $13.64 billion, but the composition had changed. The overleveraged shorts were gone. Fresh longs stepped in.
“Markets with a considerable dependency on leveraged products tend to exhibit sharper and less predictable price movements,” said Darkfost, a CryptoQuant contributor. “Participants should be attentive to swings in open interest and funding conditions as potential signals for rapid volatility.”
We’ve seen this kind of reset before. It’s the derivatives equivalent of a controlled demolition — tear down the unstable structure so something sturdier can go up in its place.
Exchange deposits crashed 87% — and sellers have nothing left
Everyone expected the selling pressure to continue. ETH is still 56.8% below its all-time high, after all. But on-chain data from Binance, the largest spot exchange for ETH, paints the opposite picture.
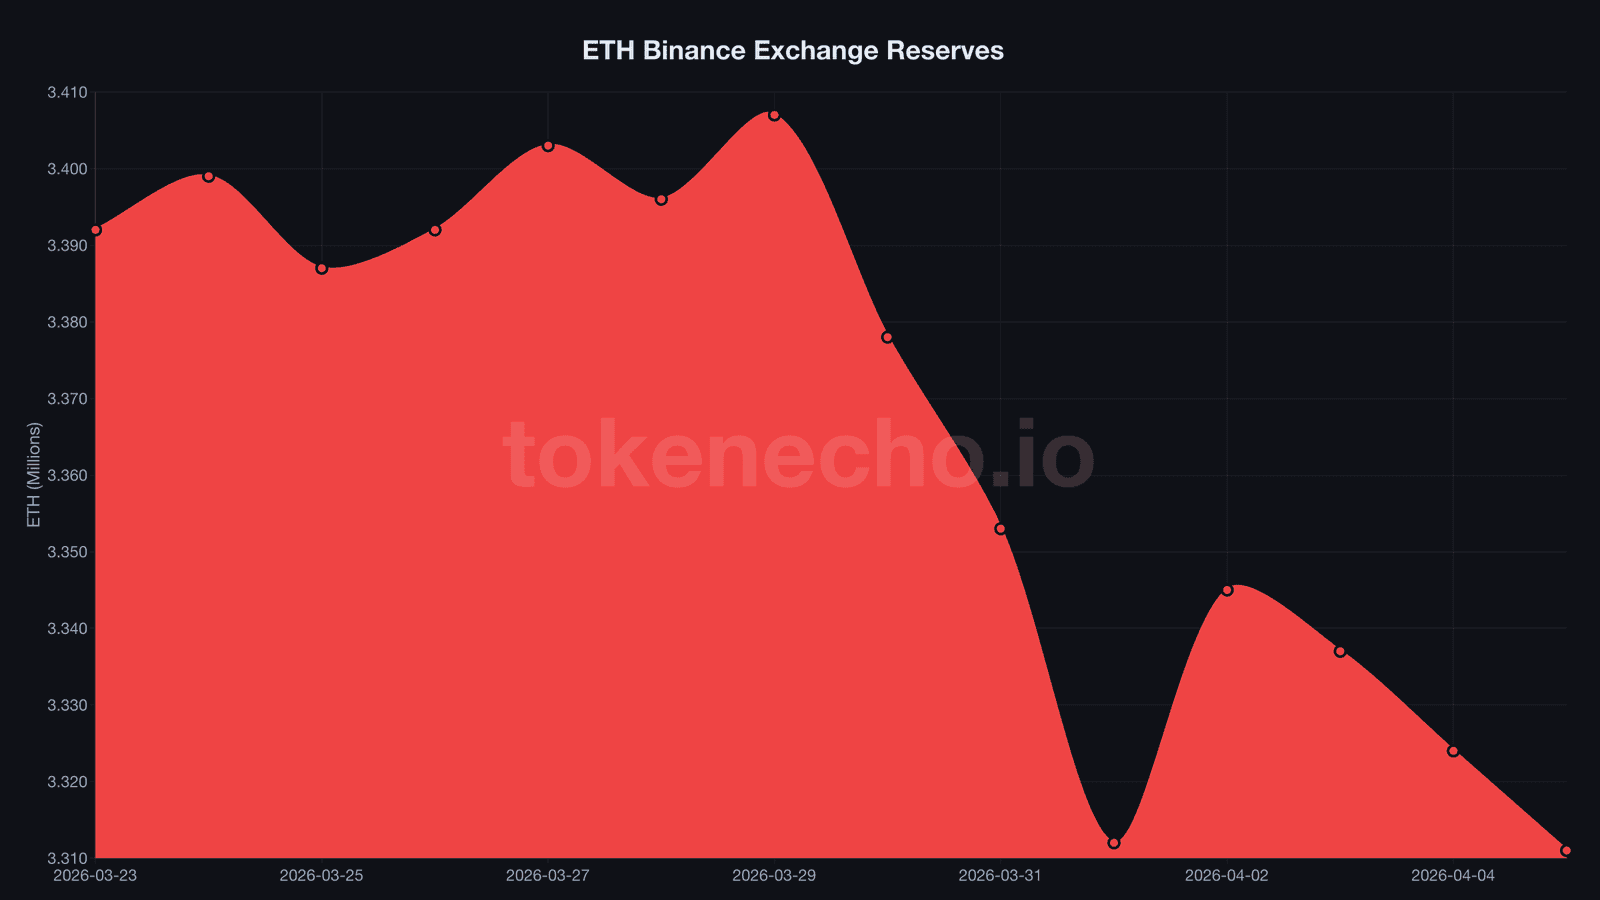
Exchange inflows — ETH deposited for potential sale — collapsed from 348,287 ETH on April 1 to just 46,767 ETH by April 4. That’s an 87% drop in three days.
Run those numbers: for every 100 ETH flowing into Binance at the start of the week, only 13 arrived by Thursday.
Binance held 3.41 million ETH on March 29. By April 5, that dropped to 3.31 million — roughly 100,000 ETH moved off the exchange in under two weeks.
At today’s prices, that’s $214 million shifted to cold storage or staking. The broader picture is even more striking. When exchange trading crashed 85% earlier this week, over 1.13 million ETH — worth $2.3 billion — had already left all exchanges in the 30 days prior.
Sellers aren’t slowing down. They’ve disappeared.
Picture a poker table where half the players have been bluffing with empty hands all week. Once the bluffs get called, they fold. The players still sitting there? They’re holding real cards. That’s what happened to both ETH spot and futures markets this week — and it happened simultaneously, which almost never occurs.
ETH reclaims $2,100 — but the real test sits higher
Does a leverage flush automatically mean the bottom is in? Not even close. But it removes one of the biggest obstacles to a sustained rally.
ETH’s market cap sits at $257.8 billion with 24-hour volume surging to $12.85 billion — a dramatic recovery from the near-dead trading activity earlier in the week. Fresh capital is flowing in, not just positions unwinding.
Support has consolidated around $2,070, the level that absorbed midweek selling pressure, with a sturdier floor at $2,015 beneath it.
First resistance: $2,150, the intraweek high. Above that, the path opens to $2,200 and eventually the $2,360 zone — a level ETH hasn’t touched since early March.
But the bearish case hasn’t vanished.
ETH dominance lingers near 10%, a multi-year low that reflects capital rotating toward Bitcoin and Solana instead. And anyone who read the case for why Ethereum’s 59% drawdown might actually be bullish knows the historical parallels cut both ways.
Spot ETH ETF outflows have totaled $2.76 billion over the past four months — institutional investors voting with their feet. The ETH/BTC ratio at 0.031 hasn’t shown sustained recovery in weeks. For every bullish flow signal, there’s a fund manager heading for the exit.
“If this dynamic persists and the spot market and ETFs begin to support the move, Ethereum could potentially restart a positive trend,” said Darkfost.
That condition — spot confirmation — is everything. A derivatives flush clears the path, but somebody has to walk it, and so far the institutional money that poured $2.76 billion out of ETH ETFs over the past four months hasn’t shown any sign of turning around. Traders watching the $2,100-$2,200 range will note the leverage reset makes any breakout here more organically supported than anything we’ve seen since mid-March.
If exchange reserves keep declining while funding stays positive, the setup rhymes with late Q1 2024, when a similar flush preceded a 40% rally over the following six weeks. Until spot volumes and ETF flows confirm what the derivatives market just signaled, this rally remains a promissory note — not a guarantee.
This analysis is part of our daily Ethereum price tracking. See all previous analyses and key metrics on our hub page.
The leverage flush points one direction, but the ETF money still hasn’t arrived. Which side breaks first could define Ethereum’s entire Q2.
This is not financial advice. DYOR. Data as of April 6, 2026.
Sources:
Leave a Reply