🕑 5 min read
Bitcoin’s ceasefire rally lasted exactly 18 hours.
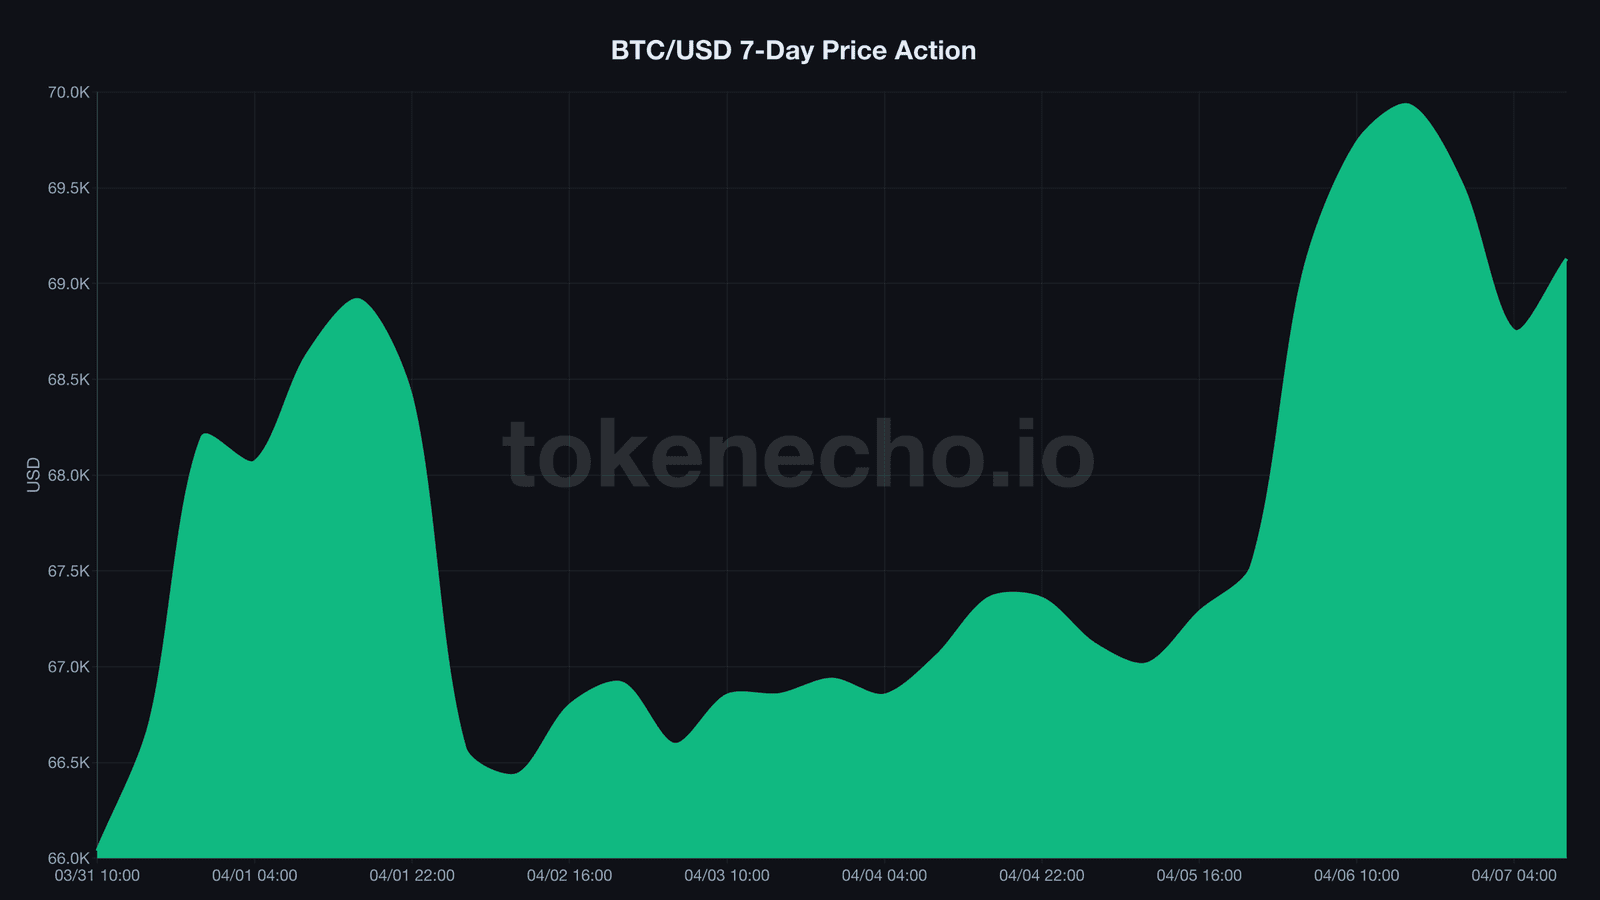
BTC surged past $70,000 on Sunday after reports that Iran and the U.S. received a mediator-backed ceasefire proposal – a 45-day pause to fighting and the reopening of the Strait of Hormuz.
Shorts got demolished. $197M liquidated – longs at just $77M, a 3:1 wipeout.
Then Iran rejected the deal. And now the real test begins.
Two Trump deadlines land within 48 hours of each other. Tuesday night: an ultimatum for Iran to accept a ceasefire or face “severe military action.” Wednesday: reciprocal tariffs reaching up to 50% on imports from more than 50 countries.
Bitcoin trades at $69,145 as of Monday morning, down 1% in 24 hours. That’s 45.2% below its October all-time high of $126,080.
The on-chain data tells a more uncomfortable story than the price chart.
Two deadlines, 48 hours – and the market remembers last April
The last time Trump weaponized trade policy against crypto, it didn’t end the way bears expected.
On April 2, 2025 – dubbed “Liberation Day” – sweeping tariffs wiped $6.6 trillion from global markets in a single session. Bitcoin dropped 10.4%.
Within six weeks, it rallied 50% to a fresh all-time high above $111,000.
But this week’s setup is different in almost every way that matters. Last year’s tariffs were a surprise. This round? Everyone saw them coming – and the market has been bleeding for months. BTC is down 45% from its ATH, and the total crypto market cap has shed nearly $1 trillion since October.
The Fear & Greed Index has sat at 11 out of 100 for 47 consecutive days of Extreme Fear. That’s the longest streak since the 2022 bear market – longer than the Luna crash, longer than FTX.
The Iran dimension adds a wildcard that didn’t exist last April. Trump’s Tuesday night deadline carries a genuine military threat. If rejected – and Iran already rejected the first proposal – oil markets could spike, risk assets could dump, and the $2.44 trillion crypto market would get caught between two simultaneous shocks.
Nobody got a 48-hour warning before Liberation Day. This time, they did.
It’s like a poker tournament where the next two hands have been dealt face-up – and half the table is already pushing their chips toward the exit.
$360M in Bitcoin moved to exchanges while everyone watched the ceasefire
What caught our attention isn’t the ceasefire headline. It’s what happened underneath.
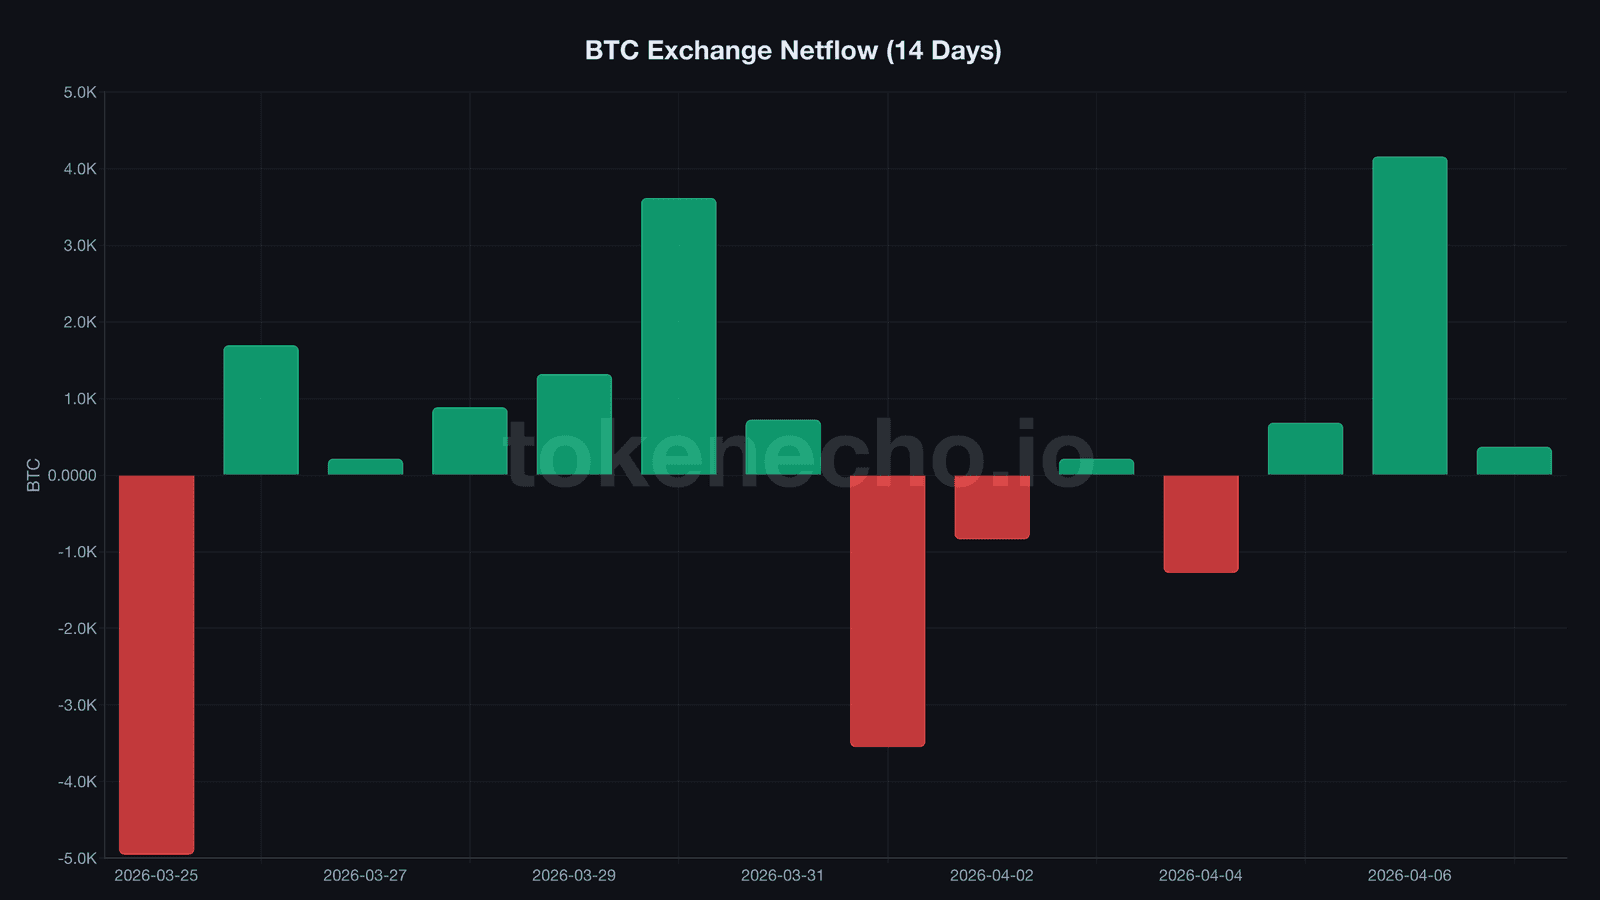
Over the past three days, exchange netflows, the difference between BTC flowing into and out of exchanges, flipped decisively positive. April 5: +682 BTC. The next day was the big one – 4,157 BTC flowed in. And today, another +368.
That adds up to 5,208 BTC – roughly $360M at current prices – moved onto exchanges. The kind of repositioning that typically precedes a sell-off.
Binance alone now holds 637,838 BTC. Up 1,468 from last week.
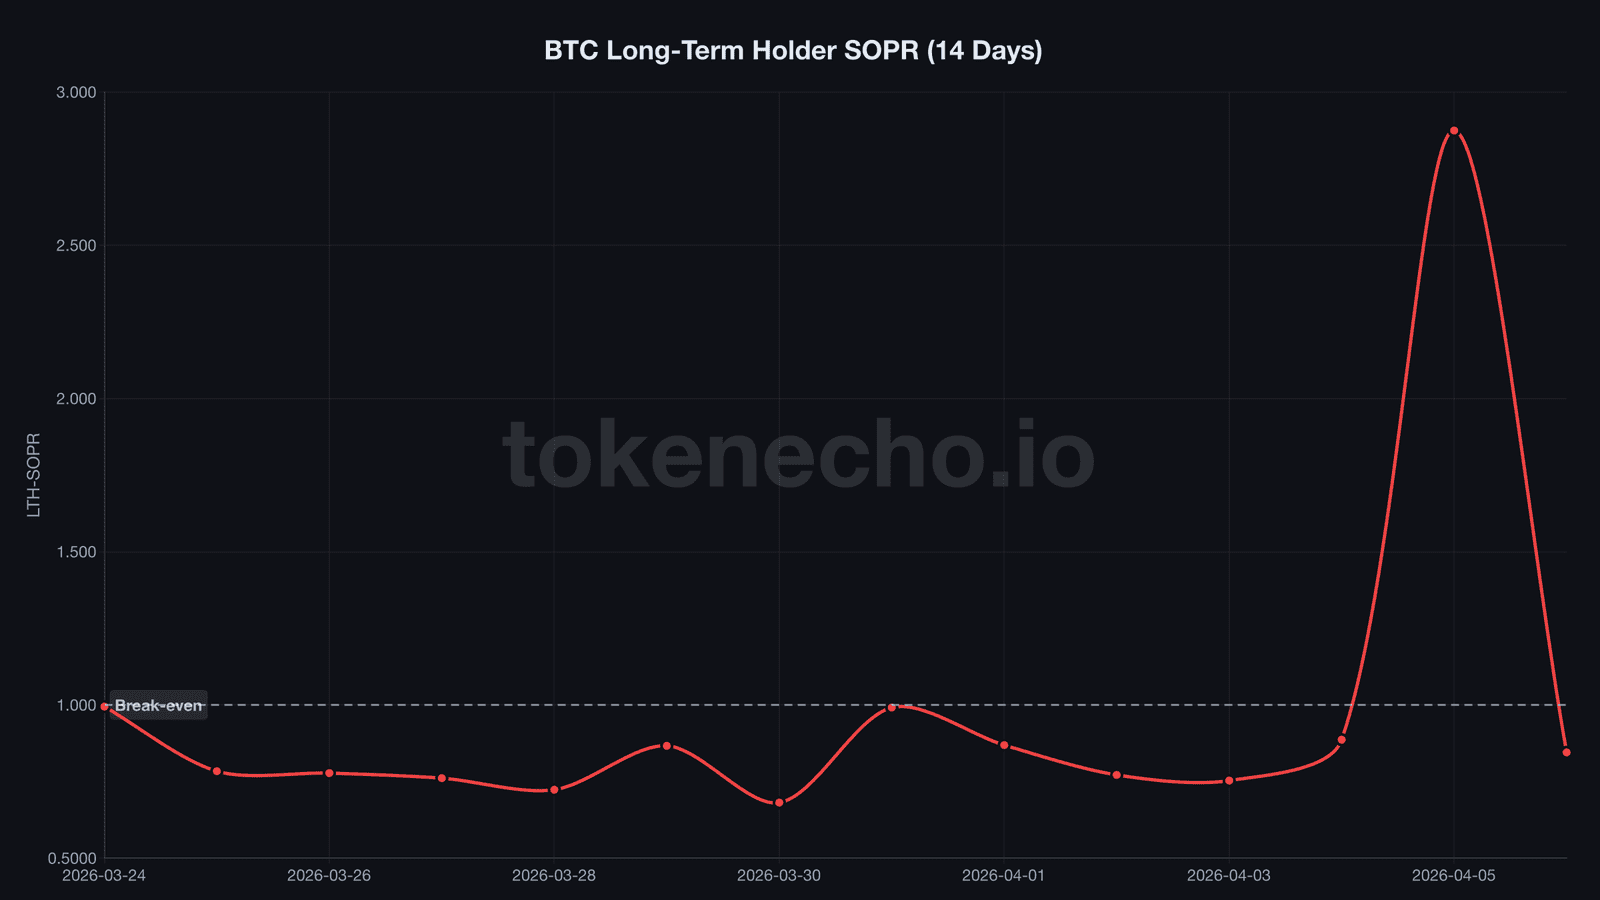
Long-term holders just pulled off something unusual. LTH-SOPR, a ratio tracking whether long-term Bitcoin holders sell at a profit or loss, spiked to 2.874 on April 5. Coins that moved earned an average 187% profit.
One day later? It crashed to 0.845. A 15.5% average loss.
Old coins moved once, took profit, and disappeared. CDD, a metric weighting transaction volume by the age of coins spent, dropped from 14.8 million to 5.5 million – a 63% collapse in three days. The redistribution from veteran wallets lasted exactly one day.
“A $10,000 meltdown remains likely unless prices reclaim $75,000,” Bloomberg Intelligence’s Mike McGlone said. That $75K threshold looks even further away with tariffs about to kick in.
SOPR, which measures whether the average Bitcoin transaction settles at a profit or loss, sits at 1.001. Barely above breakeven. After 13 consecutive days below 1.0 – the longest stretch since FTX – sellers finally stopped bleeding on April 6. One green day doesn’t mean the pain is over.
$135B in stablecoins wait as leverage hits 3-month lows
So who’s on the other side of this trade?
SSR, a ratio comparing Bitcoin’s market cap to total stablecoin supply, sits at 10.21. That translates to roughly $135 billion in stablecoin dry powder parked on the sidelines – capital that could flood into BTC if the right catalyst arrives. Or stay parked if both deadlines blow up.
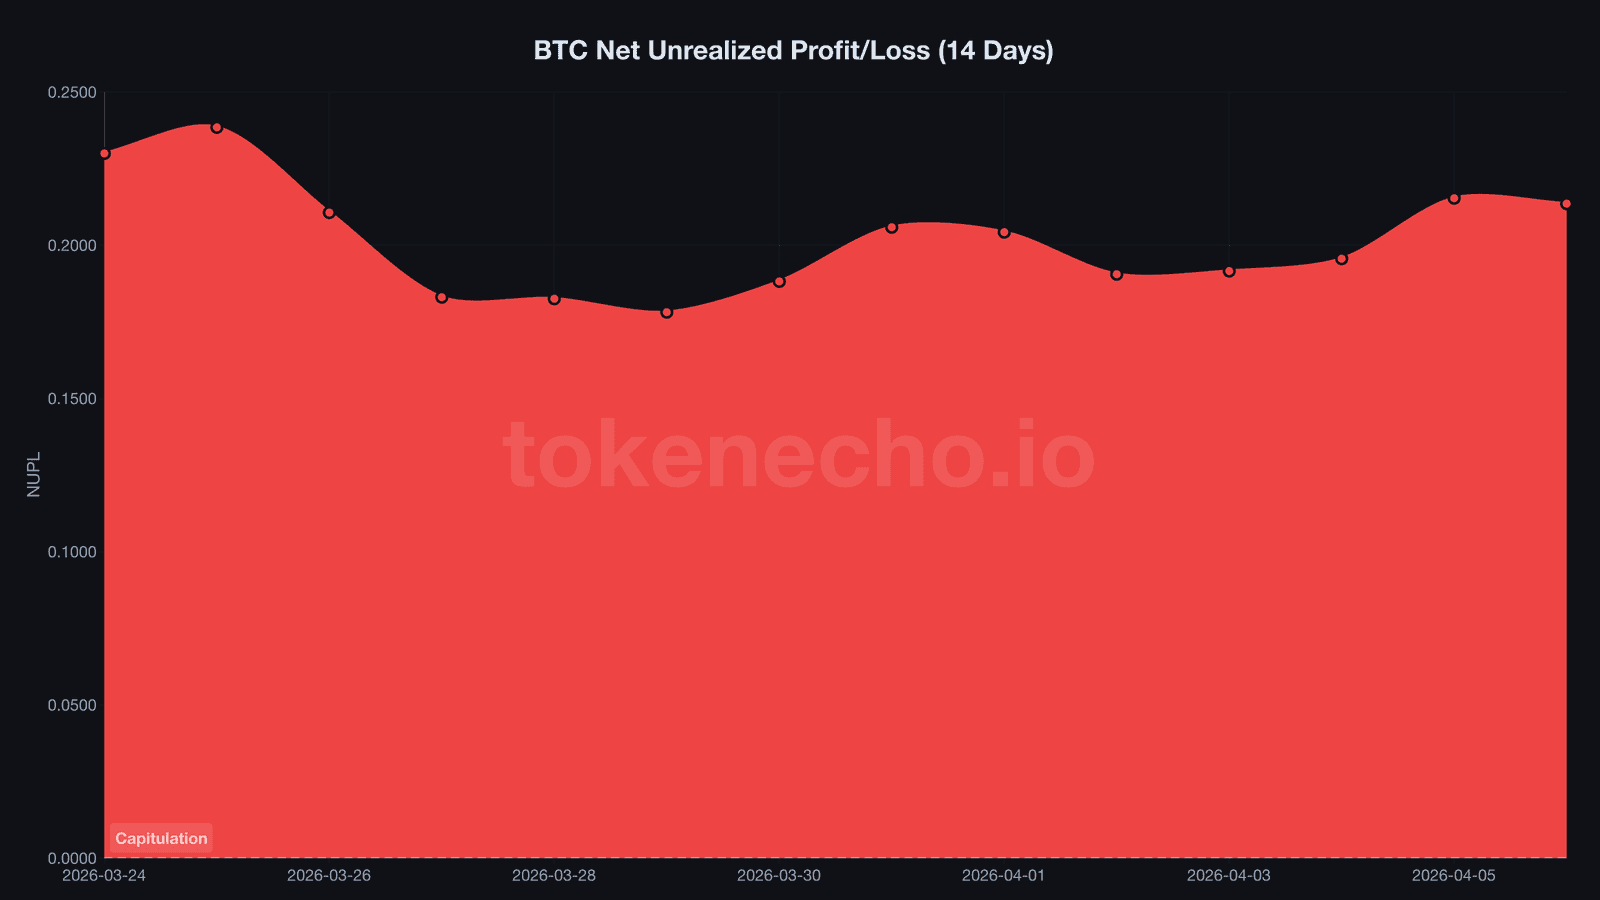
NUPL, a gauge of aggregate unrealized profit and loss across all Bitcoin holders, has recovered to 0.214 from its March low of 0.178. No longer flirting with the capitulation zone – but close enough to smell it. For context, the last time NUPL touched 0.178 was during the FTX collapse, when BTC sat at $16,000.
The leverage ratio across all exchanges holds at 0.226, well below the March peak of 0.240. Traders have been deleveraging for two weeks straight. That’s actually constructive – any move that comes won’t get amplified by overleveraged positions getting wiped. It’ll be spot-driven, which tends to stick.
And then there’s Strategy. Michael Saylor’s company bought 88,594 BTC in Q1 at an average of $80,929 per coin. That leaves them sitting on $14.5 billion in unrealized losses – the largest in the company’s history.
They accounted for 94% of all corporate Bitcoin purchases this quarter. Whether that’s conviction or something else entirely depends on what happens in the next 48 hours.
Puell Multiple, which compares daily miner revenue to its 365-day moving average, dropped to 0.630. Miners earn just 63% of their yearly average. We’ve seen this Puell level before – late 2022, right before BTC tripled from $16K to $48K in four months.
If Iran accepts a deal Tuesday and tariffs trigger a sell-the-news fade, the $67,200 support that’s held for three weeks becomes the line in the sand. If both deadlines escalate – military action plus 50% import duties – the next test sits at $64,500. CoinGlass data shows $1.13 billion in long liquidations clustered at that level.
But if the market has already priced in both shocks – and a 47-day fear streak argues it might have – that $135B in stablecoins could turn a panic dip into the fastest reversal of 2026.
The on-chain signals say sellers are running dry. The macro calendar says the biggest test lands in 48 hours. Something has to give.
This is not financial advice. DYOR. Data as of April 7, 2026.
Sources
- CoinGecko API – BTC price ($69,145), market cap ($1.384T), ATH ($126,080), 24h/7d changes
- CryptoQuant API – SOPR (1.001), LTH-SOPR (0.845), exchange netflows (+5,208 BTC/3d), Binance reserves (637,838 BTC), SSR (10.21), NUPL (0.214), Puell Multiple (0.630), leverage ratio (0.226), MVRV (1.272)
- Alternative.me – Fear & Greed Index (11, 47 days Extreme Fear)
- Bloomberg Intelligence – Mike McGlone $10K/$75K threshold quote
- Protos – Strategy Q1 data (88,594 BTC, $14.5B unrealized loss)
- CoinGlass – $1.13B long liquidation cluster at $64,500
Leave a Reply