
🕑 6 min read
Bitcoin’s 15% bounce from March lows hasn’t healed the market – SOPR remains below 1.0 while exchange reserves reverse course ahead of Iran’s April 22 ceasefire deadline.
Bitcoin rallied 15% from its March lows. The average seller still lost money on every transaction.
That single fact – SOPR sitting at 0.997 on April 19, stubbornly below the 1.0 breakeven line – tells you more about this rally than any price chart could. BTC traded at $75,271 on Sunday, recovering from a $73,854 intraday low after Iran rejected a second round of peace talks with the US on Saturday. Up 6.38% on the week, still 40.3% below its $126,080 all-time high. And sellers can’t catch a break.
Key Takeaways
- Bitcoin’s SOPR, a metric that measures whether the average on-chain transaction occurs at a profit or loss, dropped back below 1.0 (0.997) on April 19 – the 15% rally from $66K hasn’t made sellers whole.
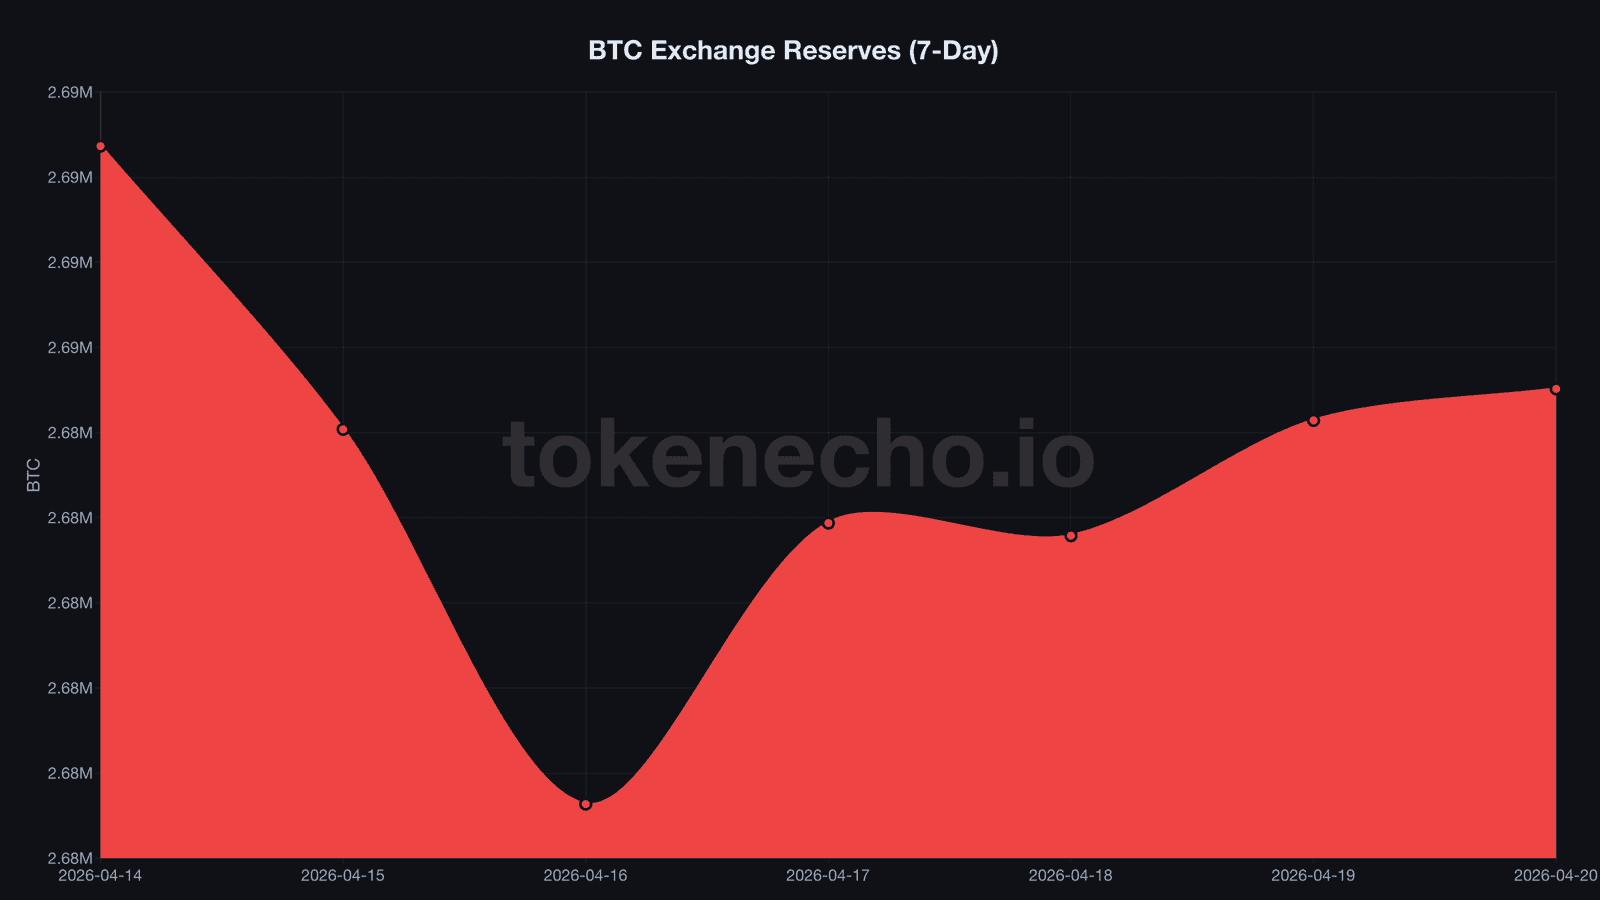
- Exchange reserves bottomed at 2,679,635 BTC on April 16, then reversed – 4,877 BTC ($367M) flowed back onto exchanges in four days, the first sustained inflow since early April.
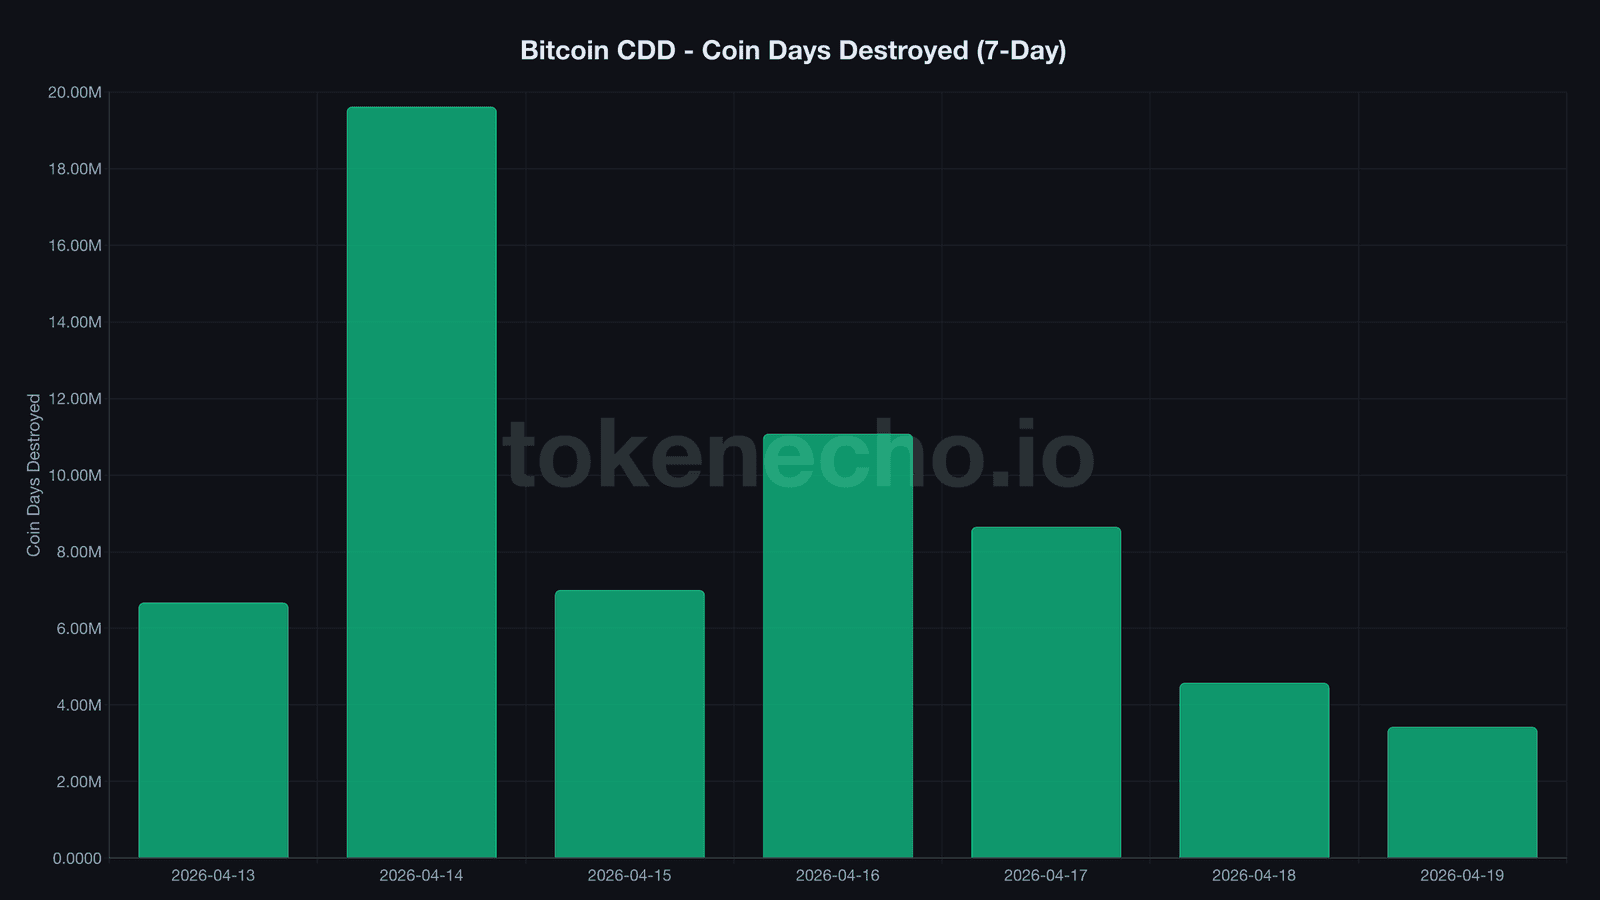
- CDD collapsed 83% (19.6M to 3.4M in five days), signaling long-term holder dormancy – but Iran’s ceasefire expiry on April 22 creates a binary catalyst in under 48 hours.
A 15% rally where nobody breaks even
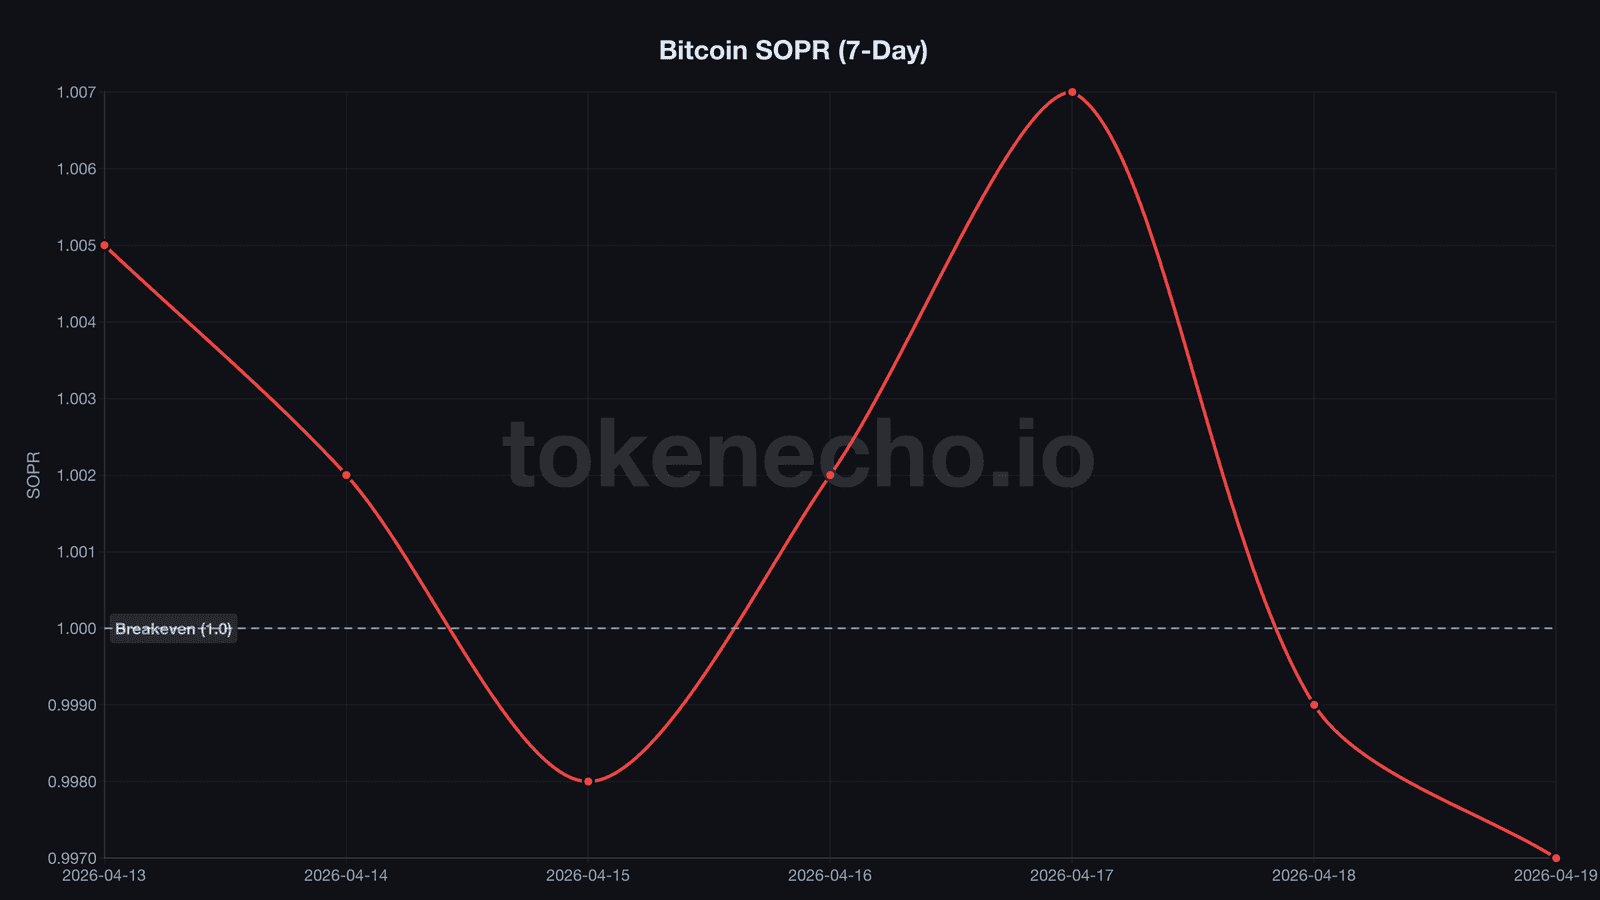
SOPR, which tracks whether the average on-chain transaction occurs at a profit or loss, sat at 0.997 on April 19. Below the 1.0 breakeven line. At $75,271.
This is genuinely unusual.
Adjusted SOPR painted the same picture: 0.994.
Long-term holder SOPR – tracking coins held for more than 155 days – sank to 0.904. Veterans who survived FTX, Luna, and COVID are dumping at roughly a 10% loss.
It’s like selling your house during a neighborhood property boom and still owing the bank. That’s where BTC holders sit right now.
SOPR briefly popped above 1.0 on April 6 (1.008) after 13 consecutive days below breakeven. It didn’t last. By April 19, sellers were underwater again.
“Late-cycle distribution,” Benjamin Cowen, founder of IntoTheCryptoverse, said last week. The SOPR pattern backs up that framing – sellers aren’t capitulating anymore, but they aren’t profiting either.
Stuck.
$367M returns to exchanges – the supply squeeze cracks
The supply squeeze everyone was banking on? It reversed four days ago.
We’ve been tracking exchange reserves since they hit a cycle low of 2,679,635 BTC on April 16. Since then, 4,877 BTC – roughly $367 million – flowed back.
Daily netflows tell the story. On April 17, +3,301 BTC hit exchanges – the biggest single-day inflow since April 7. By Saturday, another +1,354 arrived. Today: +370 and counting.
But Binance tells a completely different story. The world’s largest exchange saw reserves drop from 625,401 BTC on April 14 to 620,246 today – a 5,155 BTC drain worth $388M. Whoever is pulling coins off Binance isn’t putting them back.
So who’s depositing where? Coins leave Binance – historically associated with sophisticated traders moving to cold storage – while flowing into other venues. That divergence often signals a split: long-term accumulators vs. rally sellers reducing exposure on smaller platforms.
Markets rarely give clean signals. The Binance divergence is a reminder that aggregate data can mask the most important story – and sometimes the minority position turns out to be right.
Old coins go dormant, new risk builds before April 22
The great flush is over.
CDD, a metric measuring how many “coin days” are destroyed when old BTC moves, collapsed from 19.6 million on April 14 to 3.4 million by April 19. An 83% drop in five days. Long-term holders who panicked during mid-April’s spike appear to have exhausted their selling – or at least hit pause.
NUPL, the net unrealized profit/loss ratio capturing the market’s aggregate profit position, peaked at 0.297 on April 17 when BTC touched $78,240. It’s retreated to 0.266 since. Two days of optimism. Gone.
Miner reserves held flat at 1,804,568 BTC – miners aren’t selling, but they aren’t stacking either. And the Puell Multiple, which measures daily miner revenue relative to its historical average, ticked up to 0.846 from its 0.571 cycle low. Recovering, but still 15% below the yearly mean.
Then there’s the elephant nobody can ignore. Iran’s two-week ceasefire expires April 22 – less than 48 hours from now. And the signals aren’t encouraging: Tehran rejected a second round of peace talks with Washington on Saturday, knocking BTC from $76K to $73,854 in hours. The last time Hormuz headlines hit, BTC surged to $78K on reopening news, only for the IRGC to re-close the strait the next day. Anyone expecting a clean resolution hasn’t been watching.
November 2022 rhymes – one variable doesn’t fit
The last time SOPR stayed persistently below 1.0 during an initial recovery was November-December 2022. BTC sat at $16,500 after the FTX collapse. NUPL hovered in the same zone. CDD had collapsed after a massive capitulation spike – just like now.
What followed: BTC rallied 56% in 60 days to $25,000. Then kept going – +94% to $31,000 within 90 days.
But one variable doesn’t fit. In late 2022, spot Bitcoin ETFs didn’t exist. Goldman Sachs wasn’t filing its first BTC fund. Morgan Stanley wasn’t offering a 0.14% fee product to 16,000 advisors managing $6.2 trillion. Strategy didn’t hold 780,897 BTC.
That institutional demand floor – $1.28 billion in ETF inflows across just four days (April 14-17), including a $663.9 million single-day surge when Iran initially reopened Hormuz – creates a structural bid that the 2022 recovery never had. The on-chain rhyme holds, but the macro backdrop is fundamentally different.
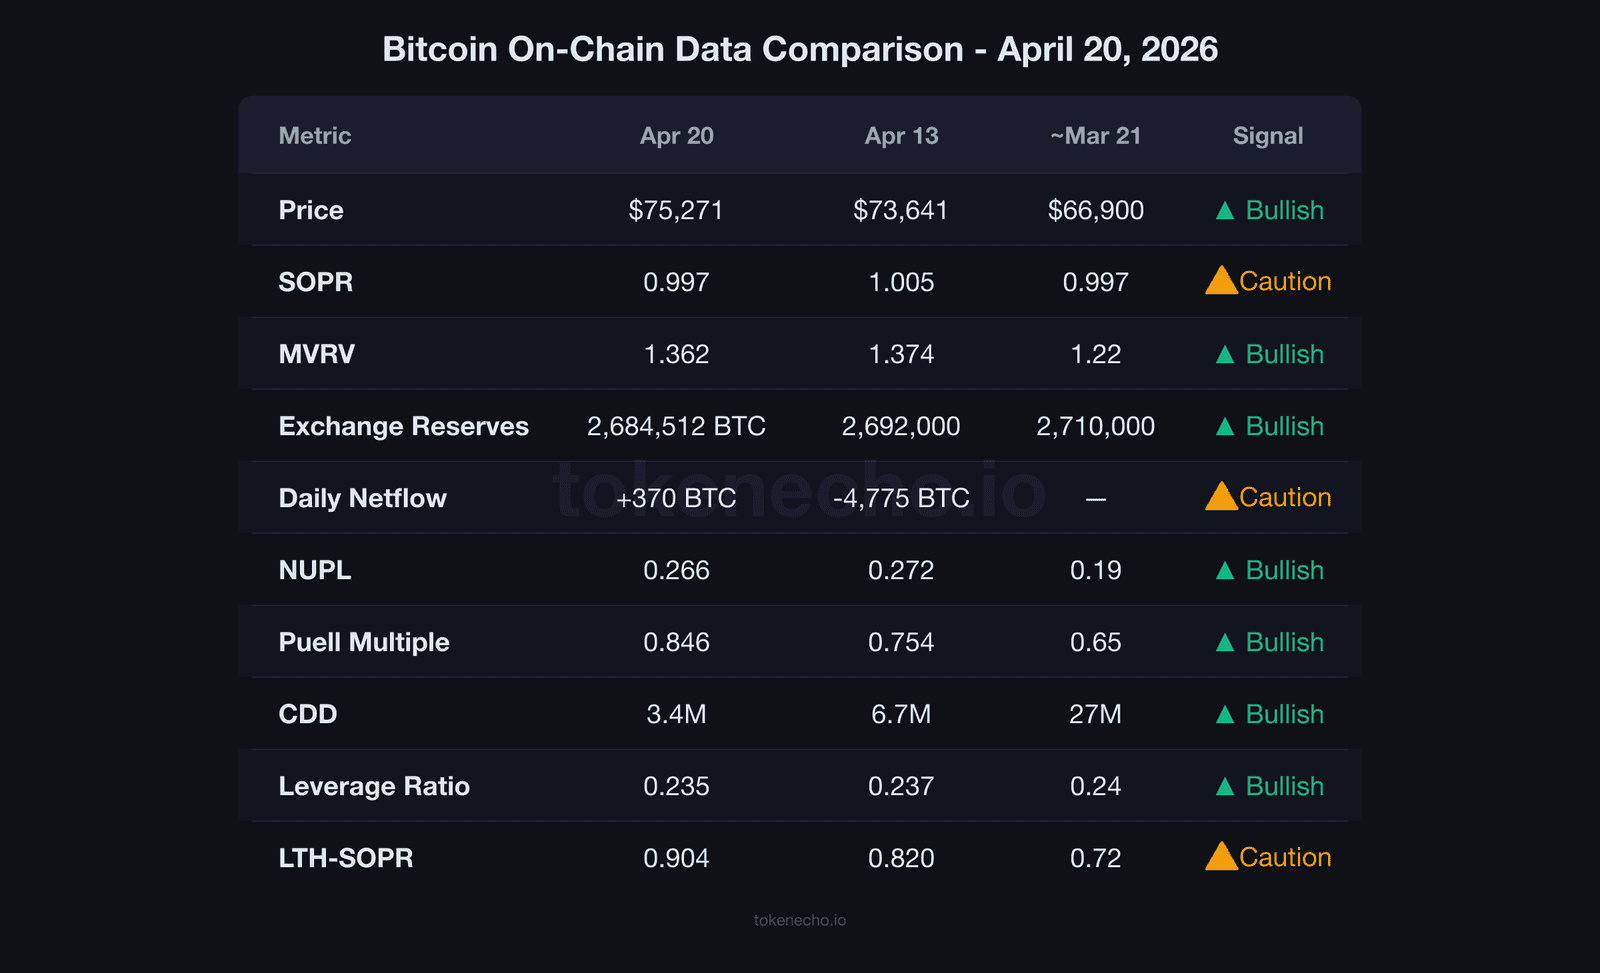
On-chain scorecard (3 of 6 bullish)
- ✅ Exchange reserves: declining long-term (2,710K → 2,684K in 30 days) – supply compression intact
- ⚠️ SOPR: 0.997 – back below breakeven, sellers still losing
- ✅ Leverage ratio: 0.235, deleveraged from 0.256 peak – healthy structural base
- ⚠️ LTH-SOPR: 0.904 – veterans selling at ~10% loss into the rally
- ✅ CDD: collapsed 83% – dormancy confirms panic selling is over
- ⚠️ Netflow: reversed to positive (+1,724 BTC in 2 days) – exchange inflows returning
TokenEcho verdict
Direction: Cautiously bullish
Key level: $73,800 – Sunday’s intraday low. A sustained break below would confirm the rally has lost its bid and the SOPR recovery thesis has failed.
Risk factor: Iran ceasefire expiry April 22. The Hormuz situation has already produced one false start ($78K → immediate reversal). A second collapse could trigger cascading liquidations – current leverage positioning suggests $1.5-2B in long exposure below $70K.
This is an analytical assessment, not financial advice.
What to watch in the next 72 hours
- Iran ceasefire expiry April 22 – binary catalyst. Renewal or extension → potential push toward $78,240 resistance. Collapse → heavy liquidation volume based on current open interest.
- SOPR crossing 1.0 from below and sustaining for 3+ days – would mark the first confirmed profit-taking regime since early March, a signal that seller exhaustion is complete. Traders watching this metric will find historical context in our BTC price prediction.
- Binance reserves continuing to drain while aggregate inflows rise – if this divergence persists, institutional accumulation is likely intensifying behind the rally.
This analysis is part of our daily Bitcoin price tracking. See all previous analyses and key metrics on our hub page.
The on-chain data says this rally doesn’t have conviction. The institutional bids say otherwise. April 22 decides who’s right.
This is not financial advice. DYOR. Data as of April 20, 2026.
Sources:
- CoinGecko – price, market cap, supply, ATH data
- CryptoQuant – SOPR, MVRV, NUPL, CDD, exchange reserves, netflows, miner reserves, leverage ratio, Puell Multiple
- Benjamin Cowen, IntoTheCryptoverse – analyst commentary
- Farside Investors – Bitcoin ETF flow data
Leave a Reply