
🕑 7 min read
ETFs absorbed $471M in a single day while veterans dumped into strength – and the fear index barely flinched.
BTC just hit its highest price in 10 weeks. The fear index says it shouldn’t have.
Bitcoin touched $78,240 on April 17 – a level not seen since February 4 – after Iran reopened the Strait of Hormuz for commercial shipping during the US-brokered ceasefire. This bitcoin price analysis breaks down why $810M in short liquidations and $471M in ETF inflows couldn’t convince the broader market to stop panicking. And why the people who’ve held BTC the longest are using every green candle to sell at a loss.
Key Takeaways
- BTC touched $78,240 – its highest since February 4 – after Iran reopened the Strait of Hormuz, triggering $810M in short liquidations and a single-day ETF inflow of $471M.
- Long-term holders sold at an 11% average loss (LTH-SOPR 0.889), and exchange reserves started rising after hitting a cycle low of 2,679,635 BTC on April 16.
- Fear & Greed sits at 21 (Extreme Fear) despite $78K BTC – the widest price-to-sentiment gap since the post-FTX recovery in early 2023.
| Metric | Apr 18 | 7d Ago | 30d Ago | Signal |
|---|---|---|---|---|
| BTC Price | $77,080 | ~$72,800 | ~$70,800 | ▲ Bullish |
| SOPR | 1.007 | 1.006 | 0.988 | ▲ Bullish |
| LTH-SOPR | 0.889 | 0.885 | 0.681 | ⚠️ Caution |
| NUPL | 0.297 | 0.258 | 0.188 | ▲ Bullish |
| Exch. Reserves | 2,683,053 | 2,699,771 | 2,706,041 | ▲ Bullish |
| Puell Multiple | 0.765 | 0.638 | 0.675 | ⚠️ Caution |
| SSR | 11.39 | 10.81 | 9.68 | ⚠️ Caution |
$810M in shorts wiped out – the Strait that broke the bears
Everyone expected the US-Iran ceasefire to get extended. Nobody expected what happened when Iran actually reopened the Strait of Hormuz on April 17.
Brent crude dropped below $89. Risk assets surged. And $810M in crypto short positions got liquidated in hours – the largest single-day short squeeze since the ceasefire announcement on April 8.
BTC ripped from $75,200 to an intraday high of $78,240. That’s a 4% move in under six hours.
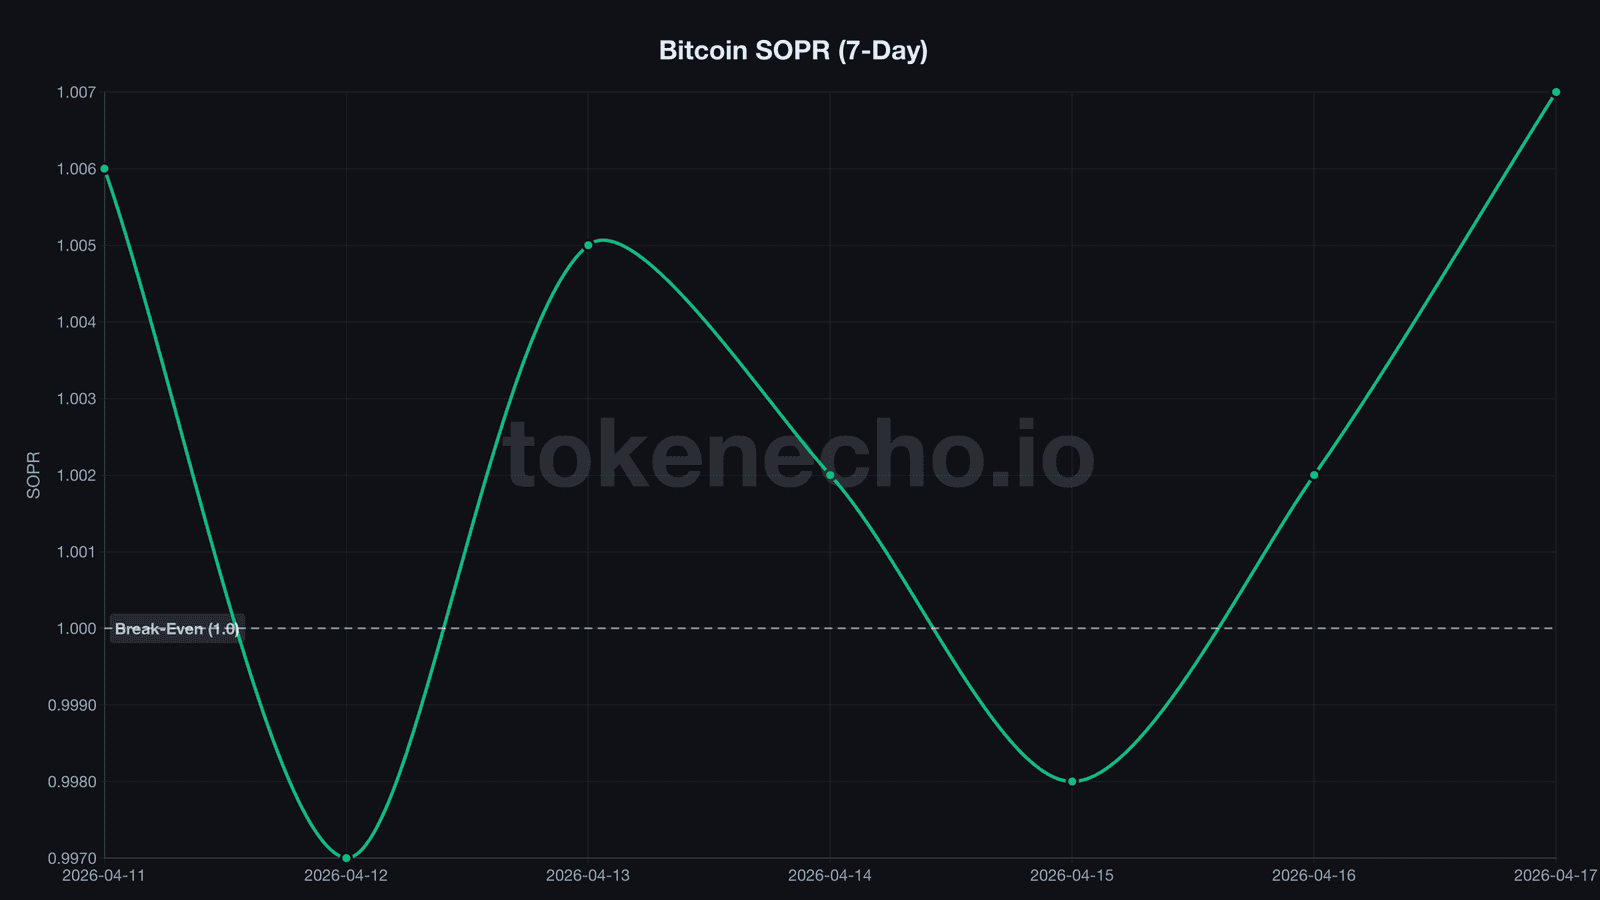
SOPR, a ratio measuring whether coins move at a profit or loss, climbed to 1.007 – firmly positive for the second consecutive day after weeks of flirting with the break-even line. Short-term holders are finally making money. Their STH-SOPR hit 1.017, the strongest reading since early April.
ETFs amplified the move. BlackRock’s IBIT led with $81.7M, followed by Grayscale BTC at $16.7M and Morgan Stanley’s freshly-launched MSBT at $13.4M. Total single-day net inflows: $471M – the strongest since January.
And Strategy? Michael Saylor’s 780,897 BTC hoard crossed its $75,577 average cost basis for the first time in months. After sitting on billions in unrealized losses through the entire March panic, Strategy is back in the black.
It’s a pattern stock market veterans know well. After a prolonged downturn, the first relief rally doesn’t attract fresh buyers – it attracts trapped sellers looking for the exit. The door swings open, and instead of rushing in, people rush out.
That’s exactly what’s happening on-chain.
Exchange reserves hit a cycle low, then started refilling
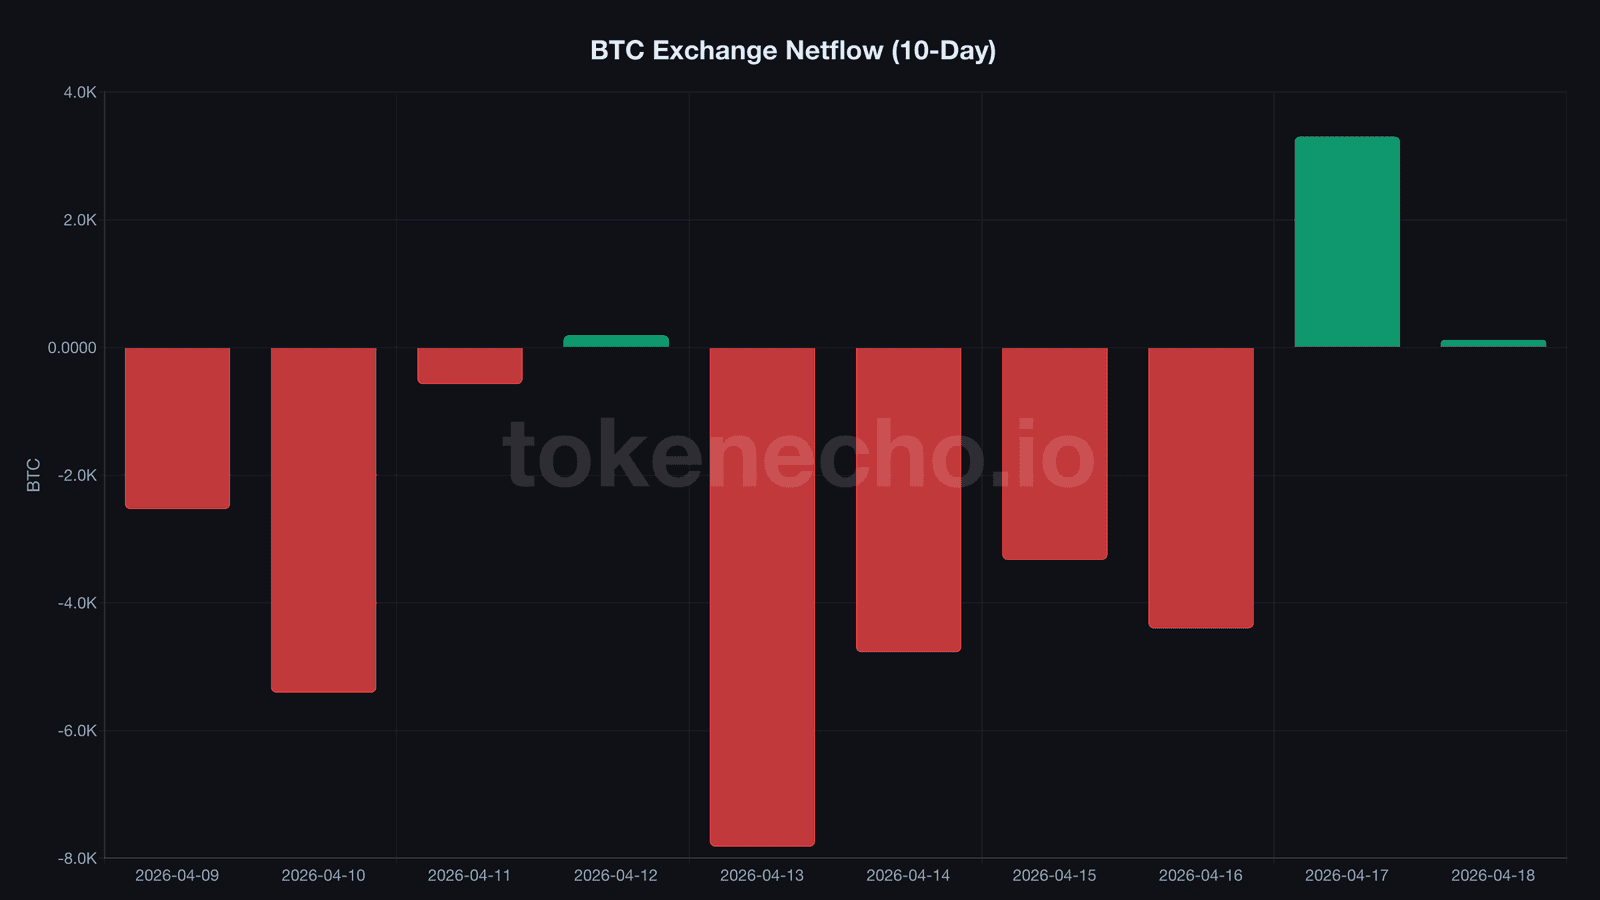
+3,301 BTC. That’s what flowed back onto exchanges on April 17 – the first significant net inflow in five days, worth roughly $254M at current prices.
We’ve been tracking exchange reserves closely since the April 9 peak of 2,705,754 BTC. Over the next seven days, 26,119 BTC ($2.01B) drained from all exchanges. Binance alone lost 17,907 BTC ($1.38B) – roughly 70% of the total outflow. On April 16, all-exchange reserves bottomed at 2,679,635 BTC, the lowest point of this entire cycle.
Then the Hormuz rally hit. And sellers showed up.
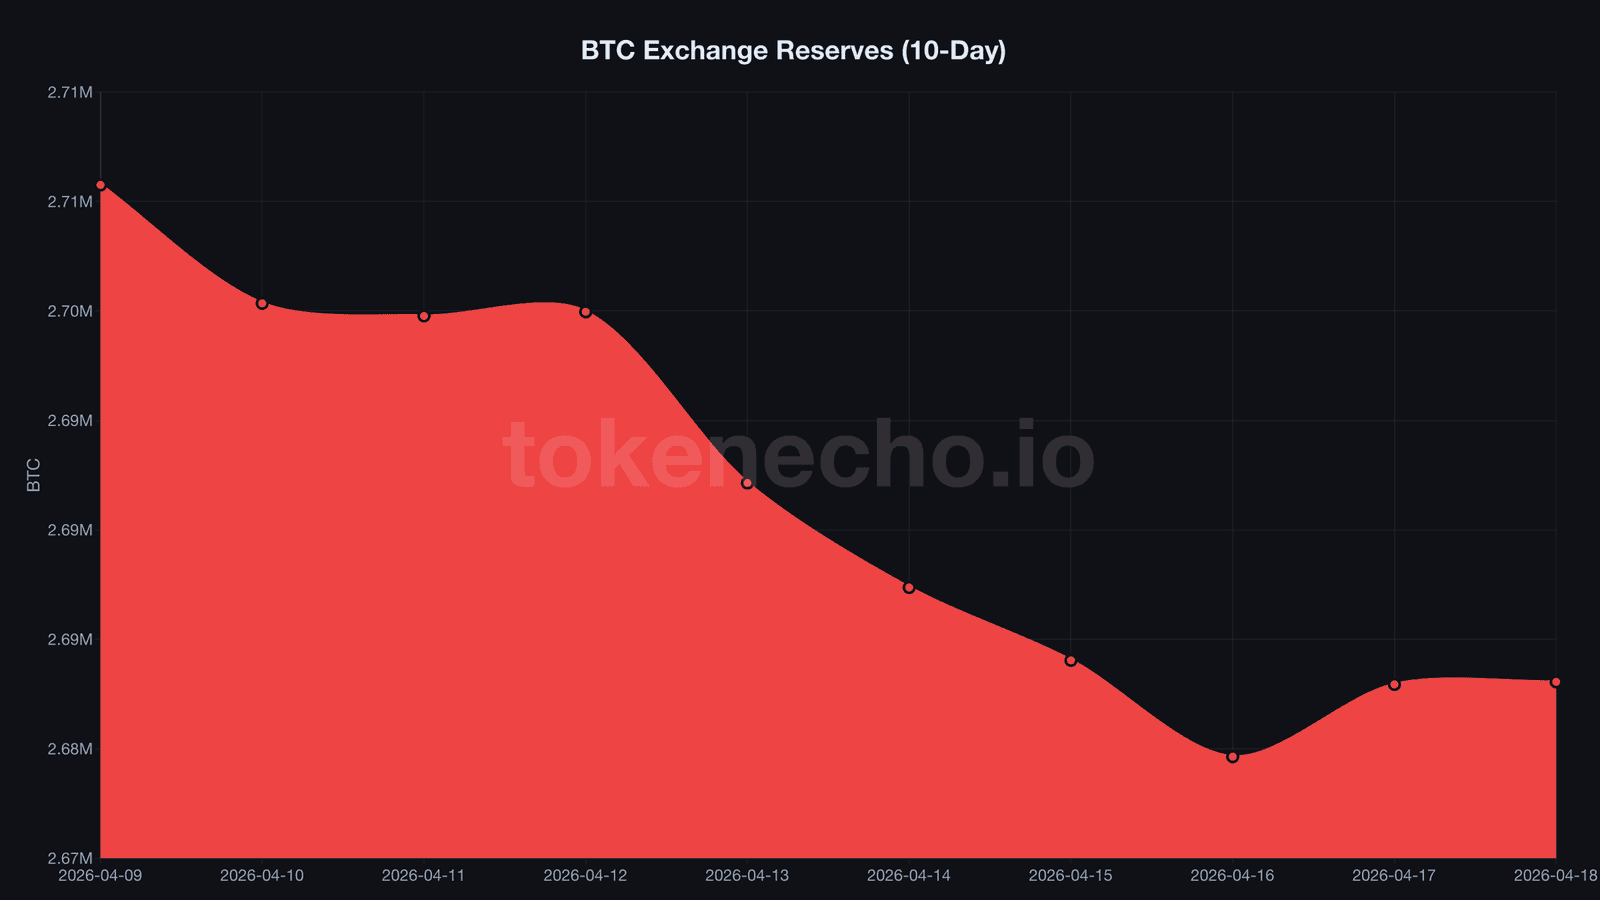
Reserves ticked up to 2,683,053 BTC by April 18 – a modest +3,418 from the cycle low. But the direction change matters more than the size. After nearly two weeks of relentless outflows, the tide just turned.
So why are the longest-standing holders – the ones who survived FTX, Luna, and every tariff scare – selling at a loss into a rally?
“Old whales are selling to TradFi,” CryptoQuant founder Ki Young Ju said earlier this week, pointing to persistent LTH-SOPR readings below 1.0.
LTH-SOPR, a metric tracking whether long-term holders (coins held 155+ days) sell at a profit or loss, reads 0.889. The average veteran seller is locking in an 11.1% loss. On April 15, it was worse – 0.769, a 23% hit. As we covered in our analysis of veteran holders crashing from profit to 23% loss, this isn’t a new phenomenon. It’s accelerating.
That’s not profit-taking. That’s capitulation at higher prices.
CDD, or coin days destroyed (a metric measuring the “age” of coins being moved), spiked to 19.6M on April 14 and has since collapsed to 8.6M. The old coins already moved. The flush may be largely complete.
On-chain data says sellers are thinning out. The fear index says the market doesn’t buy it.
Fear & Greed at 21 while BTC hits $78K – the widest gap this cycle
How does BTC trade at $78K – up 15% in two weeks – while the Fear & Greed Index reads 21?
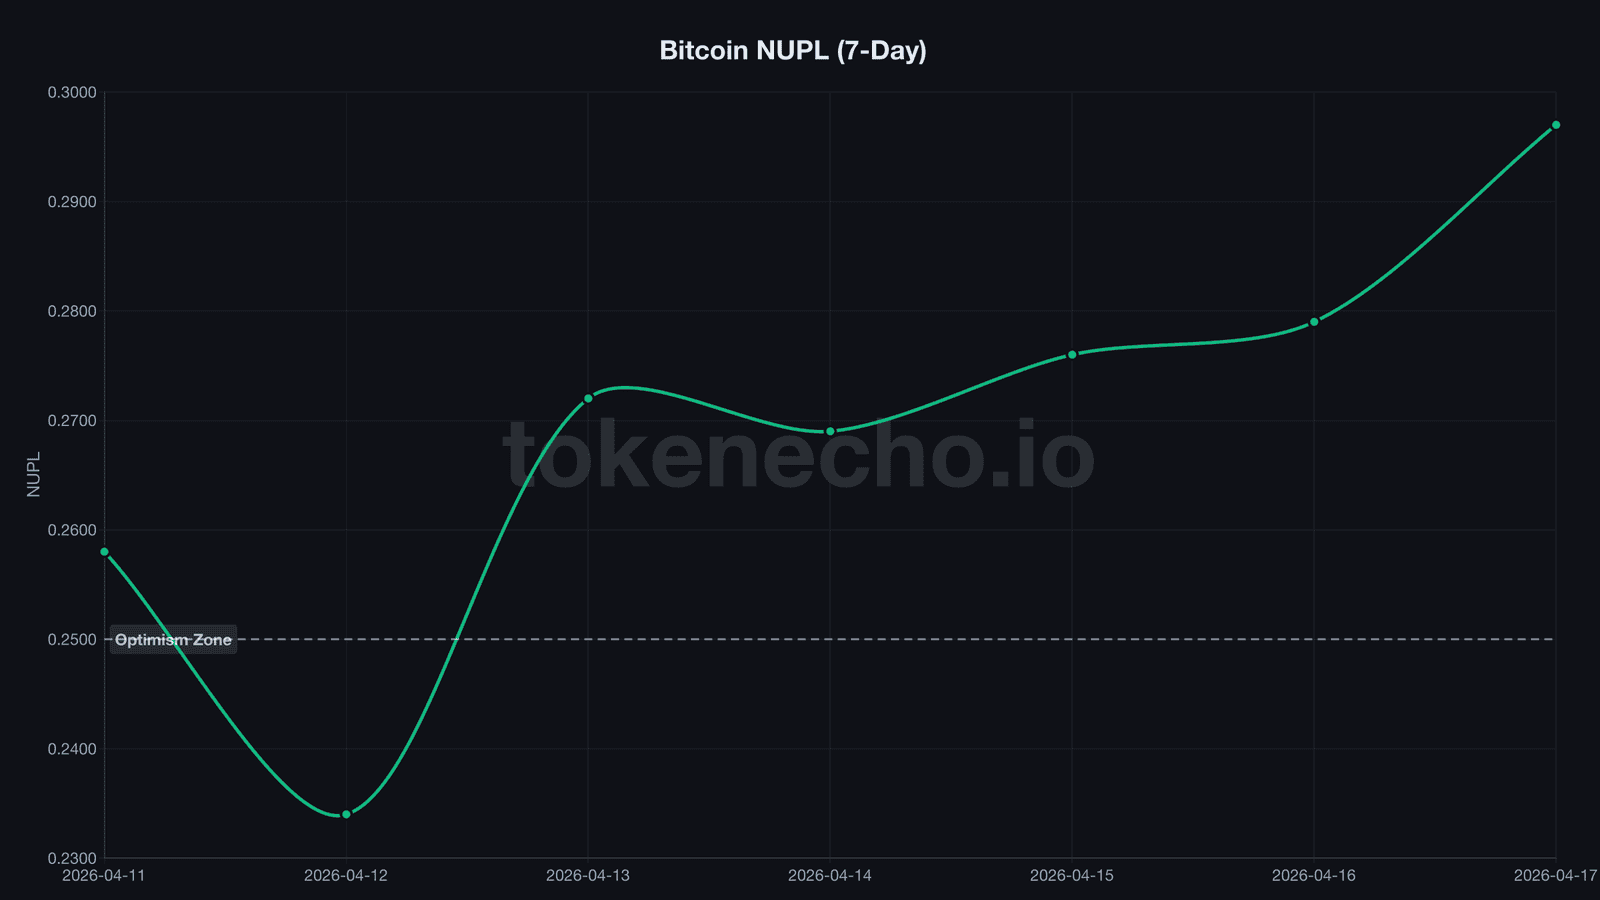
NUPL, or net unrealized profit/loss (the share of network-wide unrealized gains minus losses), jumped from 0.234 to 0.297 in just five days. That’s the fastest sentiment recovery since the post-FTX bounce in late 2022. The market’s crossing from “Hope” territory into the lower edge of “Optimism.”
But Alternative.me’s widely-cited fear gauge hasn’t gotten the memo. It sits at 21 – Extreme Fear – barely budging from the teens where it’s camped for over 50 days. It’s like watching a thermometer refuse to move while the room gets warmer.
This kind of divergence doesn’t last. Either price catches down to match the fear, or fear catches up to match the price.
Puell Multiple, a ratio comparing daily miner revenue to its 365-day average, reads 0.765. Miners are earning 23.5% less than their yearly average – recovering from the 0.638 cycle low on April 11, but still signaling a market paying below-average rates to its security providers.
SSR, the stablecoin supply ratio (BTC market cap divided by total stablecoin supply), rose to 11.39 from 10.81 a week ago. As BTC’s price climbs, each dollar of stablecoin buys less of it. The dry powder is still there – but it’s gotten more expensive to deploy. For more on reading these metrics, see our guide to on-chain data analysis.
November 2022 called – the setup looks familiar
The last time LTH-SOPR dropped below 0.80 while NUPL climbed from 0.18 to 0.30 was December 2022. BTC sat at $16,500. Long-term holders were selling at a 28% loss. SOPR hovered near 1.0 for weeks.
What followed: BTC rallied from $16,500 to $25,000 (+52%) in 60 days, then reached $31,000 (+88%) within 90 – all while LTH-SOPR stayed below 1.0. Veterans kept selling at a loss, and the price kept climbing without them.
Current setup rhymes: LTH-SOPR 0.889, NUPL recovering from 0.18 to 0.30, SOPR crossing back above 1.0. But the macro backdrop is different – a Hormuz ceasefire that expires April 22, unresolved tariffs, and a Fed chair transition looming in May. The on-chain architecture mirrors a major bottom. The geopolitics don’t.
On-chain scorecard (3 of 6 bullish)
- ✅ SOPR: 1.007 – positive, sellers in profit (bullish)
- ✅ Exchange reserves: 2,683,053 BTC – near cycle low, macro downtrend intact (bullish)
- ✅ NUPL: 0.297 – rapid recovery, entering Optimism zone (bullish)
- ⚠️ LTH-SOPR: 0.889 – veterans selling at 11% loss (capitulation – historically bullish but near-term supply risk)
- ⚠️ Puell Multiple: 0.765 – miners earning below average (caution)
- ⚠️ Exchange netflow: +3,301 BTC on Apr 17 – first inflow in 5 days (supply returning)
TokenEcho Verdict: Cautiously bullish
Direction: Cautiously bullish
Key level: $78,240 – the April 17 high. A daily close above this level confirms the breakout from the 10-week range.
Risk factor: The US-Iran ceasefire expires April 22. If negotiations fail and Hormuz closes again, the entire rally unwinds. The last time ceasefire talks collapsed, BTC dropped 3.7% in hours.
This is an analytical assessment, not financial advice.
What to watch next 48-72 hours
- $78,240 breakout with daily volume above $50B – bullish confirmation of a new trading range above $75K
- April 22 ceasefire deadline – extension means risk-on continues; collapse means a likely retest of $72K-$74K support
- Exchange netflow direction – if inflows stay above +3,000 BTC/day, the supply squeeze narrative weakens; if outflows resume, $80K becomes the next target
This analysis is part of our daily Bitcoin price tracking. See all previous analyses and key metrics on our hub page.
Veterans are selling every rally at a loss. ETFs are buying every dip with fresh billions. One side is going to be very wrong – and the ceasefire clock is ticking.
This is not financial advice. DYOR. Data as of April 18, 2026.
Sources:
- CoinGecko API – price, market cap, supply, volume
- CryptoQuant – SOPR, LTH-SOPR, NUPL, exchange reserves, netflow, CDD, Puell Multiple, SSR
- Alternative.me – Fear & Greed Index
- Farside Investors – ETF flow data
Leave a Reply