
🕑 6 min read
Spot buyers drained exchanges while derivatives traders loaded $34 billion in bets – somebody’s going to be wrong
Nobody trusted this rally two days ago. Sellers dumped 164,000 ETH onto exchanges during a 14% climb – textbook distribution into strength, the kind of move that usually signals smart money is cashing out while retail chases the green candle.
Then April 17 happened.
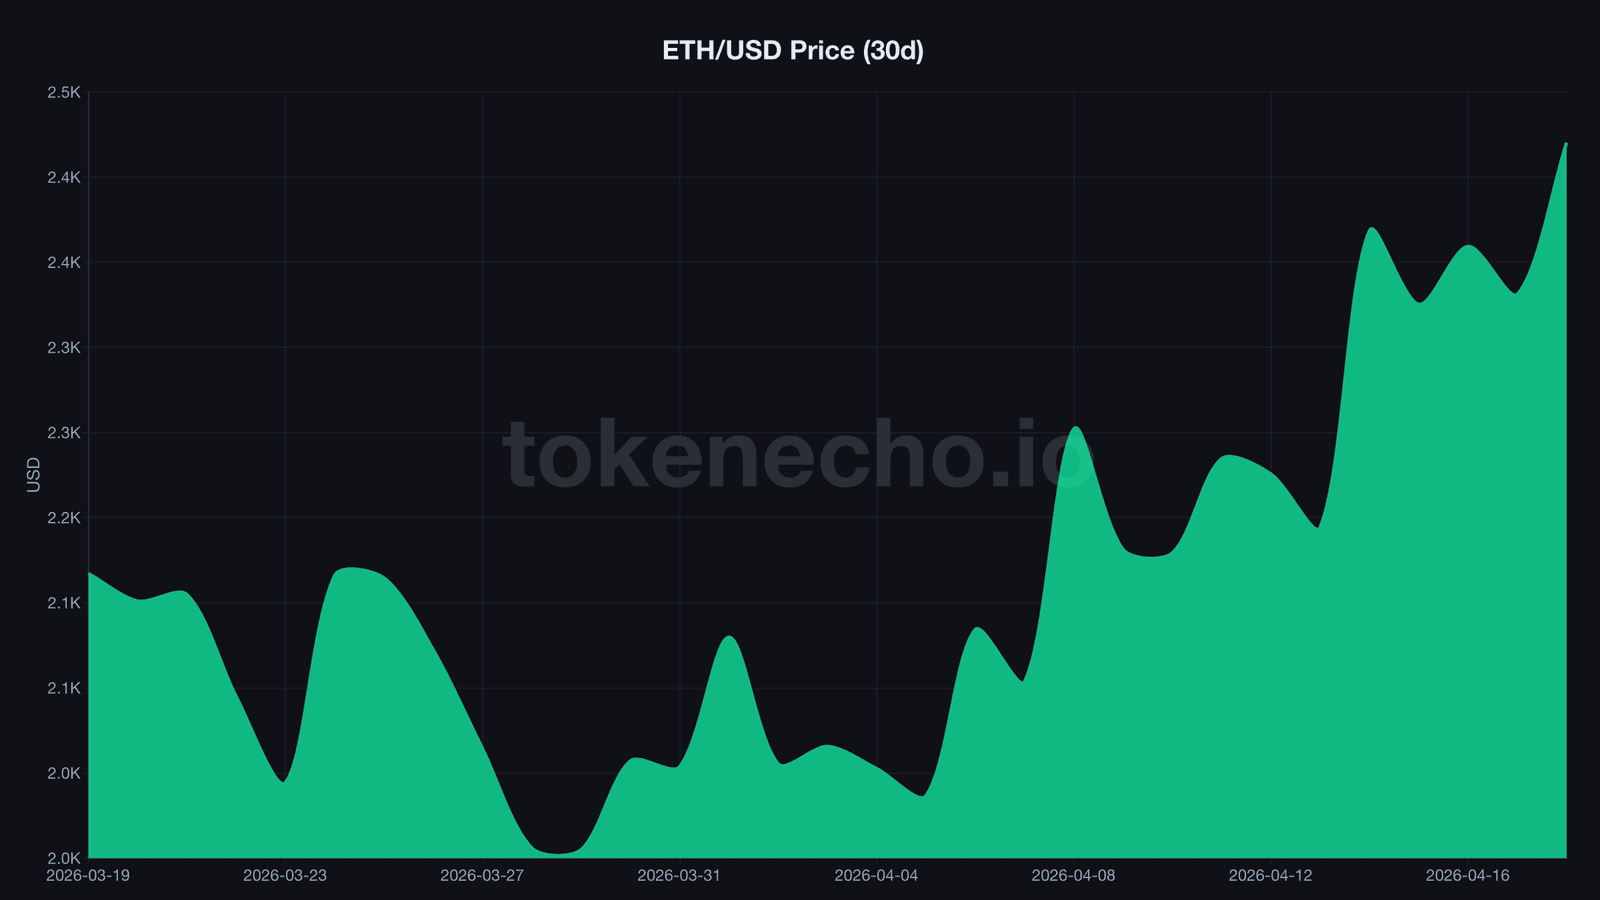
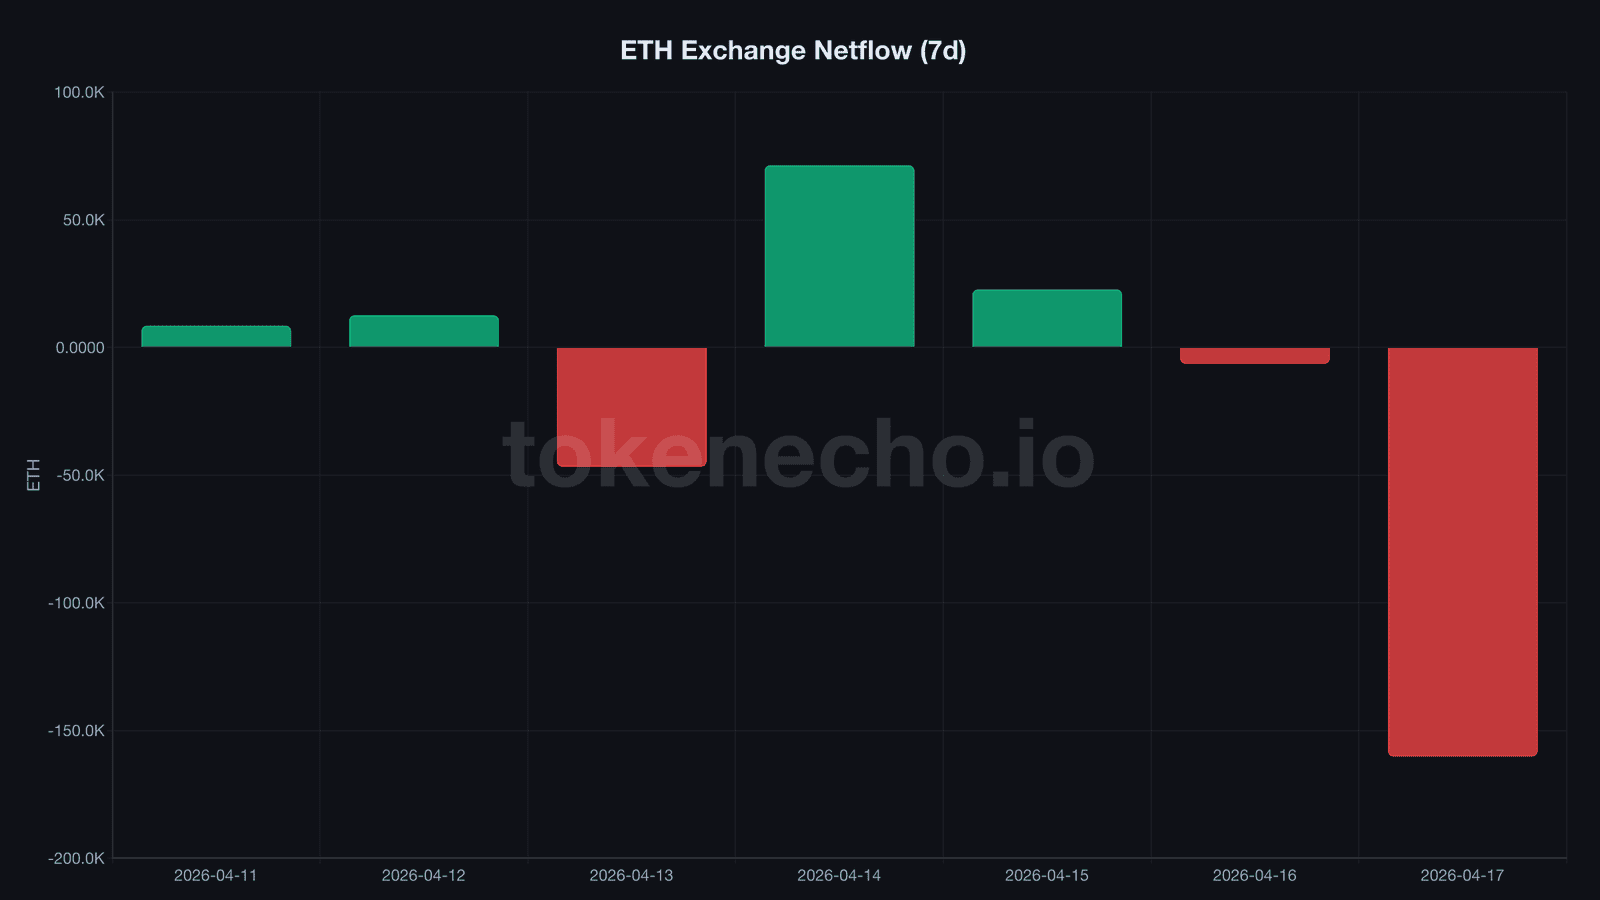
160,188 ETH left exchanges in a single day. That’s roughly $385 million at current prices – the largest outflow in two weeks – and it erased 10 days of selling pressure in one session. ETH trades at $2,405 as of April 18, up 7.5% on the week and 17% over the past fourteen days in what’s becoming the most contested ethereum price movement of Q2.
Key Takeaways
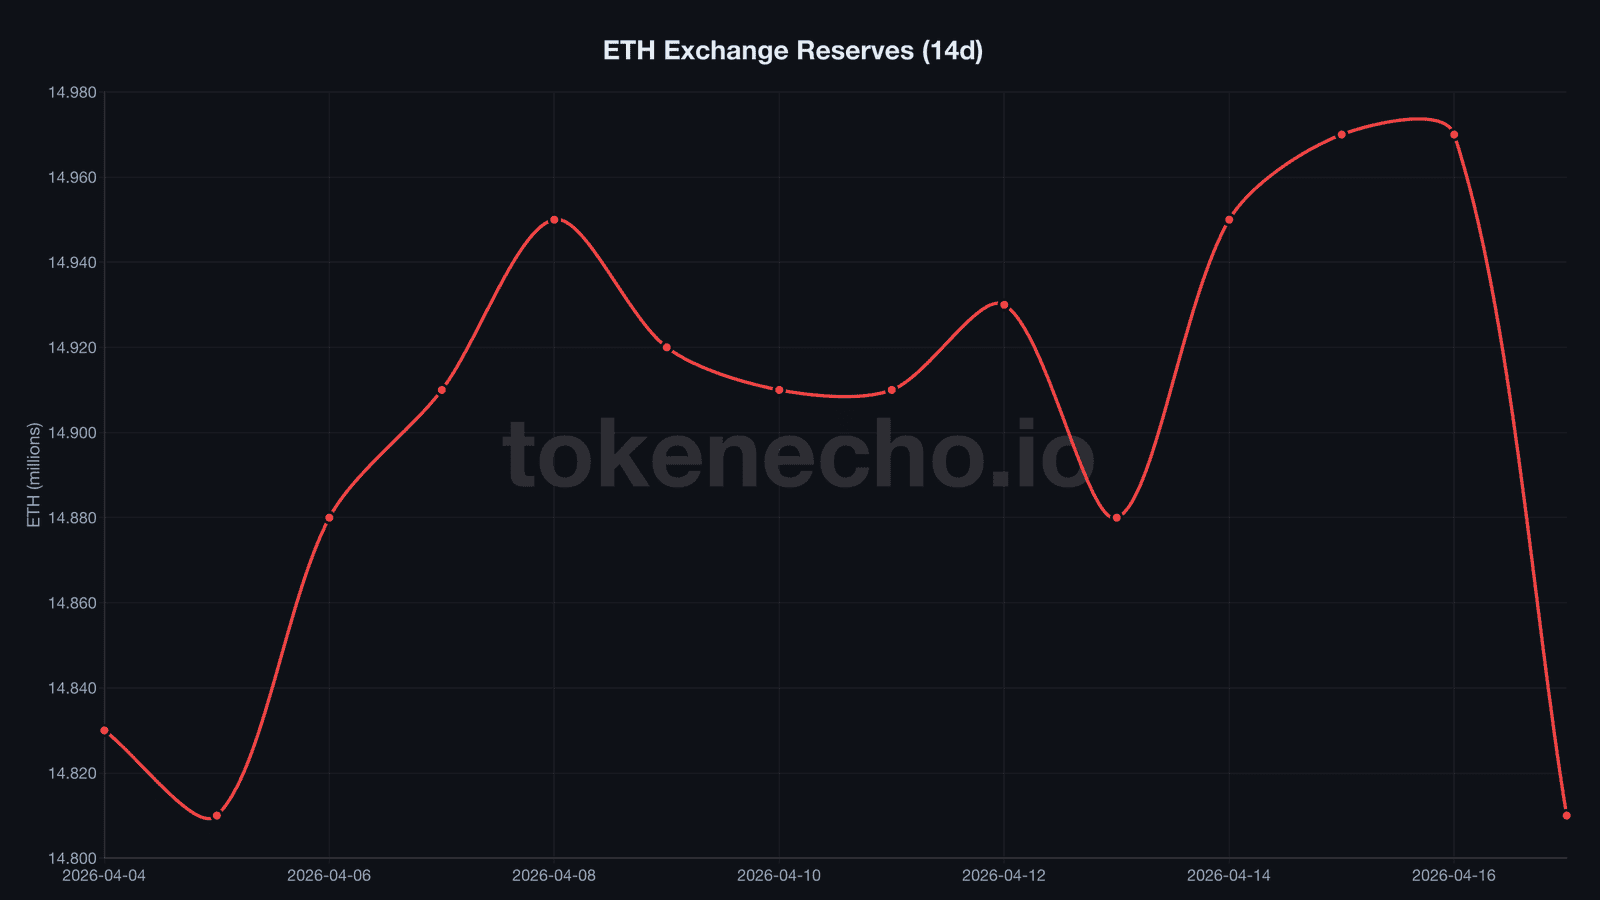
- 160,188 ETH ($385M) left exchanges on April 17 – the largest single-day outflow in two weeks – pushing reserves to 14.81M, a 14-day low
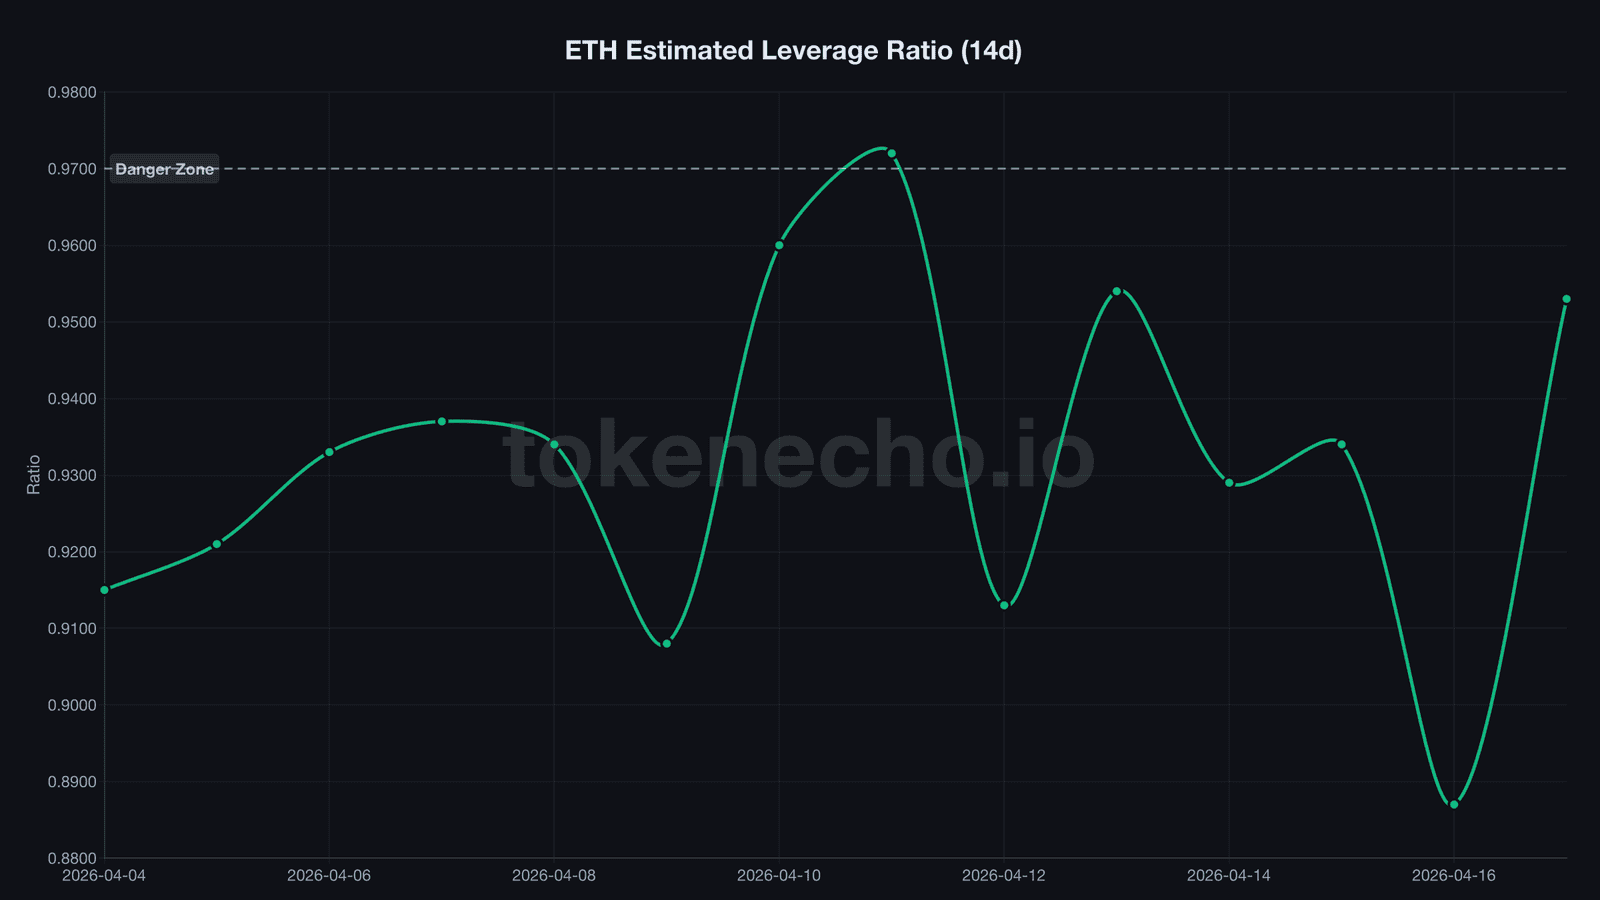
- Leverage ratio spiked 7.4% in 24 hours from 0.887 to 0.953, while open interest ballooned 26% to $34.2B – analysts warn a 4-6% OI drop would force $1.4-2B in liquidations
- ETH ETFs posted 7 consecutive days of inflows totaling over $400M – the first sustained buying streak after a 5-month, $2.8B exodus
| Metric | Today | 7d Ago | 30d Ago | Signal |
|---|---|---|---|---|
| Price | $2,405 | $2,237 | $2,190 | ▲ Bullish |
| Exchange Reserves | 14.81M | 14.91M | 15.84M | ▲ Bullish |
| Daily Netflow | -160,188 | +8,469 | -53,007 | ▲ Bullish |
| Leverage Ratio | 0.953 | 0.972 | ~0.947 | ⚠️ Caution |
| ETH/BTC | 0.0312 | 0.0307 | 0.0305 | — Neutral |
| ETF Daily Flow | +$127.4M | +$85.2M | -$46M | ▲ Bullish |
160,000 ETH vanished from exchanges – and reversed 10 days of selling
Two days ago, we covered how 164,000 ETH flooded exchanges while the price climbed 14%. Classic distribution.
April 17 flipped the script.
Exchange reserves, the total ETH held on centralized platforms, dropped to 14,807,565 – the lowest in two weeks. Binance alone shed 33,320 ETH.
That’s $80 million gone from one exchange in 24 hours.
The 30-day picture is even more dramatic. Over 1,034,000 ETH – roughly $2.5 billion – has drained from exchanges since mid-March. That’s 6.5% of all exchange-held supply quietly relocating to cold storage, staking contracts, and DeFi protocols.
Where did the April 17 exodus come from? The Strait of Hormuz reopened that day, triggering a global risk-on wave that wiped out $650 million in crypto shorts.
And someone – or many someones – used the cover of that chaos to pull $385 million off the table.
Spot markets and derivatives markets are telling two completely different stories right now. When that happens, one side is always wrong.
$34 billion in leverage bets and a ratio nearing the red zone
$34.2 billion. That’s how much is riding on ETH derivatives right now – a 26% surge in open interest built up almost entirely over the past two weeks.
But the more alarming number is the estimated leverage ratio, a metric that measures open interest relative to exchange reserves. It spiked from 0.887 to 0.953 in a single day. A 7.4% jump.
Why does 0.97 matter?
Because every time the leverage ratio breached that level in 2026, a liquidation cascade followed within 48 hours. On April 11, it touched 0.972. Two days later – crash to 0.887 as positions got wiped. Now it’s rebuilding to 0.953. Same pattern, higher stakes.
Analysts warned that a 4-6% decline in OI from these levels would trigger roughly $1.4 to $2 billion in forced unwinds across the derivatives market, an amount large enough to push ETH through any support level it’s currently holding. That’s not a forecast. It’s arithmetic.
The setup resembles draining water from a pool while someone keeps adding divers. Spot buyers pull ETH off exchanges, shrinking the denominator. Derivatives traders stack leverage on top, inflating the numerator. And the ratio keeps climbing toward the ledge.
Wall Street keeps buying what the spot market won’t hold
“2026 is the year of Ethereum,” said Geoff Kendrick, Standard Chartered’s head of digital assets research, in a note reiterating his $7,500 price target.
Wall Street agrees – with money, not just words.
ETH ETFs posted their seventh consecutive day of inflows on April 17. Fidelity’s FETH led with $84.1 million, and BlackRock’s ETHA added $30.8 million. The daily total hit $127.4 million.
For context, this is the first sustained institutional buying streak since a 5-month exodus that drained $2.8 billion from ETH products between November and March. April hasn’t just reversed the bleeding. It’s applied pressure in the opposite direction.
And it’s not just ETFs. Charles Schwab launched spot ETH trading this week, opening access to 46 million brokerage clients managing $1.5 trillion in assets. BitMine still holds 4.875 million ETH – 4.04% of total supply – despite reporting a $3.8 billion unrealized loss last quarter. CEO Tom Lee called ETH “the wartime store of value.”
That conviction doesn’t show up in leverage ratios. But it shows up in the price eventually.
The last time spot drained while leverage spiked
This pattern has a precedent. In January through March 2023 – three months after FTX collapsed – ETH exchange reserves declined steadily while leverage quietly rebuilt.
Nobody trusted the recovery then either. ETH had just crashed from $1,700 to $1,100, and FTX contagion was still rippling through CeFi lending desks.
ETH sat at roughly $1,200 in January 2023. By April, it hit $2,100 – a 75% gain in 90 days, driven almost entirely by the same dynamic playing out now: spot accumulation underneath a fragile derivatives structure that eventually squeezed shorts into oblivion.
The critical difference? OI in early 2023 hovered around $6-8 billion. Today it’s $34.2 billion – five times larger. A squeeze from these levels would be more violent. So would a cascade in the wrong direction.
On-chain scorecard (3 of 6 bullish)
- ✅ Exchange Reserves: 14.81M, declining (-1.03M 30d) – supply squeeze building
- ✅ Exchange Netflow: -160,188 ETH, largest outflow in 2 weeks – accumulation
- ✅ ETF Inflows: 7-day streak, $127.4M daily – institutional demand confirmed
- ⚠️ Leverage Ratio: 0.953, climbing fast toward 0.97 – overheated
- ⚠️ Open Interest: $34.2B (+26%) – derivatives overextended
- ❌ ETH/BTC: 0.0312, near 5-year floor – still underperforming Bitcoin
TokenEcho Verdict
Direction: Cautiously bullish
Key level to watch: $2,462 – today’s intraday high and nearest resistance. A daily close above this level with declining exchange reserves would confirm spot buyers are in control.
Risk factor: Leverage ratio breaching 0.97, which triggered liquidation cascades every time it crossed that threshold in 2026. A 4-6% OI pullback from $34.2B means $1.4-2B in forced unwinds – and ETH’s 51% distance from ATH means trapped supply sits above.
This is an analytical assessment, not financial advice.
What to watch (next 48-72 hours)
- Leverage ratio crossing 0.97 – historically precedes liquidation cascade within 48h. Above $2,400, longs get squeezed first
- Sustained exchange outflows above 50K ETH/day – confirms accumulation isn’t a one-day anomaly
- ETF inflow streak hitting day 8 – would mark the longest positive run since ETH products launched
This analysis is part of our daily Ethereum price tracking. See all previous analyses and key metrics on our hub page.
Spot buyers drained $385M in one day. Derivatives traders loaded $34B in bets. One side walks away right – which one breaks first will define ETH’s trajectory into May.
This is not financial advice. DYOR. Data as of April 18, 2026.
Sources: CoinGecko, CryptoQuant, Farside Investors
Leave a Reply