
🕑 6 min read
Exchange reserves reversed a month-long decline in just 10 days – $381M in ETH is back on trading platforms
ETH just posted its strongest two-week stretch of 2026. And during that exact window, 164,000 ETH – roughly $381 million – flowed right back onto exchanges.
The contradiction doesn’t fit neatly into anyone’s narrative. Price charts say recovery. On-chain data says distribution. One of them is wrong.
Key Takeaways
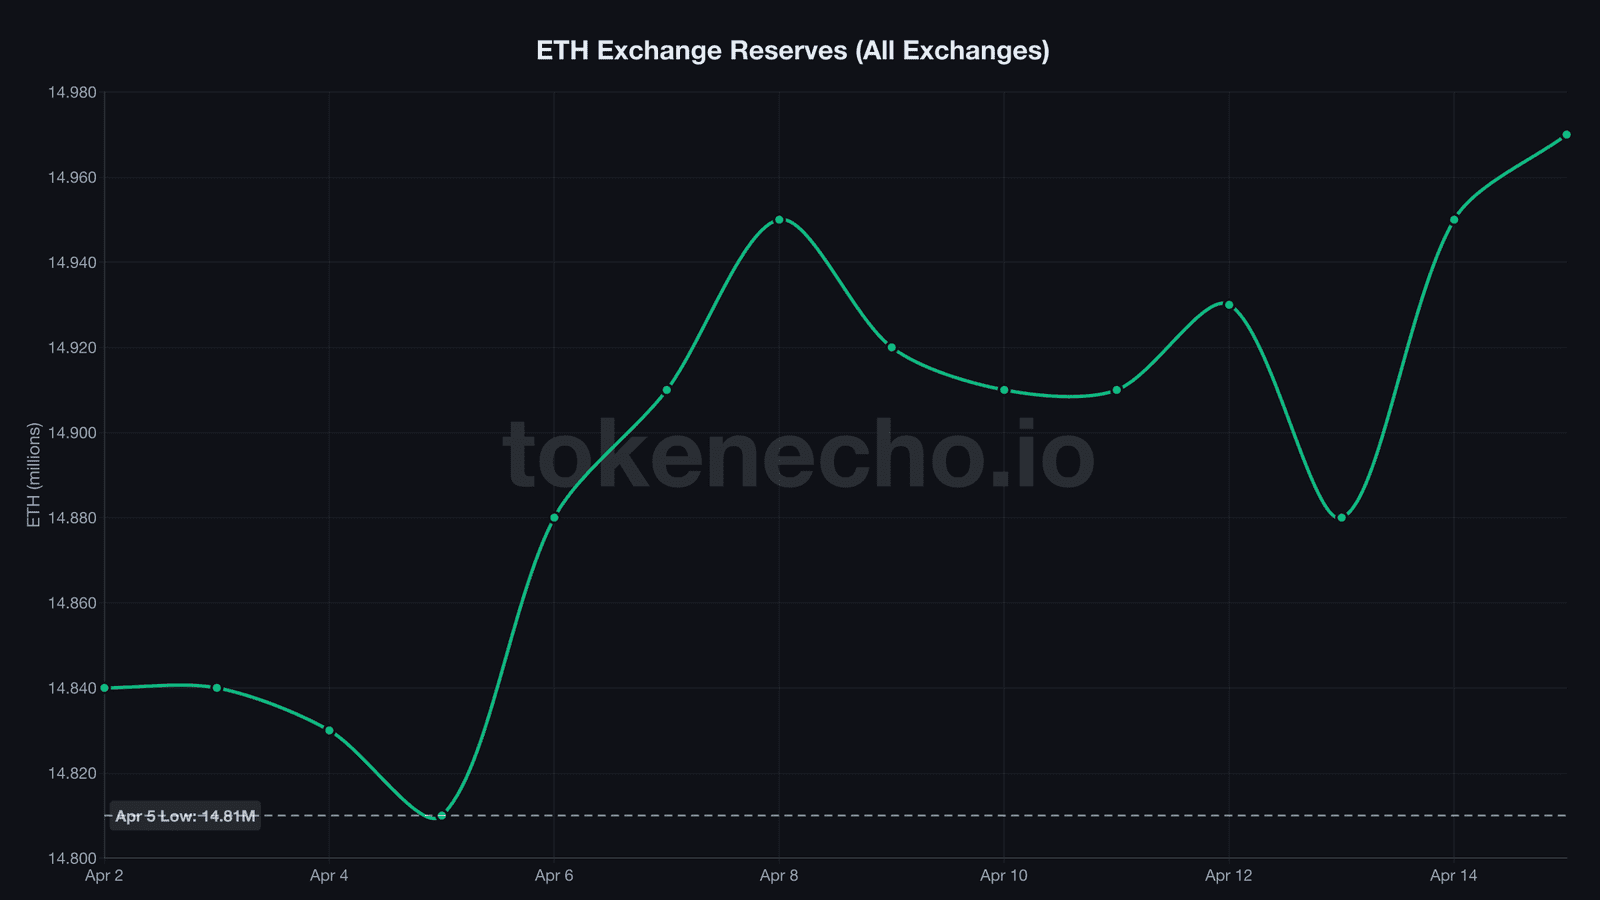
- ETH exchange reserves, the total amount of Ethereum held on trading platforms, climbed from 14.81M to 14.97M in 10 days – 164,000 ETH ($381M) returned after the longest outflow streak since early March. The supply squeeze narrative is over.
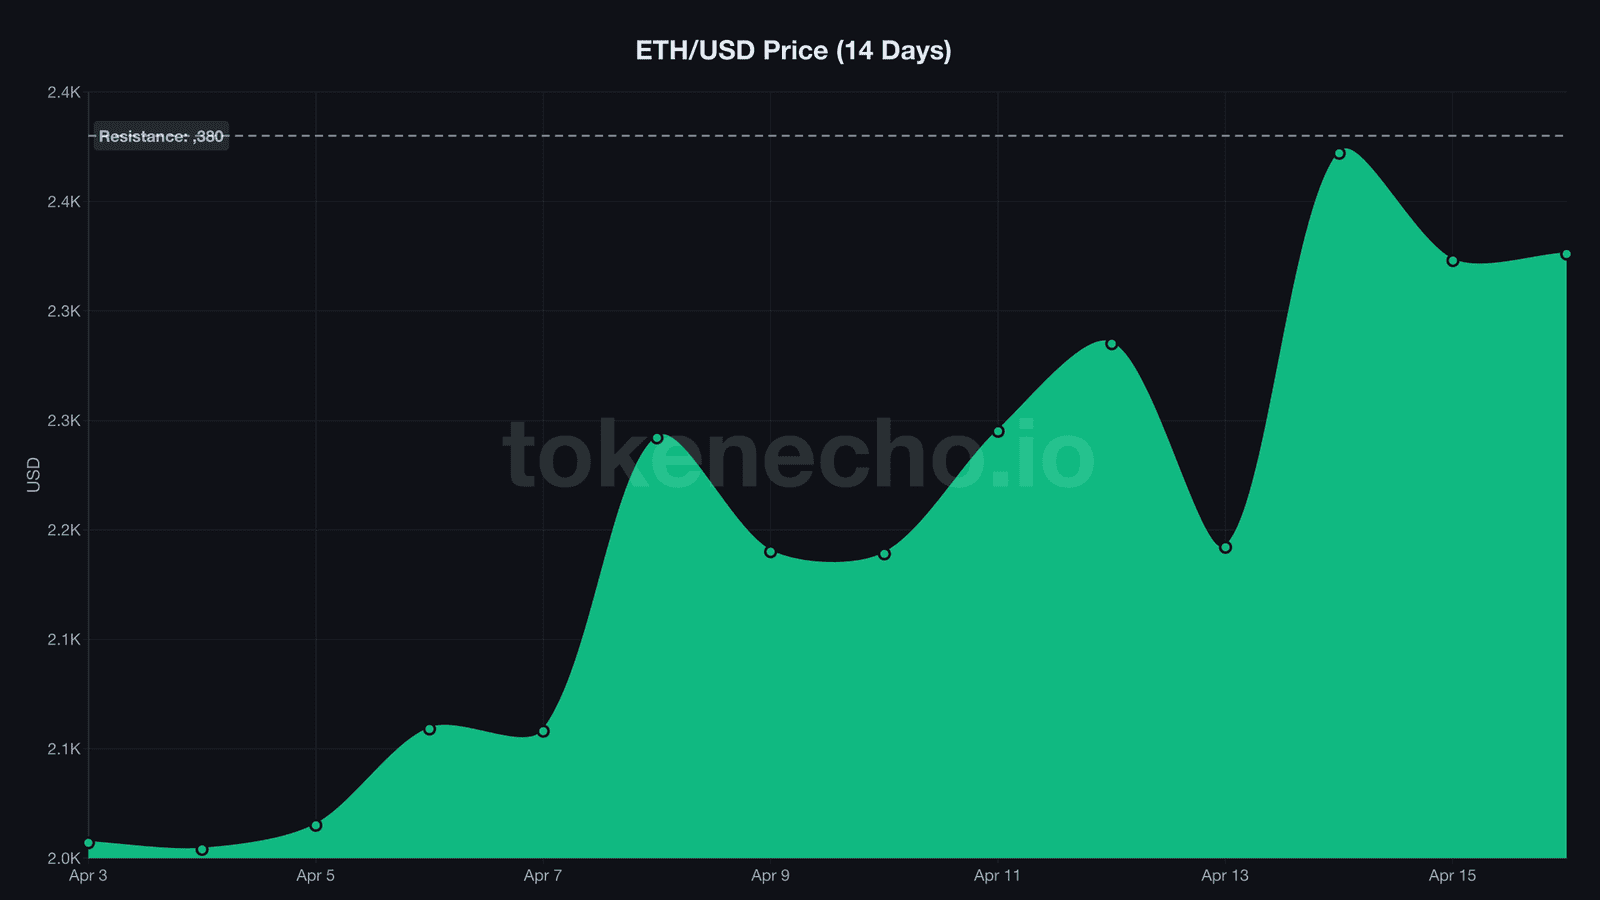
- April 14 saw +71,267 ETH net inflow ($166M) – the largest single-day deposit since the rally began – the same day ETH touched its $2,380 high.
- ETH/BTC ratio sits at 0.0313, barely above its 5-year floor of 0.0305. Bitcoin-denominated traders aren’t buying the bounce.
| Metric | Apr 16 | 7d Ago | 30d Ago | Signal |
|---|---|---|---|---|
| ETH Price | $2,324 | $2,191 | ~$2,330 | — Flat 30d |
| Exchange Reserves | 14.97M ETH | 14.92M | ~15.01M | ⚠️ Rebuilding |
| Net Flow (10d total) | +164,129 ETH | Outflows | Outflows | ⚠️ Distribution |
| ETH/BTC Ratio | 0.0313 | 0.0307 | 0.0305 | ▲ Slight recovery |
| 24h Volume | $19.1B | ~$15B | ~$13B | ▲ Rising |
| ETH ETF Flows (wk) | +$53M | +$120M | -$93M | ▲ Positive |
| ATH Distance | -53.0% | -55.7% | -58.7% | — Narrowing |
The supply squeeze reversed – 164,000 ETH came home
14,974,168 ETH. That’s how much now sits on exchanges as of April 15, according to CryptoQuant – approaching the 15.01 million level last seen on March 31.
Ten days ago, the number was 14,810,039. We’ve been tracking the reserve drain since early April, when $379 million in ETH left exchanges over six days and analysts proclaimed a multi-billion-dollar supply squeeze building. That drain just reversed. Violently.
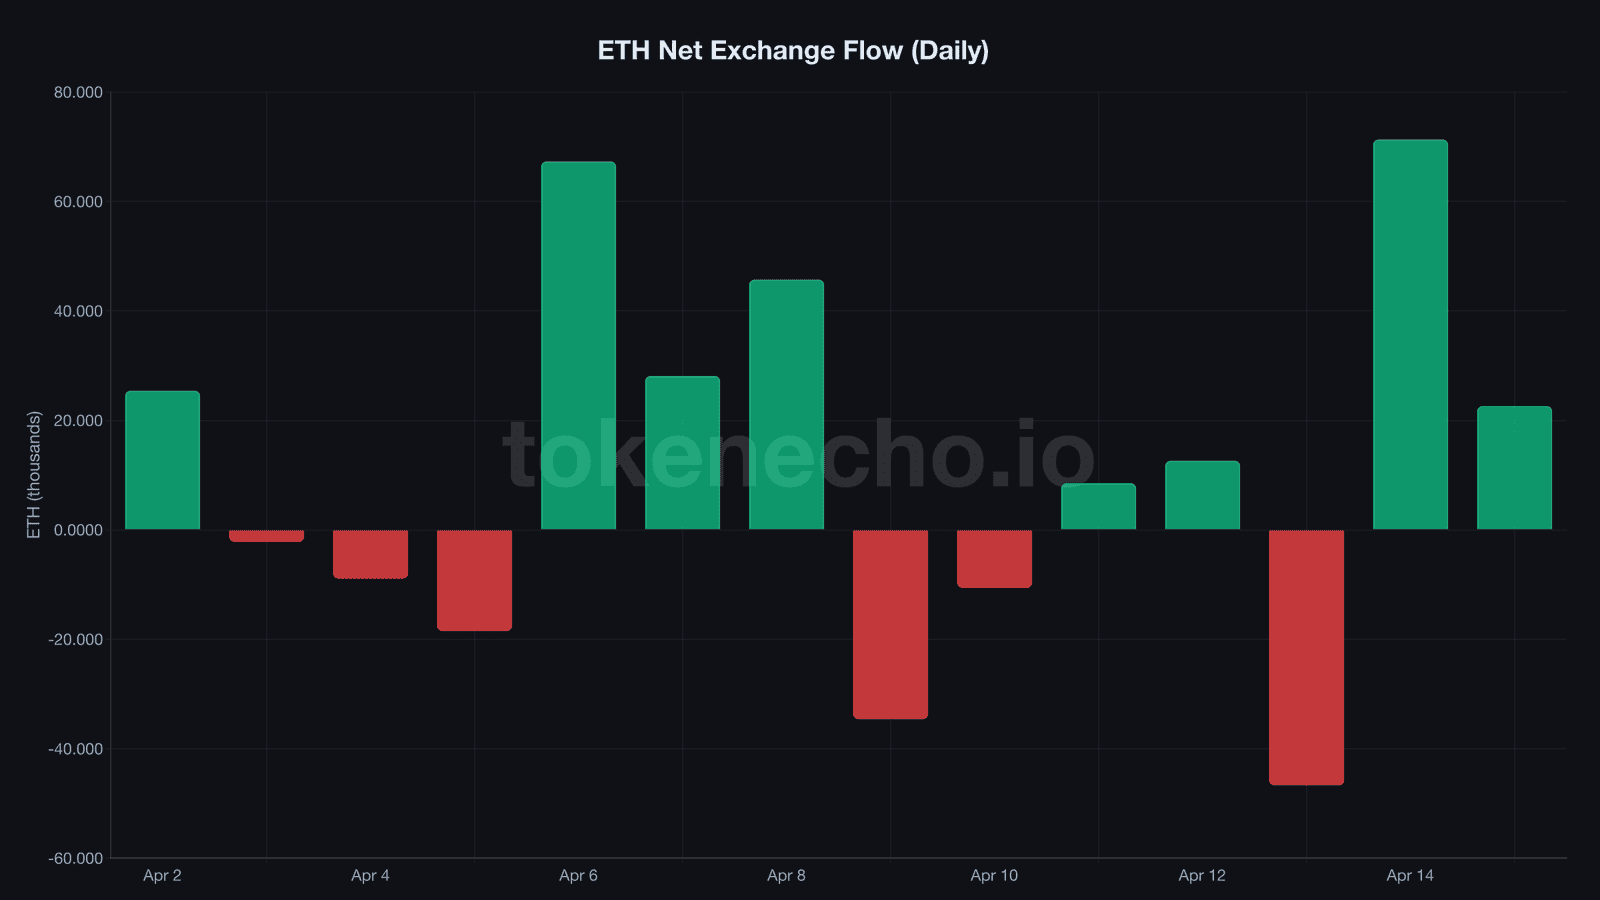
Since April 5, exchange net flows have been positive on 8 of 10 trading days. The net result: +164,129 ETH returned to platforms where it can be sold. That’s $381 million at current prices – enough to wipe out a month of accumulation in less than two weeks.
And it wasn’t gradual. April 6 saw +67,280 ETH flow in. April 8 added +45,668. But the real spike came on April 14: +71,267 ETH in a single day. That was the same day ETH touched $2,380, its highest since mid-March.
It’s the crypto equivalent of watching movers load boxes into a truck while the open house sign is still on the lawn. The price says “opportunity.” The exchange flows say someone’s already leaving.
Someone deposited $166M the day ETH hit its peak
Who’s selling into a 14% rally?
The top-10 deposit data – a CryptoQuant metric tracking the largest individual exchange deposits – paints the picture. On April 10, the ten biggest deposits totaled 239,186 ETH. That’s roughly $556 million from a handful of wallets in a single day.
April 13 brought another 163,790 ETH from large depositors. And April 15 added 143,240 ETH. These aren’t retail panic sellers fumbling through MetaMask. These are whales timing exits with surgical precision.
Blockchain analytics firm Santiment flagged a related pattern, reporting that small retail traders have been selling ETH “aggressively” since the 17% bounce from March 29 lows – interpreting the entire rally as a “bull trap.” When retail AND whales dump into the same bounce, the confluence isn’t encouraging.
The ETH/BTC ratio, a gauge of Ethereum’s strength relative to Bitcoin, barely budged through all of this. It sits at 0.0313. That’s a whisper above its 5-year floor of 0.0305 set in early April. ETH gained 14% in dollars but almost nothing against BTC. That’s not what conviction looks like.
CLARITY Act meets on-chain skepticism on the same day
The headlines look bullish today. The SEC hosts its CLARITY Act roundtable on April 16, a public discussion about stablecoin yield rules and digital asset classification that could accelerate crypto legislation before the August recess. The Glamsterdam upgrade – Ethereum’s biggest overhaul since The Merge, introducing enshrined proposer-builder separation – launched its devnet and targets a June mainnet date. And ETH ETFs posted their fourth straight week of net inflows, with Fidelity’s FETH pulling $38 million on April 14 alone.
But the CLARITY Act has hit a wall. Banks oppose the stablecoin yield provision because they fear up to $500 billion could drain from deposits into stablecoins paying 3-4%. And Glamsterdam’s June target is soft – Base’s engineering team publicly warned that adding FOCIL alongside ePBS could push the upgrade into 2027.
“A daily close above $2,480 would confirm the triangle breakout, opening the door for a rally toward $2,900,” said Ali Martinez, a widely followed crypto analyst.
That level is 6.7% above the current price. And the on-chain data suggests sellers will be waiting there.
What caught our attention is the disconnect between fund flows and exchange deposits. ETF money flows in through one door. Whale deposits walk out through another. Both forces can’t dominate simultaneously. Something will break first.
Every ETH bounce since August 2025 produced this same signature
ETH has spent eight months trapped in this loop. Price bounces, exchange reserves climb, the bounce gets sold. From the $4,946 ATH in August 2025 to today’s $2,324 – a 53% slide – nearly every counter-rally produced the same reserve pattern. Reserves climb during the bounce, peak just before the reversal, then drain as the next leg down begins.
The current 164,000 ETH reversal matches that tempo. Reserves at 14.97M are approaching the 15.01M level that marked the March 31 local top – the last peak before the plunge to April 5 lows.
What IS different: the catalyst stack is stronger than any previous bounce. The CLARITY Act and Glamsterdam give this rally structural backing that dead-cat bounces in November, January, and February didn’t have. If either delivers, a genuine demand shock could overwhelm the distribution. But catalysts haven’t broken this pattern yet. ETH is still down 53% from its all-time high and every bounce so far has been an exit ramp.
On-chain scorecard (2 of 6 bullish)
- ✅ Price momentum: +14.22% in 14 days, strongest rally since January
- ✅ ETH ETF flows: Net positive in April, +$53M on April 14
- ⚠️ Exchange reserves: 14.97M ETH, approaching March 31 peak, +164K in 10 days
- ⚠️ ETH/BTC ratio: 0.0313, barely above 5-year floor of 0.0305
- ❌ Net exchange flow: +71K ETH on Apr 14, +23K on Apr 15 – inflows accelerating
- ⚠️ Whale deposits: Top-10 deposits averaged 138K ETH/day over last 6 sessions
TokenEcho Verdict
Direction: Cautiously bearish
Key level to watch: $2,380 resistance – ETH rejected here on April 14 and again on April 16. A daily close above $2,480 would flip the narrative from distribution to breakout.
Risk factor: A positive CLARITY Act outcome or confirmed Glamsterdam June date could trigger institutional inflows that overwhelm the distribution signal. On the downside, $2,200 must hold – that’s where the April 8 Iran ceasefire rally first gained traction.
This is an analytical assessment, not financial advice.
What to watch (next 48-72 hours)
- $2,380 breakout with daily close – if ETH clears this resistance while exchange net flows turn negative, the distribution thesis crumbles
- CLARITY Act roundtable language – any signal of bipartisan support for stablecoin yields could trigger an ETH-specific bid, since DeFi yield infrastructure runs overwhelmingly on Ethereum
- Exchange reserves below 14.90M – a drop below this level would confirm the distribution wave exhausted itself and accumulation resumed
This analysis is part of our daily Ethereum price tracking. See all previous analyses and key metrics on our hub page.
Exchange reserves say distribution. Price momentum says rally. The CLARITY Act roundtable could break the tie – or it could change nothing at all.
This is not financial advice. DYOR. Data as of April 16, 2026.
Sources: CoinGecko, CryptoQuant, Santiment, Ali Martinez / Benzinga
Leave a Reply