
🕑 7 min read
BTC holds $74,286 as the sharpest LTH-SOPR whipsaw since March exposes who’s selling and who’s quietly accumulating at new cycle-low reserves.
Bitcoin barely moved on Wednesday. Up 0.15% – the kind of day that doesn’t make anyone’s portfolio alert go off.
But something violent happened underneath. Long-term holders – the cohort that survived FTX, Luna, and COVID without flinching – swung from 22.8% profit to 23.1% loss in just 48 hours. And while they bled, 19,107 BTC worth $1.42 billion disappeared from exchanges in six days, pushing reserves to a new 2026 low.
The price doesn’t care. The on-chain data screams.
Key takeaways
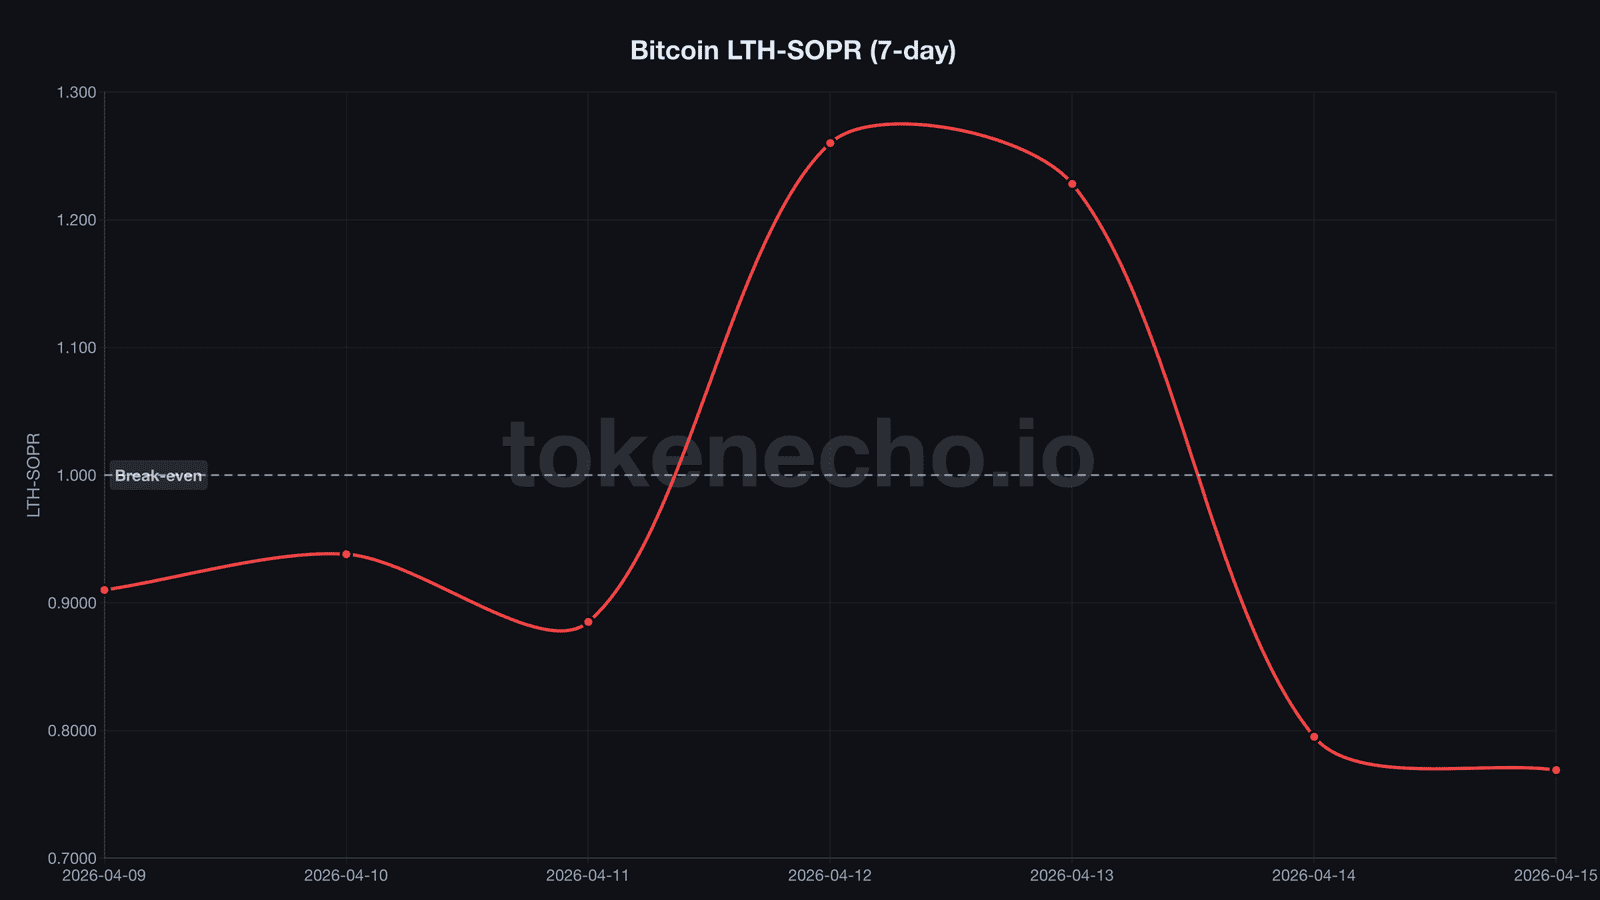
- LTH-SOPR, a metric tracking whether long-term holders sell at profit or loss, crashed from 1.228 to 0.769 in two days – the sharpest profit-to-loss reversal since March 22. Veterans are capitulating again.
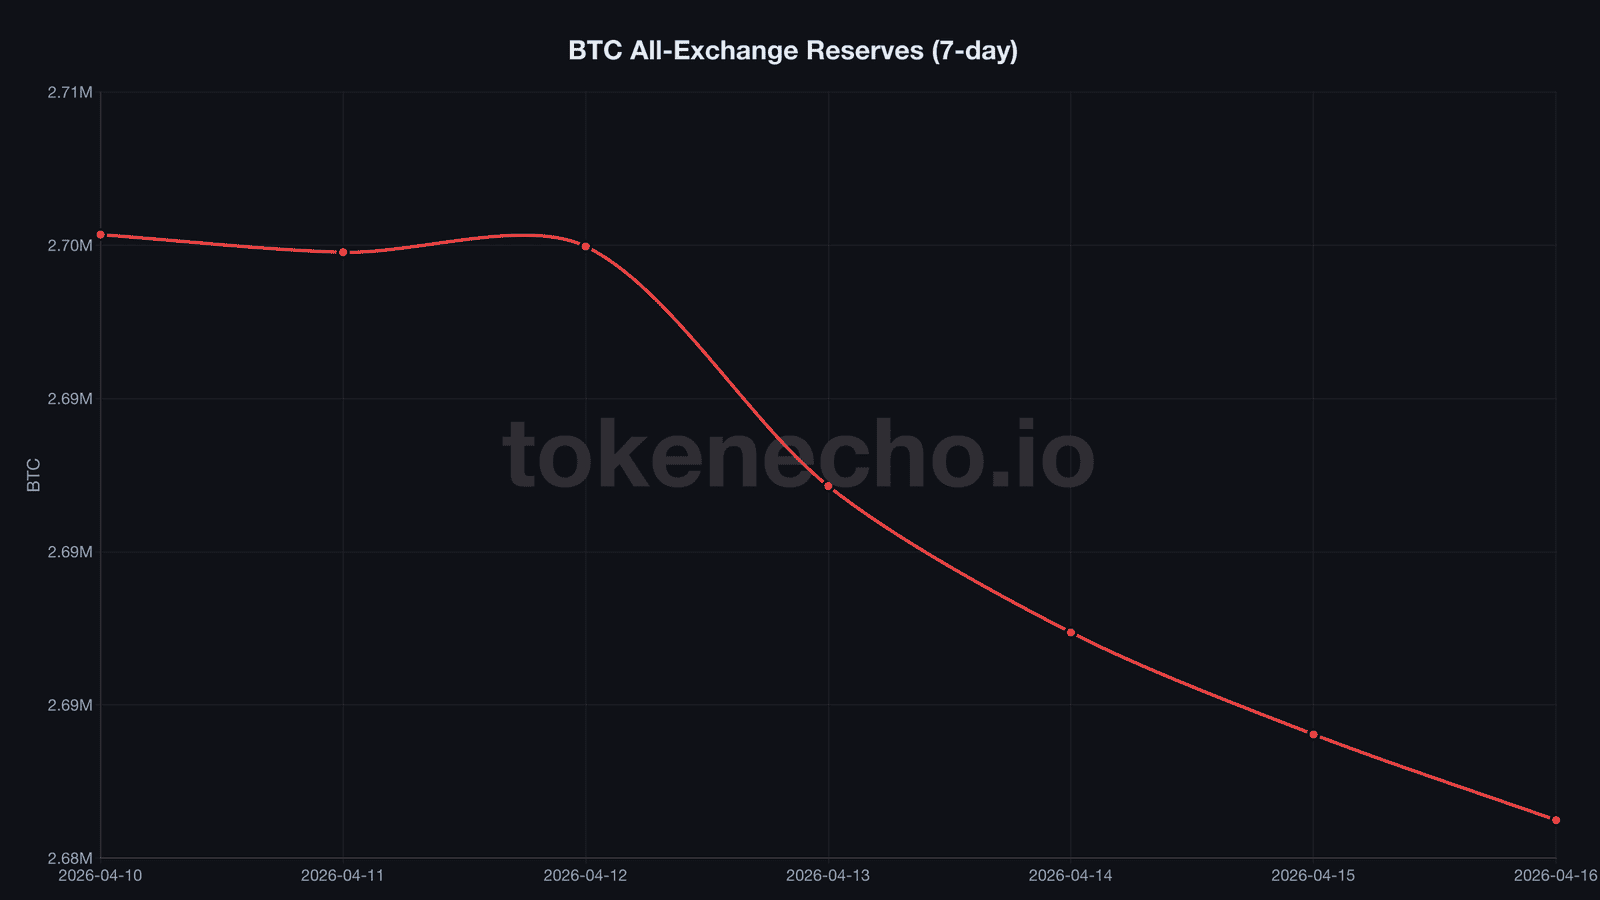
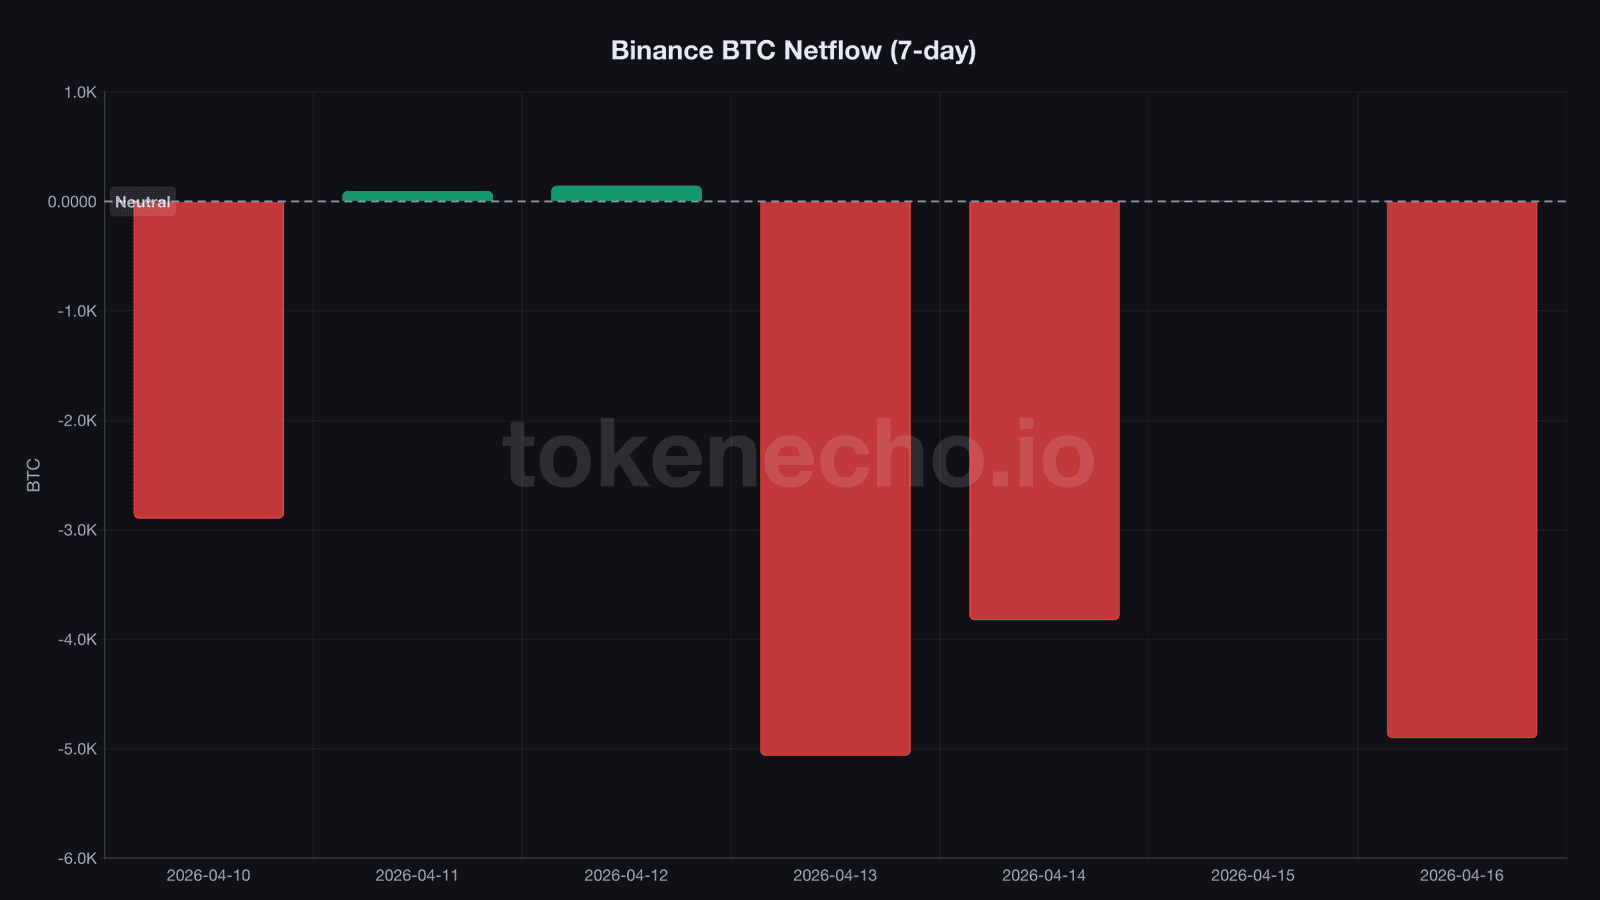
- Exchange reserves dropped to 2,681,239 BTC, a new 2026 cycle low. Binance alone shed 13,558 BTC ($1.01 billion) in six days – that’s 71% of all exchange outflows.
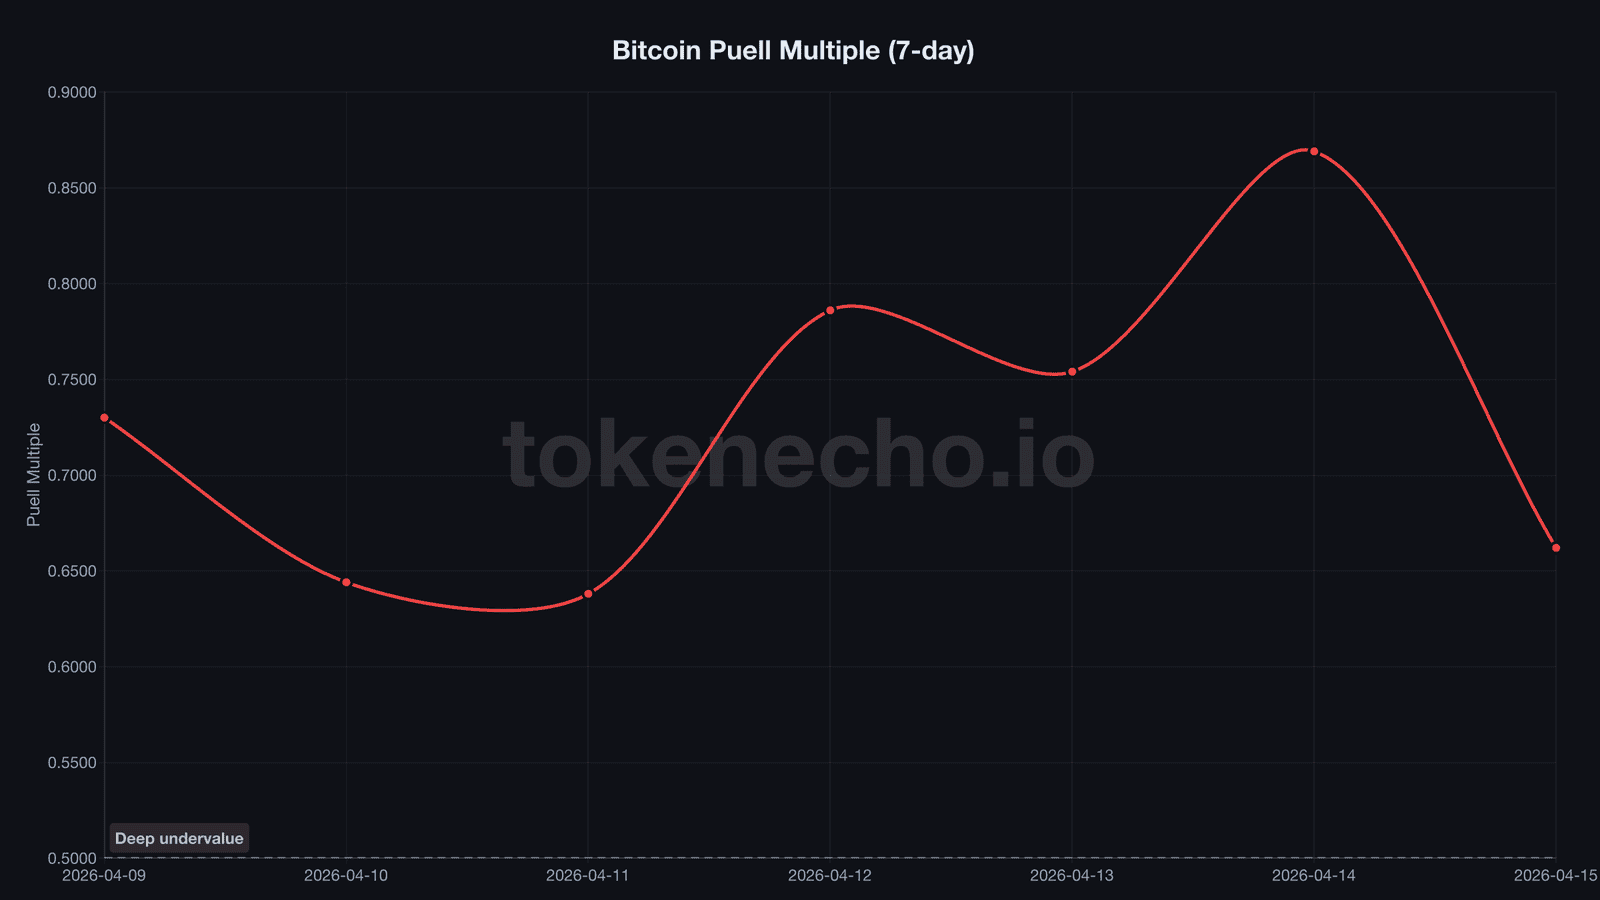
- Miner revenue collapsed 24% overnight as the Puell Multiple fell from 0.869 to 0.662, while ETF flows whipsawed from -$291 million to +$411 million in a single day.
| Metric | Apr 16 | 7d ago | 30d ago | Signal |
|---|---|---|---|---|
| BTC Price | $74,286 | $70,783 | $73,666 | ▲ Bullish |
| SOPR | 0.998 | 1.000 | ~0.993 | ⚠️ Caution |
| LTH-SOPR | 0.769 | 0.910 | ~0.820 | ❌ Bearish |
| Exchange Reserves | 2.681M BTC | 2.700M | ~2.710M | ▲ Bullish |
| Puell Multiple | 0.662 | 0.730 | ~0.645 | ⚠️ Caution |
| NUPL | 0.276 | 0.246 | ~0.188 | ▲ Bullish |
| Leverage (Binance) | 0.180 | 0.169 | ~0.237 | ▲ Bullish |
Long-term holders flipped from profit to capitulation in 48 hours
On April 13, LTH-SOPR – which measures whether long-term holders sell above or below their cost basis – printed 1.228. That’s a 22.8% average profit. Healthy.
Two days later, it cratered to 0.769.
That’s not a dip. That’s a completely different group of sellers. The ones who bought below $40,000 took their money and left on Sunday. By Tuesday, the exits were cycle-top buyers – people who purchased north of $90,000 and can’t stomach watching 23% of their position evaporate.
CDD, a metric tracking how many “old” coins move on a given day, spiked to 19.6 million on April 14. For context, the 365-day average sits around 11.2 million – so nearly double the normal volume of aged coins moved in a single session.
Then silence. CDD collapsed to 7.0 million by April 15. The selling exhausted itself almost overnight.
SOPR, the broader metric covering all holders regardless of holding period, slipped back to 0.998. Below 1.0 again. The average Bitcoin seller is locking in losses – just days after the 46-day extreme fear streak finally ended.
It’s like a relay race where the lead runner crosses the finish line in profit, then hands the baton to someone already limping. But the stadium keeps emptying – not of spectators. Of supply.
Exchange reserves hit a 2026 low – and Binance lost 71% of it
Everyone assumes capitulating sellers dump coins onto exchanges. They don’t always stay.
All-exchange reserves fell to 2,681,239 BTC on April 16, according to CryptoQuant – a new cycle low and the deepest supply squeeze we’ve seen this year. Over the past six days, 19,107 BTC walked off trading platforms. At today’s prices, that’s $1.42 billion moved to cold storage, custody solutions, or institutional vaults.
Binance bore the brunt. The world’s largest exchange shed 13,558 BTC in the same window – accounting for a staggering 71% of all outflows from every tracked exchange. On April 16 alone, 4,904 BTC left Binance in a single net outflow, dropping reserves to 620,499.
So who’s absorbing it all?
Strategy bought 13,927 BTC for $1 billion on April 13 – pushing their total to 780,897 BTC and nudging Saylor’s average cost basis of $75,577 uncomfortably close to the current spot price. BlackRock’s IBIT captured $285 million on April 15 alone. And whoever else is accumulating isn’t doing it on-exchange – they’re pulling coins straight off the grid.
We’ve tracked this drain for weeks. What caught our attention isn’t the direction – outflows have been persistent since mid-March. It’s the acceleration. Reserves dropped faster in the past six days than in any comparable stretch since the post-FTX recovery.
ETF whiplash, collapsing miner revenue, and Iran’s Bitcoin toll
Can the ETF market make up its mind?
On April 14, Bitcoin ETFs hemorrhaged $291 million. Fidelity’s FBTC alone bled $229 million – the kind of single-fund exodus that usually signals institutional capitulation. Then, 24 hours later, $411 million flooded back in. IBIT absorbed $285 million of it.
“ETF flows swinging $700 million in 48 hours tells you this isn’t buy-and-hold money – it’s active rebalancing at scale,” Eric Balchunas, Bloomberg Intelligence senior ETF analyst, said on X.
The macro backdrop isn’t helping clarity. Iran’s ceasefire collapsed this week, and Trump ordered a naval blockade of the Strait of Hormuz. Bitcoin Magazine reported that Tehran now demands BTC as payment for safe tanker passage – a surreal development that simultaneously reinforces Bitcoin’s case as geopolitical infrastructure and injects raw chaos into every risk model on Wall Street.
Today, the SEC holds its roundtable on the CLARITY Act, the tokenization bill Congress must finalize by July. FOMC sits two weeks out on April 29.
Meanwhile, miners are getting crushed. The Puell Multiple, which compares daily miner revenue to its 365-day moving average, dropped from 0.869 to 0.662 in a single day – a 24% revenue crash. The last time Puell sat this low was late March, right before BTC bounced 12% off the $66,800 floor when miner revenue hit its previous cycle low.
The last time LTH bled this hard, Bitcoin tripled in six months
Current LTH-SOPR at 0.769 sits uncomfortably close to the cycle’s worst reading – 0.681 on March 31, when BTC closed its worst quarter since FTX at $66,878. That bottom held. Bitcoin rallied 12% to today’s $74,286 in just 16 days.
But the deeper parallel is November 2022 itself. LTH-SOPR hit 0.72 during the FTX collapse with BTC at $16,500. What followed: a 197% rally to $49,000 within six months.
The setup rhymes – with a caveat. In 2022, exchange reserves were 700,000 BTC higher than today and zero Bitcoin ETFs existed, meaning today’s supply squeeze is structurally tighter than anything the market faced during the FTX aftermath, with institutional demand from BlackRock, Morgan Stanley, and Strategy providing a bid floor that simply didn’t exist three years ago.
But macro uncertainty from Iran, tariffs, and the looming FOMC could stall any sustained breakout. This isn’t 2022’s clean bottom. It’s messier. And that’s precisely why the divergence between LTH capitulation and exchange drainage deserves attention – one side will break first.
On-chain scorecard (4 of 6 bullish)
- ✅ Exchange reserves: 2,681,239 BTC – new cycle low, accelerating outflows (bullish supply squeeze)
- ✅ NUPL, which tracks net unrealized profit and loss across all holders: 0.276 – recovered from near-capitulation 0.178, now in hope zone (bullish)
- ✅ Leverage ratio: 0.180 – deleveraged from 0.237, healthy base for a spot-driven move (bullish)
- ⚠️ SOPR: 0.998 – back below 1.0, average seller still locking in slight losses (caution)
- ❌ LTH-SOPR: 0.769 – veteran holders selling at 23% loss, second capitulation wave underway (bearish)
- ⚠️ Puell Multiple: 0.662 – miner revenue crashed 24% in one day, historically a bottom signal but also real distress (caution)
TokenEcho Verdict
Direction: Cautiously bullish
Key level: $76,000 – January’s resistance ceiling and the breakeven zone where whales distribute. A close above $76K with volume exceeding $45B confirms the supply squeeze is translating into price.
Risk factor: If exchange reserves reverse and start climbing while LTH-SOPR stays below 0.80, the second capitulation wave isn’t over – it’s deepening. A drop below $70,000 on rising inflows invalidates the bullish setup entirely.
This is an analytical assessment, not financial advice.
What to watch next 48-72 hours
- $76K breakout with conviction. BTC tested this level on April 15 before fading. A sustained daily close above $76,000 with volume clearing $45 billion confirms that institutional absorption is overpowering the LTH sell-off.
- LTH-SOPR recovery above 1.0. If long-term holders shift back to profit in the next few sessions, it signals the capitulation cohort has exhausted its supply. Watch for SOPR crossing 1.0 simultaneously – that bullish combination hasn’t appeared since early April.
- Leverage below 0.20 into FOMC. With the Fed meeting on April 29, any leverage buildup above 0.20 signals speculative positioning ahead of the rate decision – increasing liquidation risk in both directions.
This analysis is part of our daily Bitcoin price tracking. See all previous analyses and key metrics on our hub page. For long-term scenarios, see our Bitcoin price prediction.
Long-term holders bleed while exchanges drain supply – which side breaks first will define whether Q2 becomes a recovery or a deeper capitulation.
This is not financial advice. DYOR. Data as of April 16, 2026.
Sources: CoinGecko, CryptoQuant, CoinDesk, Bitcoin Magazine
Leave a Reply