
🕑 6 min read
Orderly deleveraging clears the deck – but $2 billion in liquidations sit within a $113 range of the current price.
Leverage crashed 8%. The price moved less than 1%.
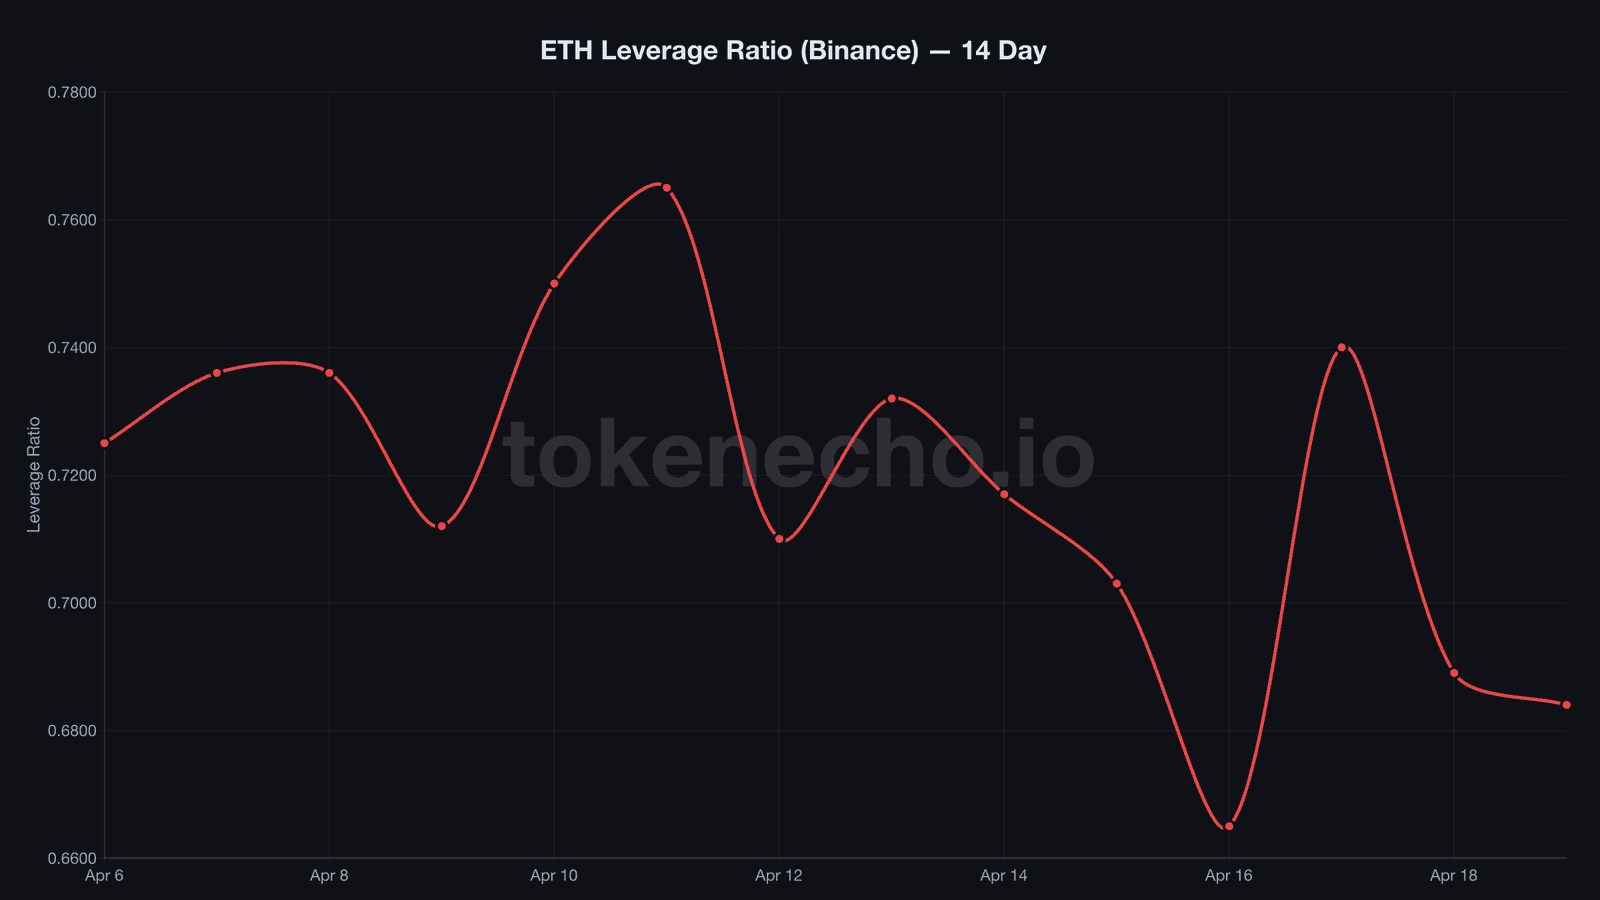
That disconnect is the most telling signal in this week’s Ethereum price action. Binance’s estimated leverage ratio, a measure of open derivatives positions relative to exchange reserves, plunged from 0.740 to 0.684 between April 17 and 19 – while ETH drifted just $30, from $2,347 to $2,317, over the same 48-hour window in what might be the quietest deleveraging event since the post-FTX flush of early 2023.
Traders aren’t getting liquidated. They’re leaving voluntarily.
Key takeaways
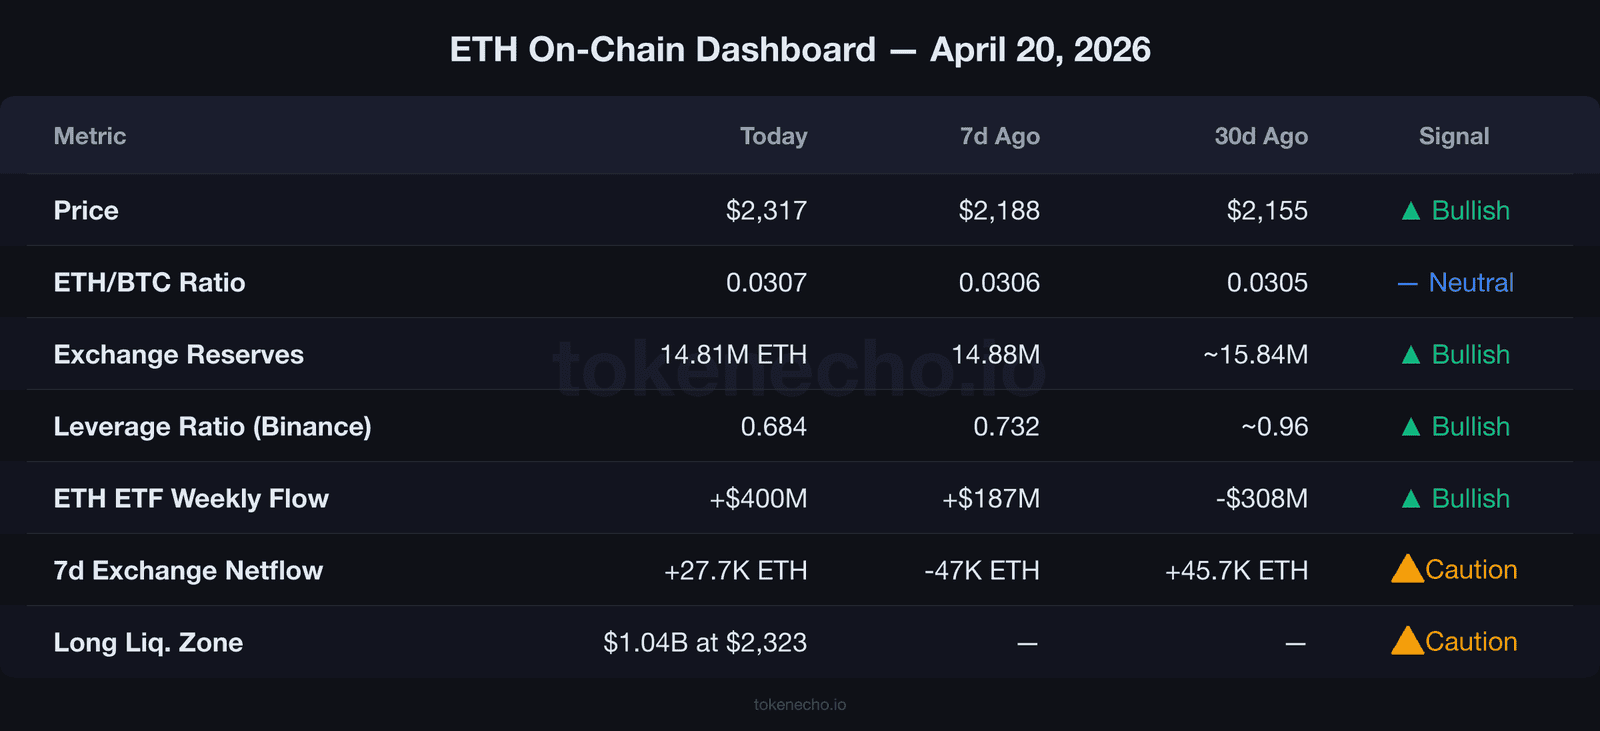
- Binance’s ETH leverage ratio dropped from 0.740 to 0.684 in 48 hours – the steepest deleveraging since early April – while the price fell just 0.64%.
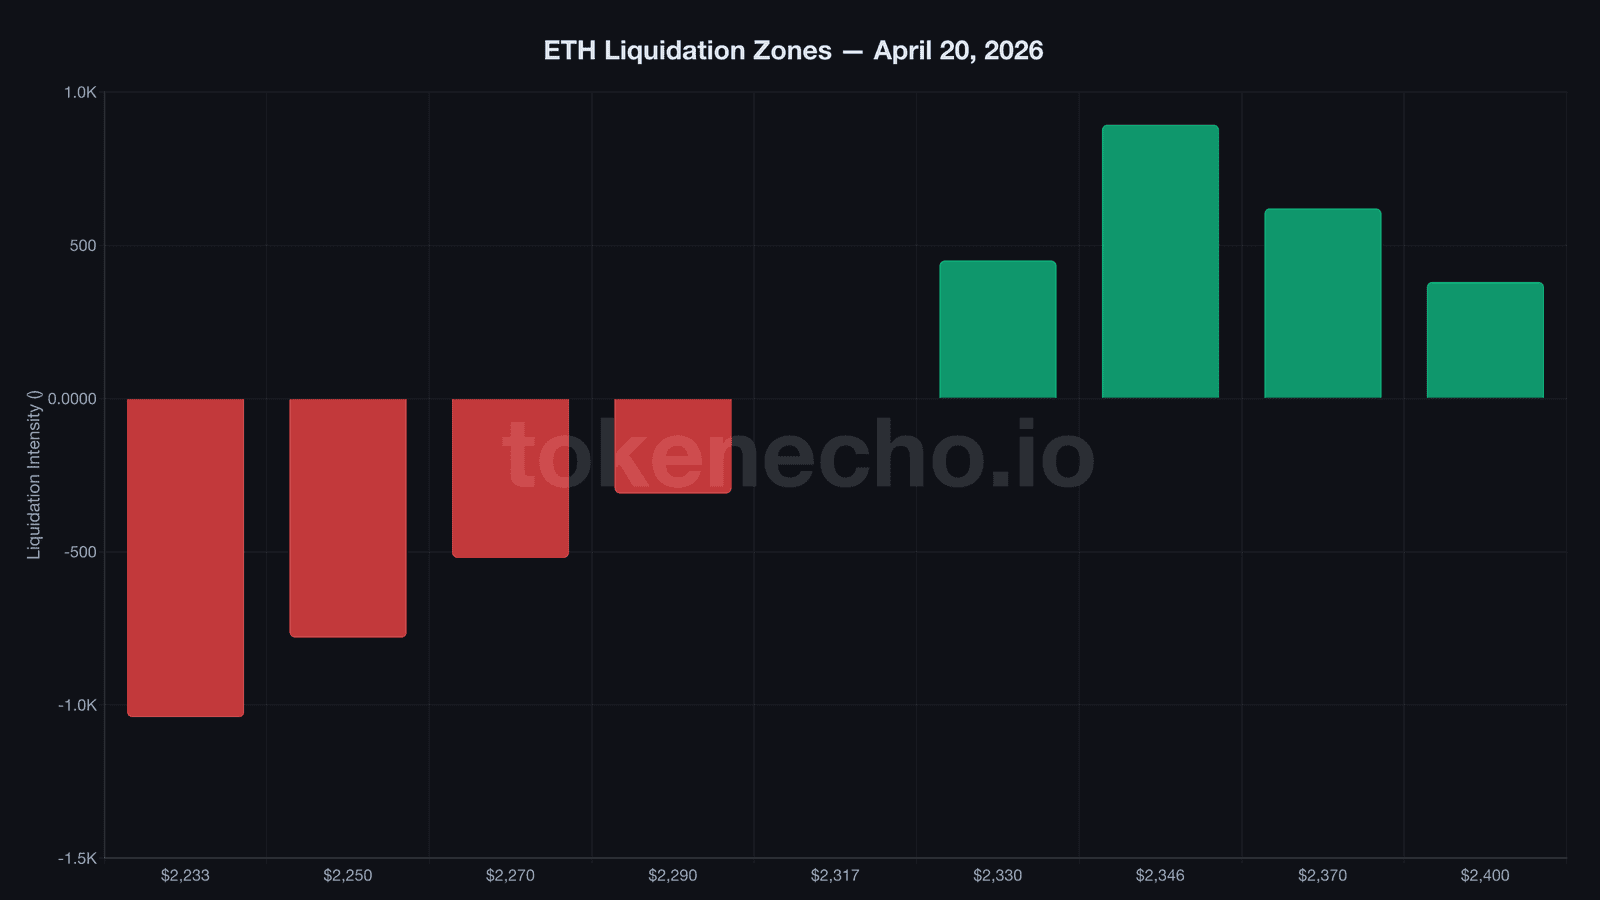
- $1.04 billion in long liquidations sit below $2,323 and $893 million in shorts above $2,346. ETH trades at $2,317 – right at the edge of a $2 billion cascade.
- ETH ETFs pulled in over $400 million in 7 days, with $127.4 million on April 17 alone – the strongest sustained institutional buying of 2026.
Leverage crashed – and nobody panicked
0.684.
That’s where Binance’s leverage ratio landed on April 19. Two days earlier: 0.740. The 7.6% drop happened without a liquidation cascade, without a flash crash, without a single trending hashtag on crypto Twitter.
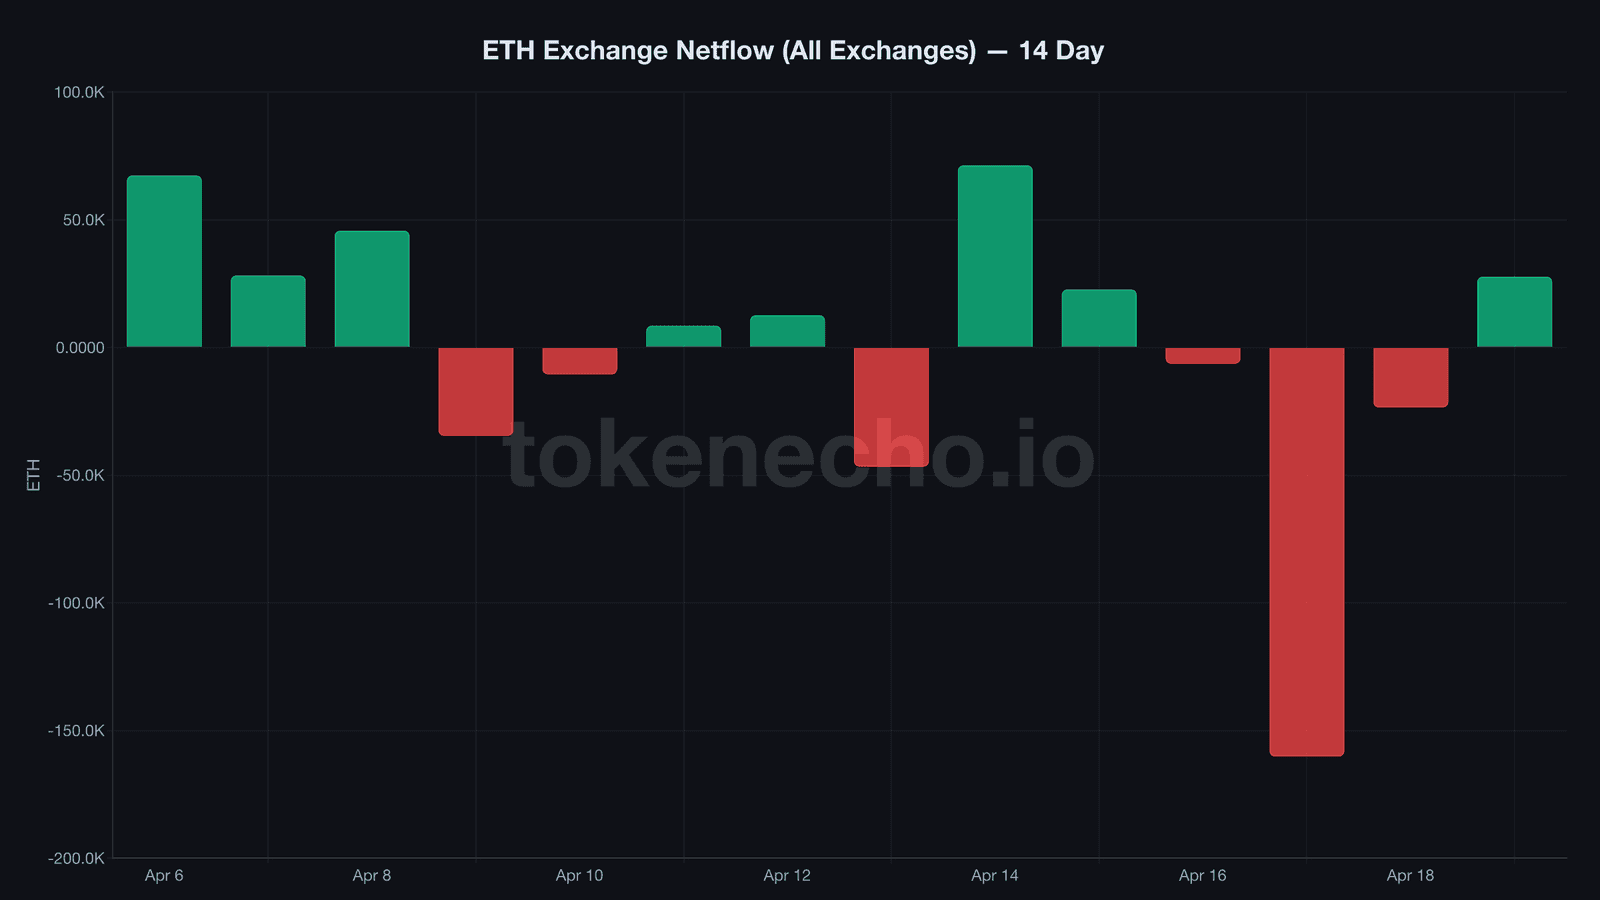
Exchange reserves add context. Between April 15 and 18, exchanges lost 190,103 ETH – roughly $441 million walking out the door in 72 hours. The largest 3-day drain since early March.
Then on April 19, the bleed stopped. Reserves ticked up by 27,673 ETH ($64 million) – first net inflow in three days. That’s like draining an Olympic swimming pool and someone tossing a bucket back in.
But the 30-day picture still shows about 1.03 million ETH ($2.4 billion) leaving exchange wallets. The trend hasn’t reversed. It’s catching its breath.
We’ve been tracking this leverage decline since our April 18 analysis, when the ratio spiked to 0.953 across all exchanges on Hormuz reopening day. What followed: a 48-hour unwind that stripped leverage back to levels not seen since mid-March.
The last time leverage fell this sharply without a corresponding price crash was January 2023. ETH sat at $1,200 after FTX. What followed: 75% in 90 days.
$2 billion in liquidations squeezed into a $113 range
Picture a derivatives trader watching their ETH long on a Sunday morning. Entry at $2,280, leverage at 10x, liquidation price at $2,233. They’re green – barely.
And $1.04 billion worth of positions in that same zone aren’t sleeping well.
That cumulative long liquidation intensity below $2,323 marks the floor of pain. Drop through it, and cascading wipeouts push ETH toward $2,233 where another cluster of forced selling waits.
But flip it. Above $2,346 – just $29 from Saturday’s 24-hour high – $893 million in shorts sit exposed. A 1.3% move up triggers them.
The $113 gap between $2,233 and $2,346 holds roughly $2 billion in leveraged bets. That’s not a range. That’s a loaded spring.
Analyst Ali Martinez flagged $2,480 as the breakout level for a run toward $2,900. But with $2 billion in liquidations between here and there, the path to that target runs through a minefield.
Why does any of this matter if you’re not trading futures? Because forced liquidations move spot prices. A $1 billion long cascade would dump ETH the same way a real seller would – and spot holders pay the price for someone else’s leveraged bet.
ETFs bought $400M while traders ran for the exits
Institutional money doesn’t care about leverage ratios. It cares about access.
ETH ETFs logged their seventh consecutive day of net inflows. On April 17, $127.4 million poured in – Fidelity’s FETH led at $84.1 million, BlackRock’s ETHA added $30.8 million.
The weekly total crossed $400 million. That’s more than double the previous 2026 record of $187 million set the week before.
And the access pipeline keeps expanding. Charles Schwab flipped the switch on direct spot Ethereum trading April 16, opening the door to 38.9 million brokerage clients who collectively park $12 trillion on the platform – the kind of capital base that makes a derivatives trader’s 10x long position look like pocket change. For anyone curious about getting started, we covered the full process in our guide to buying Ethereum.
“We continue to see Ethereum reaching $7,500 by year-end,” said Geoffrey Kendrick, global head of digital assets research at Standard Chartered, in a client note.
On the development front, Ethereum’s Glamsterdam upgrade devnet went live with a 78.6% gas fee reduction in testing – and Q1 logged 200 million on-chain transactions, the network’s busiest quarter ever.
So the split is widening. Leveraged traders unwind. Institutions build. The ETH/BTC ratio at 0.0307 – cemented at its 5-year floor – shows the rotation hasn’t started yet. ETH rises because BTC rises. Not because capital is choosing it.
Not yet.
January 2023 called – the leverage flush that preceded 75%
After the FTX collapse reduced the entire crypto derivatives market to rubble in late 2022, Ethereum sat at $1,200 in January 2023 with leverage ratios declining for weeks, exchange reserves bleeding steadily, and Grayscale’s ETHE fund trading at a painful 50% discount to its net asset value – what turned out to be institutional accumulation wearing a different costume.
The outcome: $1,200 to $2,100 in 90 days. A clean 75% move built on spot buying in a market cleared of excess.
Today’s setup rhymes. Leverage crashing (0.740 to 0.684). Reserves declining (down 1.03 million ETH in 30 days). Institutional capital flooding in ($400M weekly through ETFs).
The critical difference: open interest today runs $25-34 billion, four to five times January 2023’s $6-8 billion. If the deleveraging completes cleanly, the 2023 playbook points toward $3,500-$4,000 over the following quarter. If a liquidation cascade triggers first, history stops rhyming. For a deeper look at how we read these on-chain signals, check our guide to the 6 metrics that called every major Bitcoin move.
Our current Ethereum price prediction covers the full bull, base, and bear scenarios through 2030.
On-chain scorecard (3 of 6 bullish)
✅ Exchange reserves: 14.81M ETH, down 6.5% in 30 days – supply squeeze holds
✅ Leverage ratio: 0.684, declining – orderly deleveraging clears excess
✅ ETH ETF flows: +$400M weekly, 7-day streak – strongest institutional demand of 2026
⚠️ Exchange netflow: +27,673 ETH on Apr 19 – first inflow in 3 days, outflow trend stalling
⚠️ ETH/BTC ratio: 0.0307, flat at 5-year floor – no relative strength vs Bitcoin
❌ Liquidation risk: $1.04B longs at $2,323 + $893M shorts at $2,346 – $2B trapped near price
TokenEcho verdict
Direction: Cautiously bullish
The leverage flush is constructive. Orderly deleveraging – traders unwinding voluntarily rather than getting forced out – builds better foundations than panic crashes. Combine that with record ETF inflows and a million-ETH supply drain, and the structural case holds.
Key level: $2,346 – a break above triggers $893M in short liquidations and opens $2,480. Below $2,233, $1.04B in longs collapse and the January 2023 parallel breaks.
Risk factor: Iran ceasefire expires April 22. The April 17 Hormuz reopening drove a 160,188 ETH single-day outflow. If the ceasefire collapses, the $2B liquidation zone activates under geopolitical stress – and orderly deleveraging becomes a forced liquidation event.
This is an analytical assessment, not financial advice.
What to watch (next 48-72 hours)
- Iran ceasefire deadline April 22 – collapse triggers volatility comparable to April 17. The $2B liquidation zone sits at highest risk.
- $2,346 breakout with volume above $20B – clears the short squeeze trigger and targets $2,480, confirming the post-deleveraging thesis.
- Leverage ratio below 0.65 – continued decline without price deterioration strengthens the January 2023 parallel and signals room for spot-driven upside.
This analysis is part of our daily Ethereum price tracking. See all previous analyses and key metrics on our hub page.
Leverage is flushing, institutions are buying, but ETH/BTC says the market hasn’t picked a winner yet. Something has to give – and April 22 might force the answer.
This is not financial advice. DYOR. Data as of April 20, 2026.
Sources: CoinGecko | CryptoQuant | Farside ETH ETF Flows | CoinGlass Liquidation Map
Leave a Reply