Trump’s Iran Flip Triggers $415M Crypto Liquidation Whipsaw in Just 4 Hours
🕑 4 min read
A single social media post just cost crypto traders $415 million in four hours.
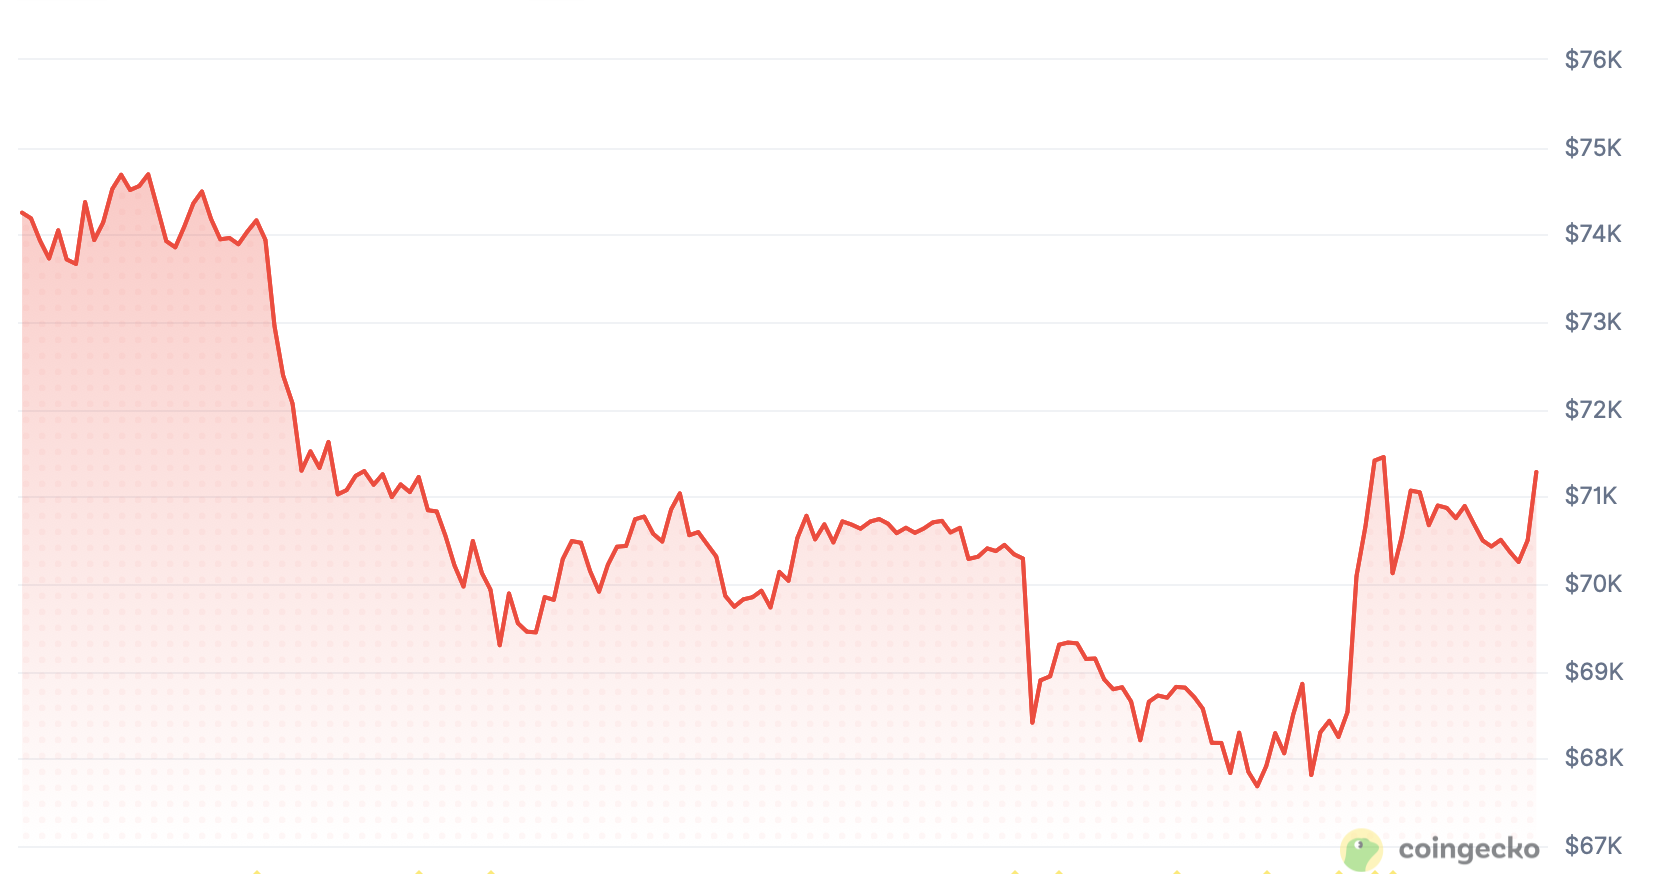
On March 22-23, President Trump’s rapid pivot from threatening to “obliterate” Iran’s power plants to announcing a five-day strike pause created the most violent crypto liquidation whipsaw of 2026. Bitcoin swung from $67,500 to $71,800, destroying long and short positions alike, while Brent crude crashed from $114 to $102 per barrel in the same window.
The data reveals a market where derivatives volume runs at 5x spot trading, turning every geopolitical headline into an amplified liquidation cascade.
The 48-Hour Ultimatum That Broke the Market
On Saturday, March 22, Trump issued a 48-hour ultimatum demanding Iran reopen the Strait of Hormuz or face the destruction of its energy infrastructure. Iran’s response was immediate and aggressive: the Islamic Republic launched missiles at two Israeli cities – Dimona and Arad – near Israel’s nuclear research center, and threatened to close the Strait of Hormuz indefinitely.
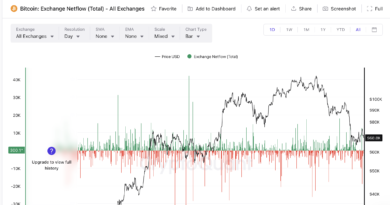
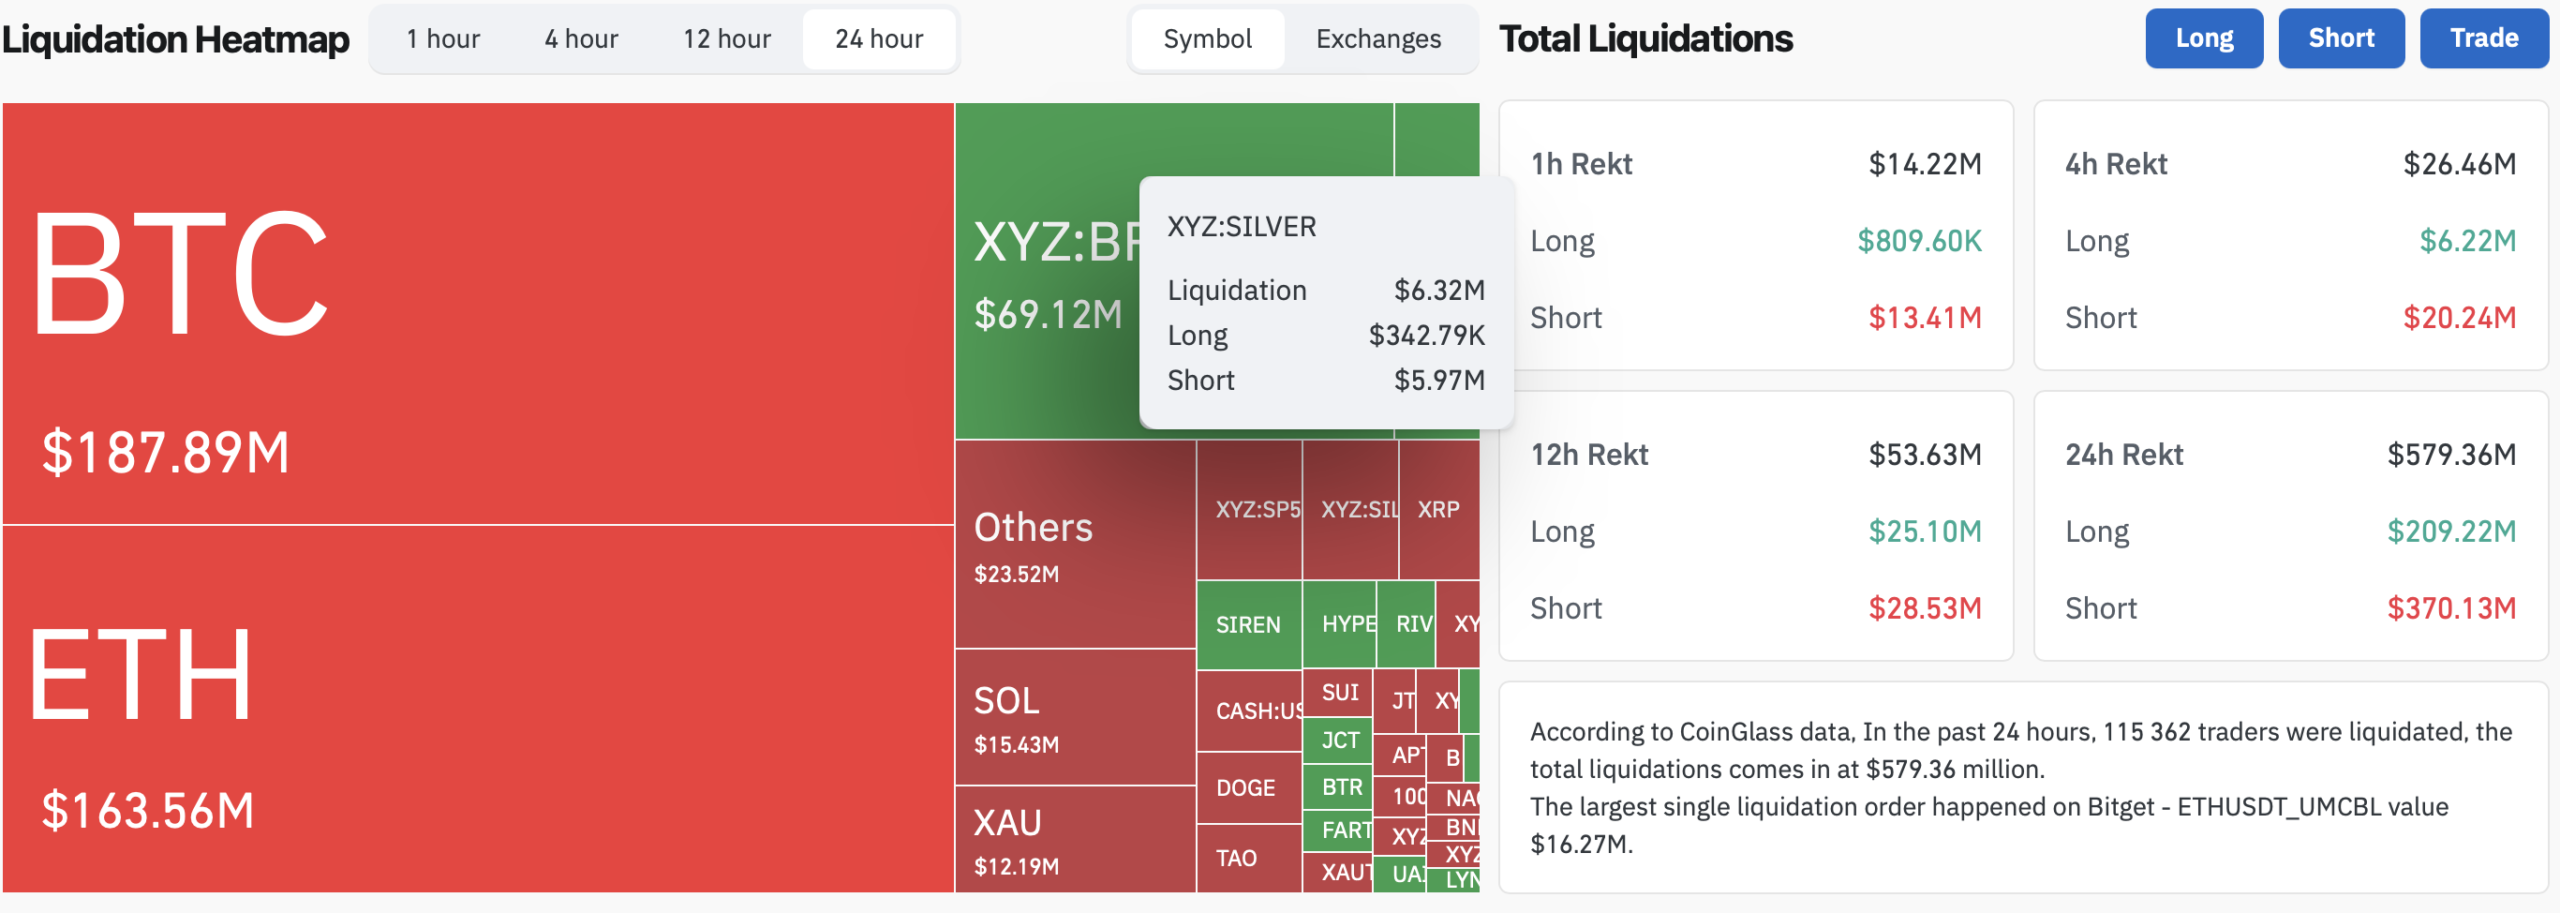
Bitcoin reacted instantly. The price dropped from $70,000 to $67,500 as traders rushed to de-risk. Within 24 hours, $336 million in long positions were liquidated across major exchanges, with Bitcoin longs accounting for roughly $100 million of the damage, according to CoinGlass data.
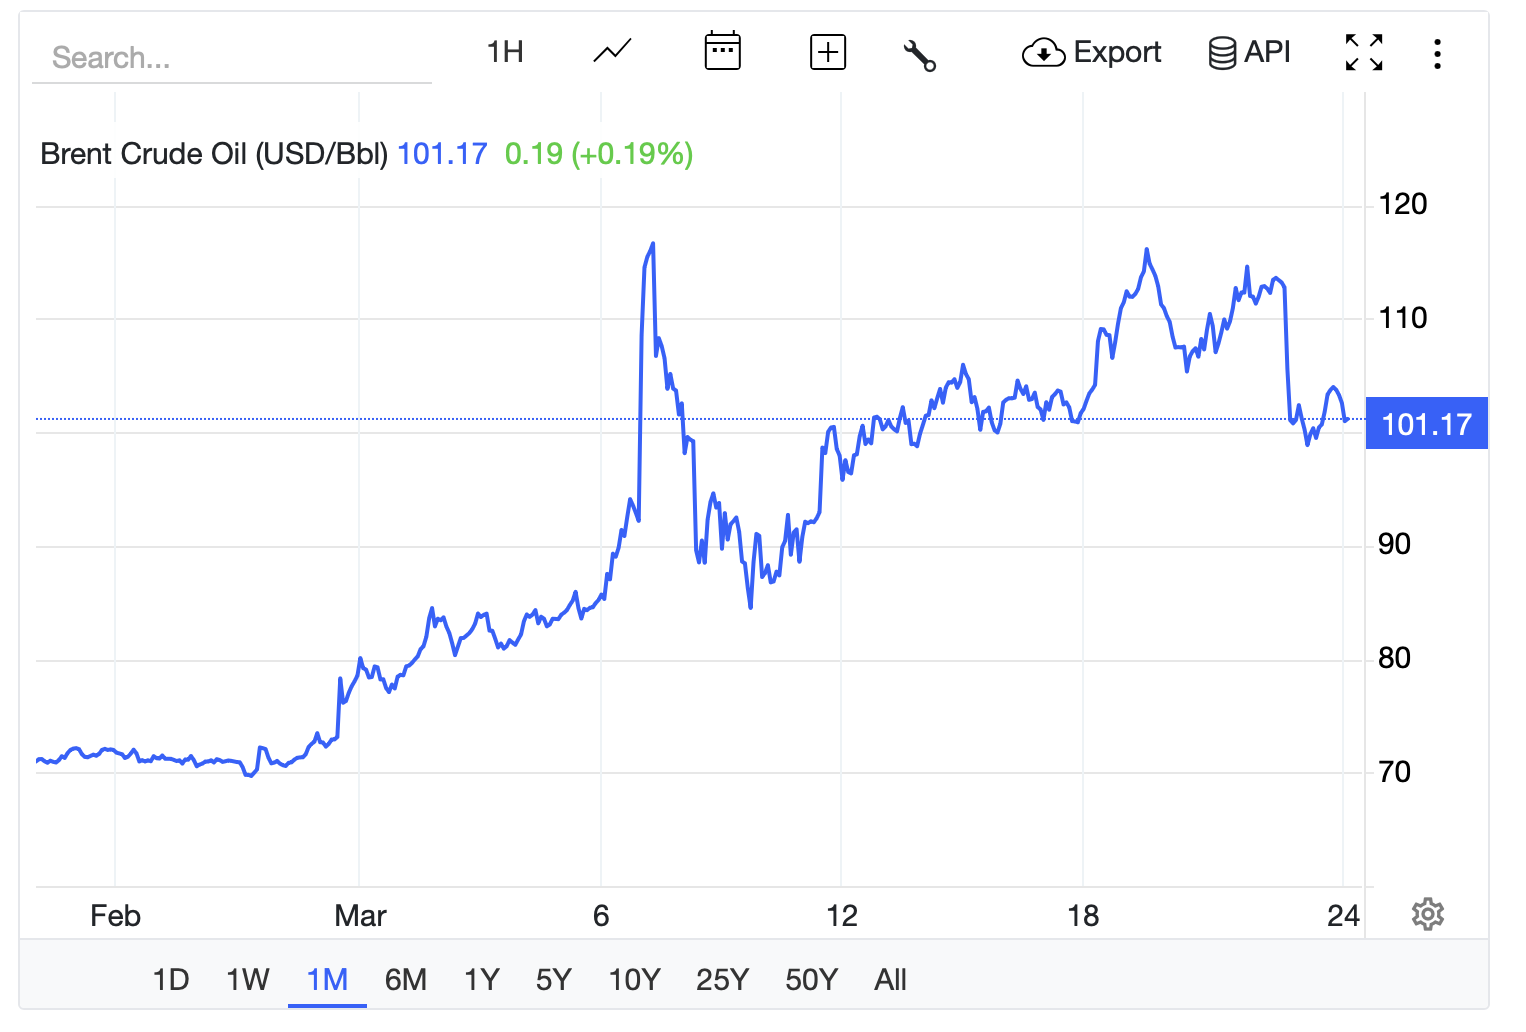
Brent crude surged to $114.09 per barrel as markets priced in a prolonged closure of the waterway that handles approximately 20% of global oil supply. The Strait of Hormuz crisis, described as the largest energy supply disruption since the 1970s, pushed the Crypto Fear & Greed Index deeper into “Extreme Fear” territory at 27.
The 180-Degree Reversal
Then came the flip.
On Sunday, March 23, Trump posted that the U.S. had held “very good and productive conversations” with Iran and ordered a five-day pause on planned strikes against Iranian power plants and energy infrastructure.
Bitcoin erupted. Within minutes, the price surged from approximately $67,500 to an intraday high of $71,806 – a 6.4% move that caught the entire short side off guard. CoinGlass recorded $280 million in short liquidations in the four-hour window surrounding Trump’s announcement, with nearly $270 million vaporized in the first minutes alone.
The total damage: $415 million in combined long and short liquidations within a single four-hour trading window – all triggered by conflicting headlines from one man’s social media account.
Iran Denied Everything
In a surprising turn of events, Iran’s Foreign Ministry made a statement that added to the confusion, saying: “There are no talks going on between Tehran and Washington.” This contradiction briefly pressured Bitcoin’s recovery, as traders scrambled to assess which narrative was accurate.
NPR confirmed that backchannel efforts were indeed underway, with regional players working behind the scenes to de-escalate tensions. But the damage to leveraged traders was already done.
Oil markets reacted even more dramatically to Trump’s de-escalation signal. Brent crude plunged nearly 11% from $114 to $102 per barrel in a single session – one of the largest single-day drops in recent memory, according to CNBC.
The Derivatives Amplification Problem
The sheer scale of liquidations reveals a structural vulnerability in crypto markets. When derivatives volume runs at approximately 5x the spot market volume, every headline gets amplified through cascading liquidations in both directions.
The pattern from this weekend was textbook: shorts get squeezed on the de-escalation post, then longs get caught when the counter-headline arrives. Traders on the wrong side of leveraged positions face automatic forced selling, which accelerates the price move and triggers the next wave of liquidations.
This is not the first time in 2026 that geopolitics has overwhelmed crypto technicals. The Iran-Israel conflict has been a persistent source of volatility since early March, with Brent crude rising from $100 to a peak of $126 per barrel over the month.
Where Things Stand Now
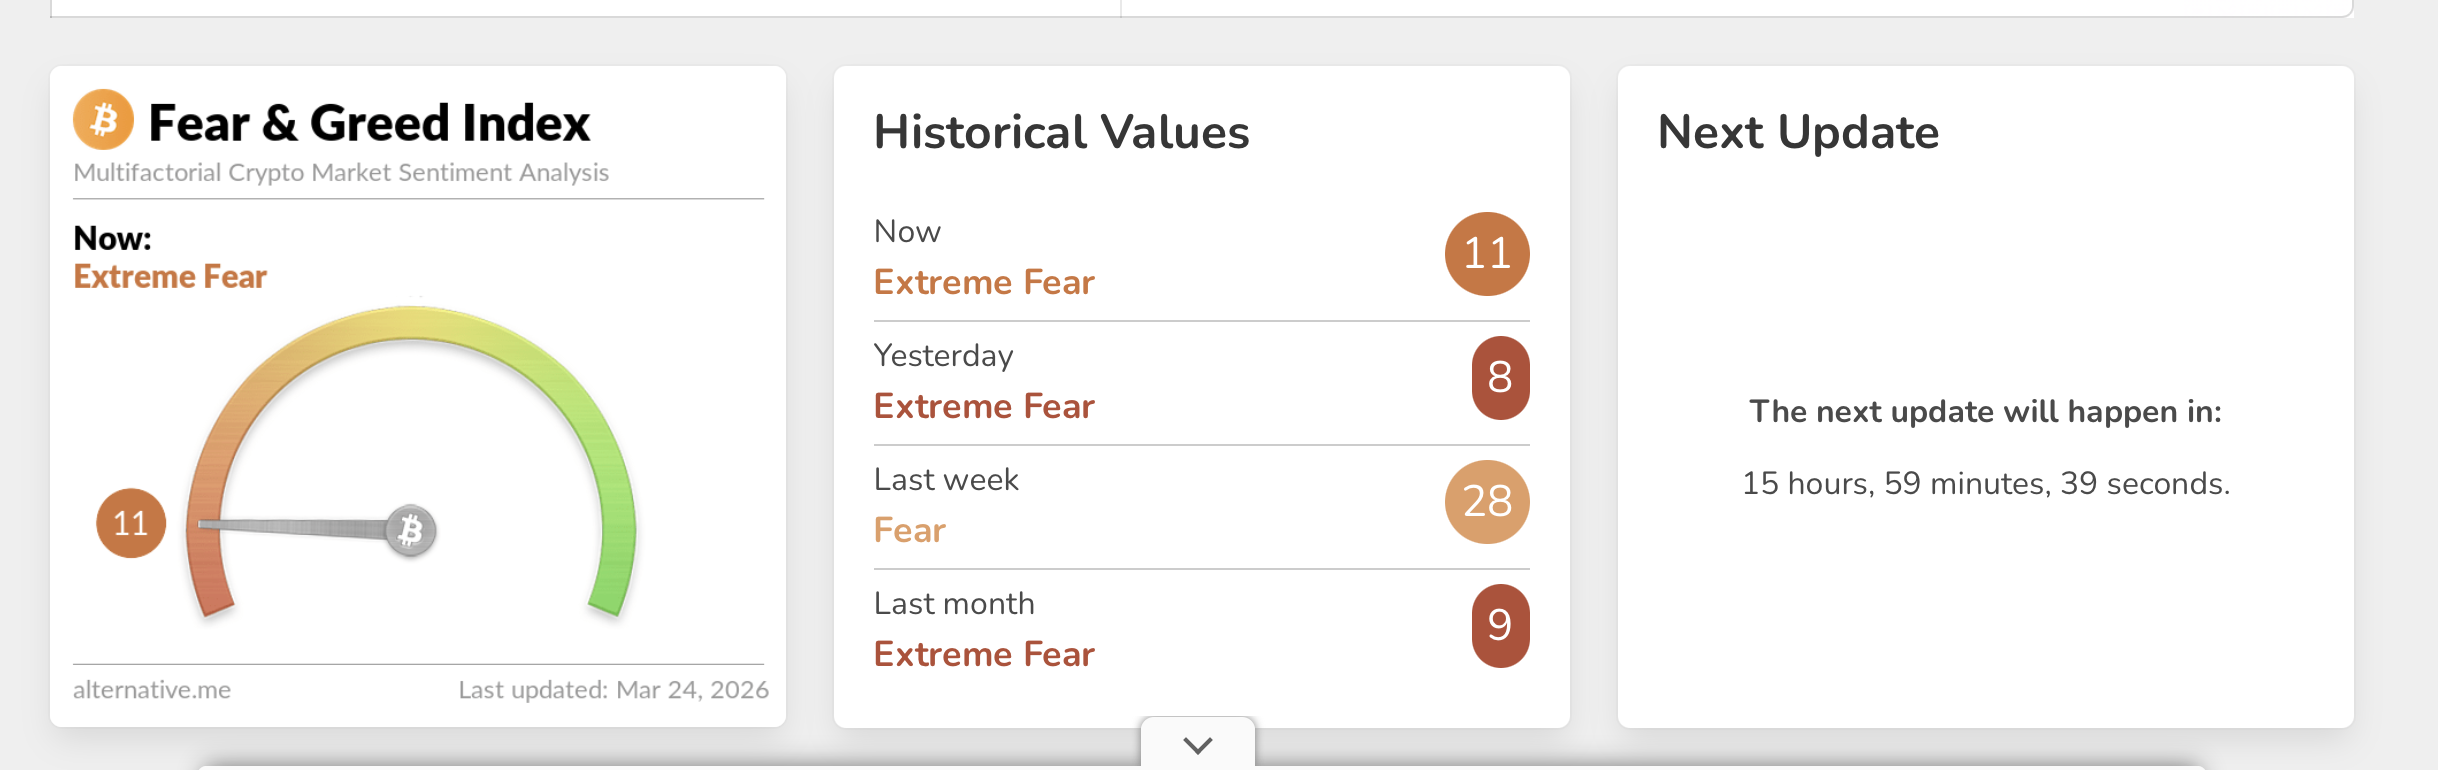
On Monday morning, March 24, the price of Bitcoin was around $70,600, and here’s a look at the current market conditions:
- Fear & Greed Index: 11 (Extreme Fear)
- Ethereum: $2,032, down in line with broader market weakness
- Solana: $88.50, consolidating near support
- Brent Crude: approximately $102 after the 11% drop from $114
- Polymarket: 8% probability of a US-Iran ceasefire by March 31; 74% by December 31
Trump’s five-day pause expires on Friday, March 28. If no diplomatic progress materializes, the threat to strike Iran’s energy infrastructure returns – and with it, the potential for another round of violent crypto liquidations.
What the Data Tells Us
The weekend’s events highlight three key takeaways for crypto traders:
First, geopolitical risk is now the dominant driver of crypto price action, overriding technicals, ETF flows, and on-chain fundamentals. No amount of whale accumulation or institutional buying can offset a presidential ultimatum that threatens 20% of global energy supply.
Second, the 5x derivatives-to-spot volume ratio means that every major headline creates outsized liquidation cascades. Until this leverage ratio normalizes, crypto will continue to act as a high-beta amplifier of geopolitical risk.
Third, the Polymarket data suggests this is far from over. With only an 8% chance of ceasefire by month-end, traders should expect continued headline-driven volatility through at least Q2 2026.
This is not financial advice. DYOR. Data as of March 24, 2026.
Sources
- CoinGlass – Liquidation data
- CoinDesk – BTC price action and $415M liquidation analysis
- CNBC – Brent crude oil price movements
- Al Jazeera – Trump 48-hour Strait of Hormuz ultimatum
- NPR – Iran-US timeline, backchannel negotiations
- Polymarket – US-Iran ceasefire odds
- Alternative.me – Crypto Fear & Greed Index
- CoinGecko – BTC, ETH, SOL price data