

Bitcoin ETFs Swing From $3.8 Billion Exodus to $1.17 Billion Inflow Streak Before FOMC Shock
🕑 5 min read
Bitcoin investment funds have seen a huge turnaround, going from a massive $3.8 billion withdrawal to a $1.17 billion influx. This big change happened right before the Federal Open Market Committee, or FOMC, made a surprising announcement.
Institutional capital staged a dramatic return to spot Bitcoin ETFs in March – only to be slammed by the Fed’s hawkish pivot.
The Big Turnaround – it was a really tough five weeks, but then something changed and we got a glimpse of hope in just seven days.
Between late January and February 23, 2026, U.S.-listed spot Bitcoin exchange-traded funds hemorrhaged $3.8 billion across five consecutive weeks of net outflows – the longest redemption streak since February 2025. BlackRock’s iShares Bitcoin Trust (IBIT), the industry’s flagship product, led the retreat with approximately $2.13 billion in redemptions over that same period.
The causes were clear: escalating U.S.-Iran tensions, President Trump’s fresh global tariff announcement, and some technical weakness on the price charts made big investors a bit nervous, so they started to play it safe. This caused Bitcoin’s price to drop from $82,000 in mid-January to $67,000 by late February.
Then, almost overnight, the tide turned. Starting March 9, spot Bitcoin ETFs posted seven consecutive sessions of net inflows totaling $1.167 billion, according to SoSoValue data. If you look at how this money is coming in day by day, you can see that confidence is building:
- March 9: $167.03 million
- March 10: $250.92 million
- March 11: $115.17 million
- March 12: $53.87 million
- March 13: $180.33 million
- March 14: $201.62 million
- March 17: $199.37 million
This was the first time in almost five months that people had put money into Bitcoin for several weeks in a row. By March 16, the price of Bitcoin had gone up to $73,882, rewarding the institutional buyers who had stepped in at the bottom.
The FOMC Wrecking Ball
The optimism was short-lived. On March 18, the Federal Open Market Committee concluded its meeting by holding interest rates steady at 3.5% to 3.75% – no surprise there. But the accompanying dot plot and Chair Jerome Powell’s commentary delivered a hawkish shock: policymakers raised their 2026 inflation outlook to 2.7%, citing systemic energy pressures, and projected only a single 25-basis-point cut for the rest of the year.
The market reacted quickly and strongly. Bitcoin’s price dropped sharply, falling about 5% from $74,000 to around $71,100. This was a big test of the $71,100 support level. The Fear and Greed Index has dropped to 26, which is well into the “Fear” zone.
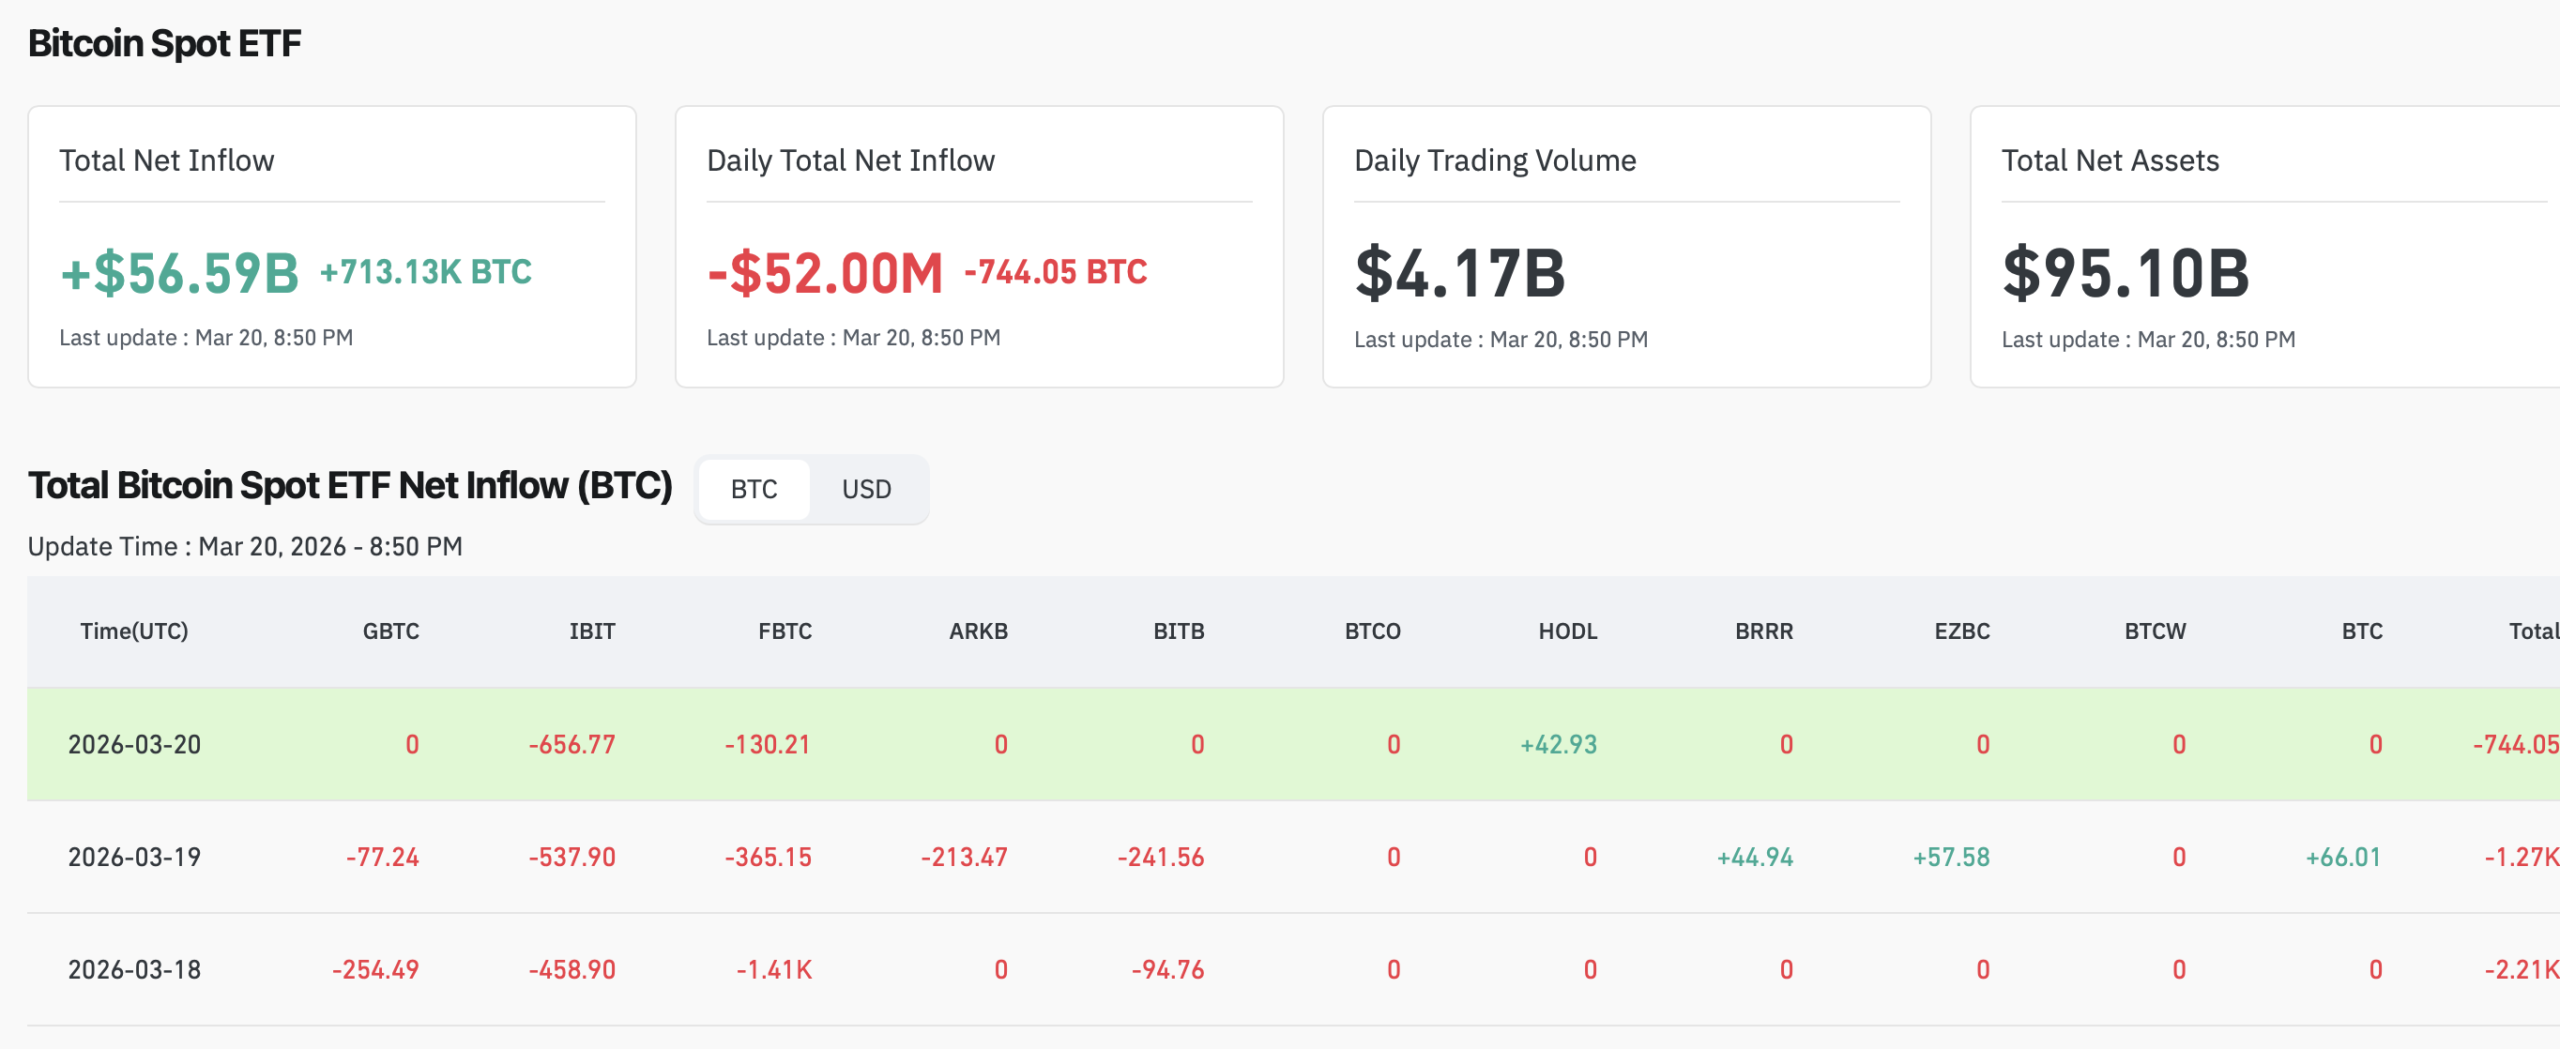
More telling than the price drop was the ETF response. On Wednesday, March 19, U.S. spot Bitcoin ETFs recorded $708.7 million in net outflows, the biggest one-day loss in two months. This put an end to the seven-day streak of money coming in.
By March 20, Bitcoin had slipped further to $70,417. Wall Street was recalibrating for a “higher-for-longer” interest rate regime, with both the Nasdaq and S&P 500 ending the day down by about 1%.
Following the Institutional Playbook
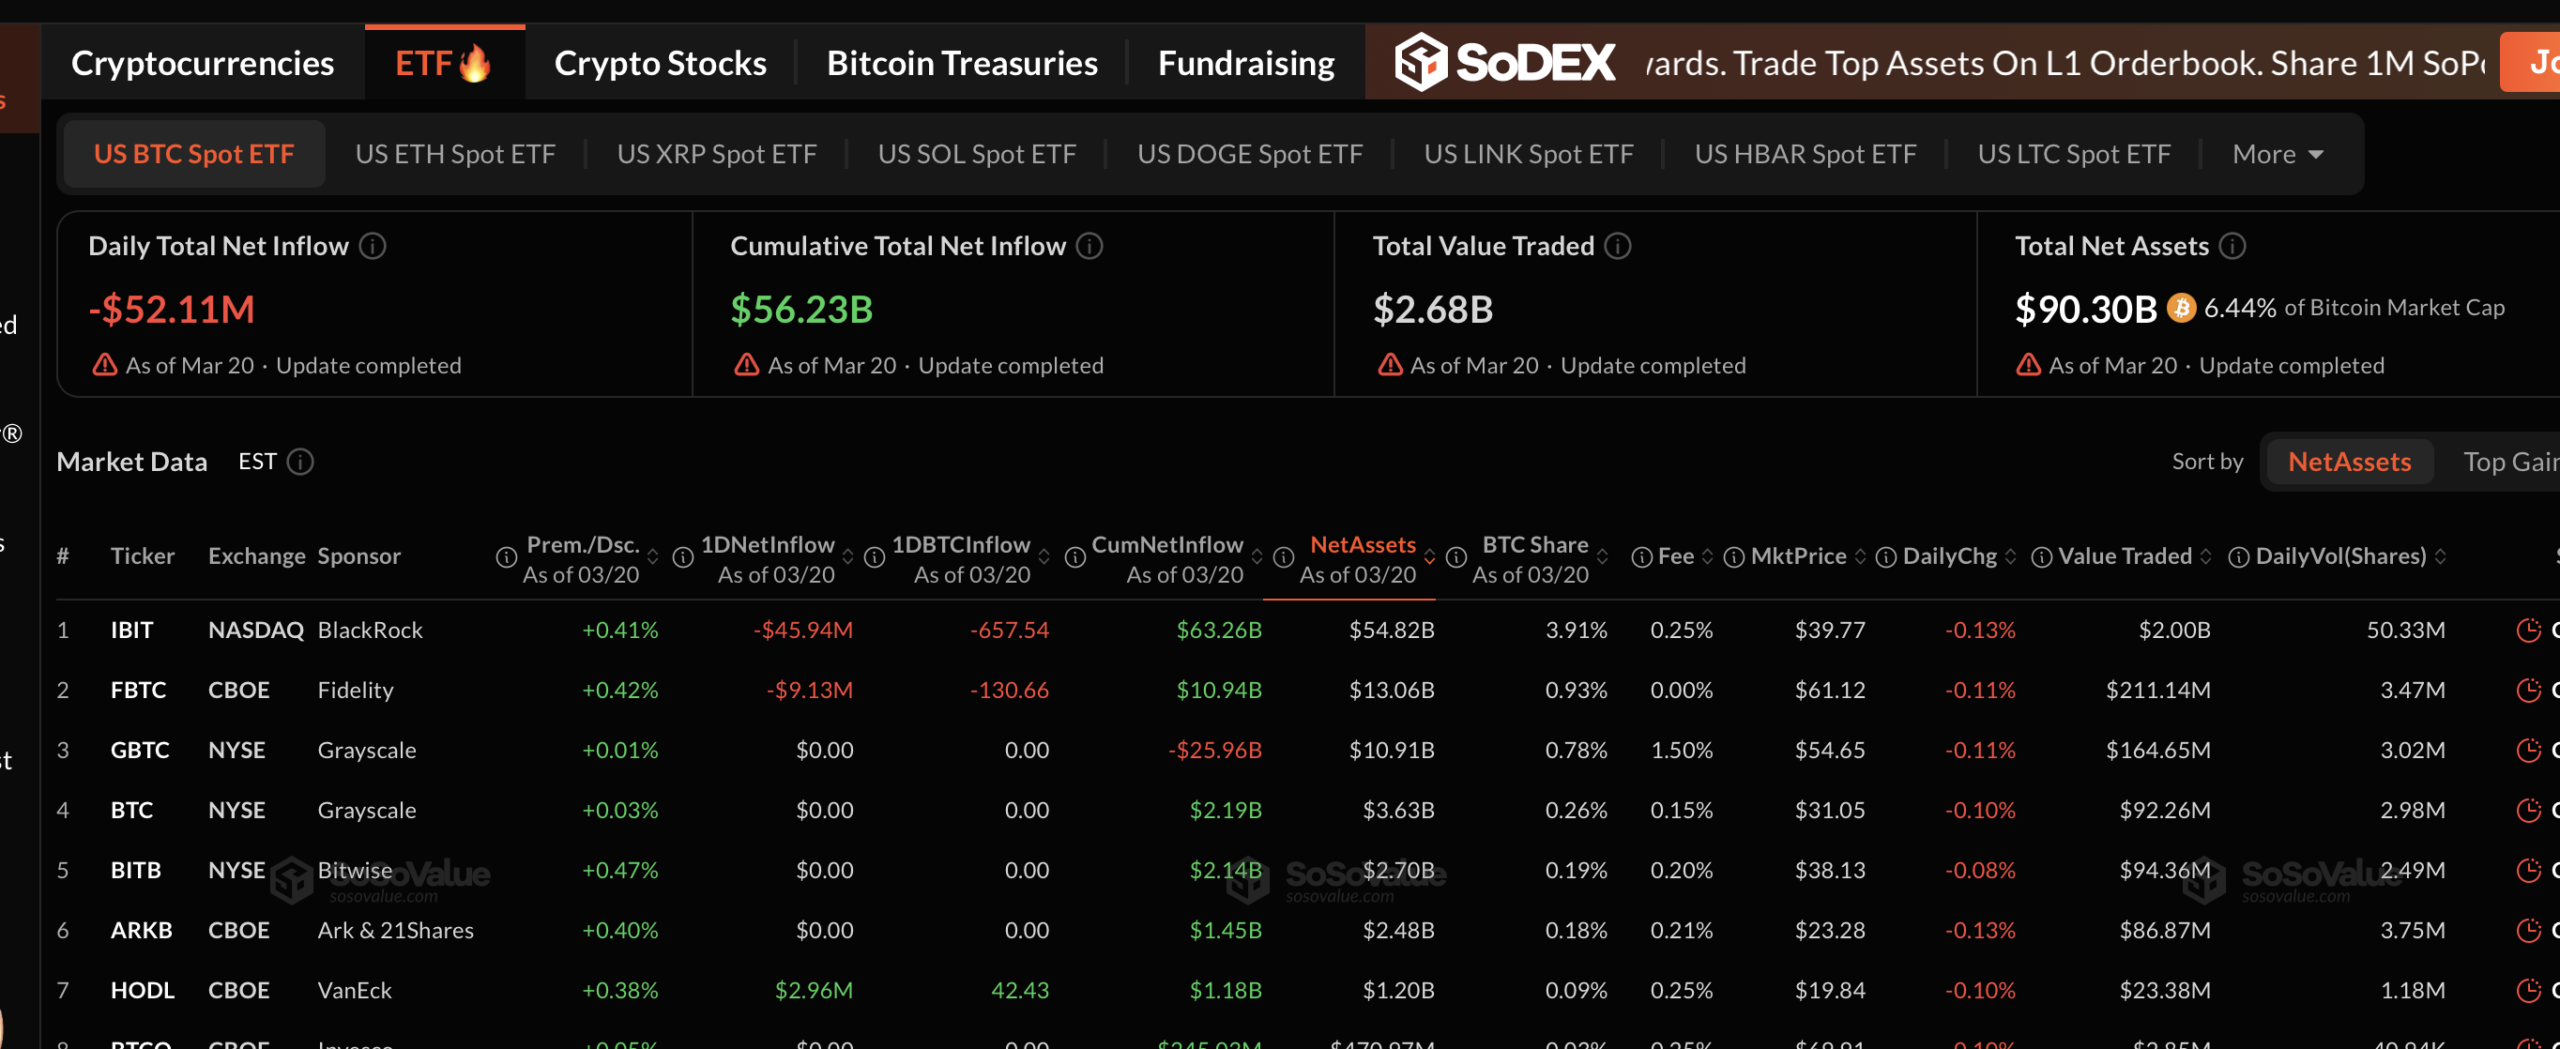
Despite the post-FOMC shock, the cumulative picture tells a more nuanced story. Total net inflows across all U.S. spot Bitcoin ETFs stand at $56.41 billion since their January 2024 launch. Combined assets under management sit at $91.8 billion, representing approximately 1.29 million BTC held across all funds.
BlackRock’s IBIT dominates with $70.6 billion in AUM, followed by Fidelity’s FBTC at $17.7 billion. Together, these two funds control roughly 96% of the market.
The way things are going in March is like a familiar plan that analysts have seen before – it’s when a lot of things happen quickly, and then people suddenly get worried and start selling because of big-picture concerns since early 2025. Institutions are not abandoning Bitcoin; they are trading it like any other macro-sensitive asset. When things calm down in the world, investors start buying again. But when the Federal Reserve gets tough on interest rates, they pull back and switch to other investments. Institutions rotated into Treasuries as the 10-year yield climbed back toward 4.2%.
The Ethereum ETF Divergence
Interestingly, Ethereum ETFs bucked the trend on the very day Bitcoin ETFs saw their massive outflow. On March 18, spot Ethereum ETFs attracted $138.2 million in net inflows – their highest single-day intake since February 25 – with BlackRock’s ETHA leading at $81.7 million.
This change suggests a possible shift in investment strategy: after the Federal Open Market Committee meeting, Bitcoin’s potential risks and rewards became less appealing, so some big money investors might be moving to Ethereum, which is currently at $2,327 and has already gone through its downturn.
However, Ethereum ETFs have their own volatility. Earlier in the month, on March 6, spot ETH funds posted $82.85 million in net outflows, with Fidelity’s FETH accounting for $67.57 million of the exits.
What the Data Tells Us About What Comes Next
Three data points shape the near-term outlook.
The huge $708.7 million that investors pulled out after the FOMC decision may seem like a big deal, but it’s really just a tactical move, not a major structural change. Analysts at CryptoSlate describe it as a “flight to cash” triggered by compressed risk appetite, not a fundamental repricing of Bitcoin’s value proposition.
Second, the seven-day inflow streak demonstrated that institutional demand is not gone – it is waiting for clearer macro signals. With only one rate cut now projected for 2026, the next major catalyst will be whether inflation data supports or contradicts the Fed’s hawkish stance.
Third, total ETF holdings of 1.29 million BTC represent roughly 6.1% of Bitcoin’s circulating supply locked up in regulated vehicles. This supply absorption continues to tighten the available float, creating conditions for amplified price moves in either direction.
The tug-of-war between institutional accumulation instincts and macro headwinds will define Q2 2026. For now, the $70,000 level serves as the battleground.
This is not financial advice. DYOR. Data as of March 22, 2026.