
🕑 6 min read
Something snapped in Bitcoin’s dormancy data overnight.
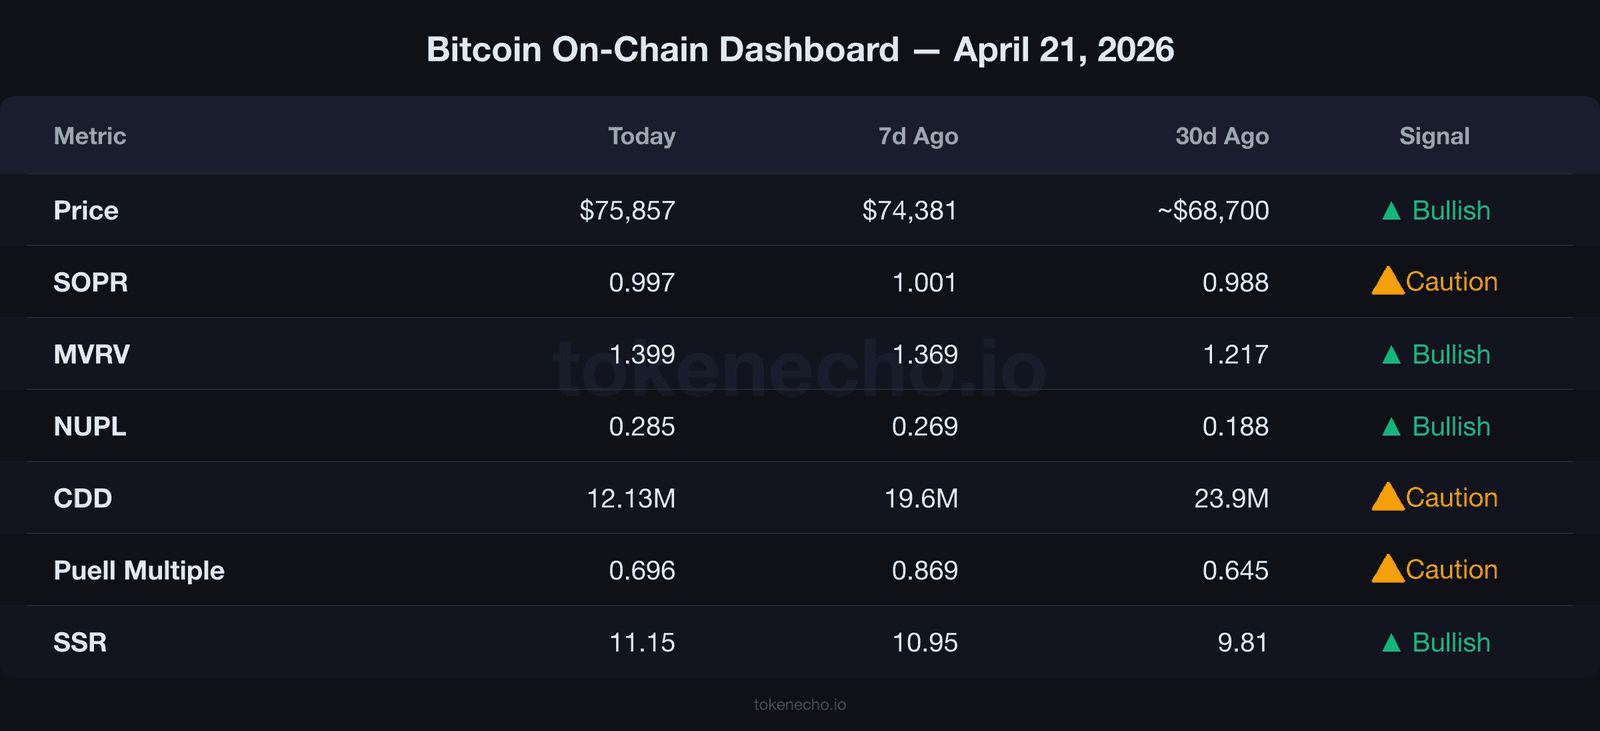
BTC trades at $75,857 on Tuesday morning, barely changed – up 0.68% in 24 hours, tucked inside a tight $74,828-$76,827 range. But underneath the flat price action, on-chain metrics reveal a tug-of-war between old holders liquidating and new buyers absorbing every coin.
Key Takeaways
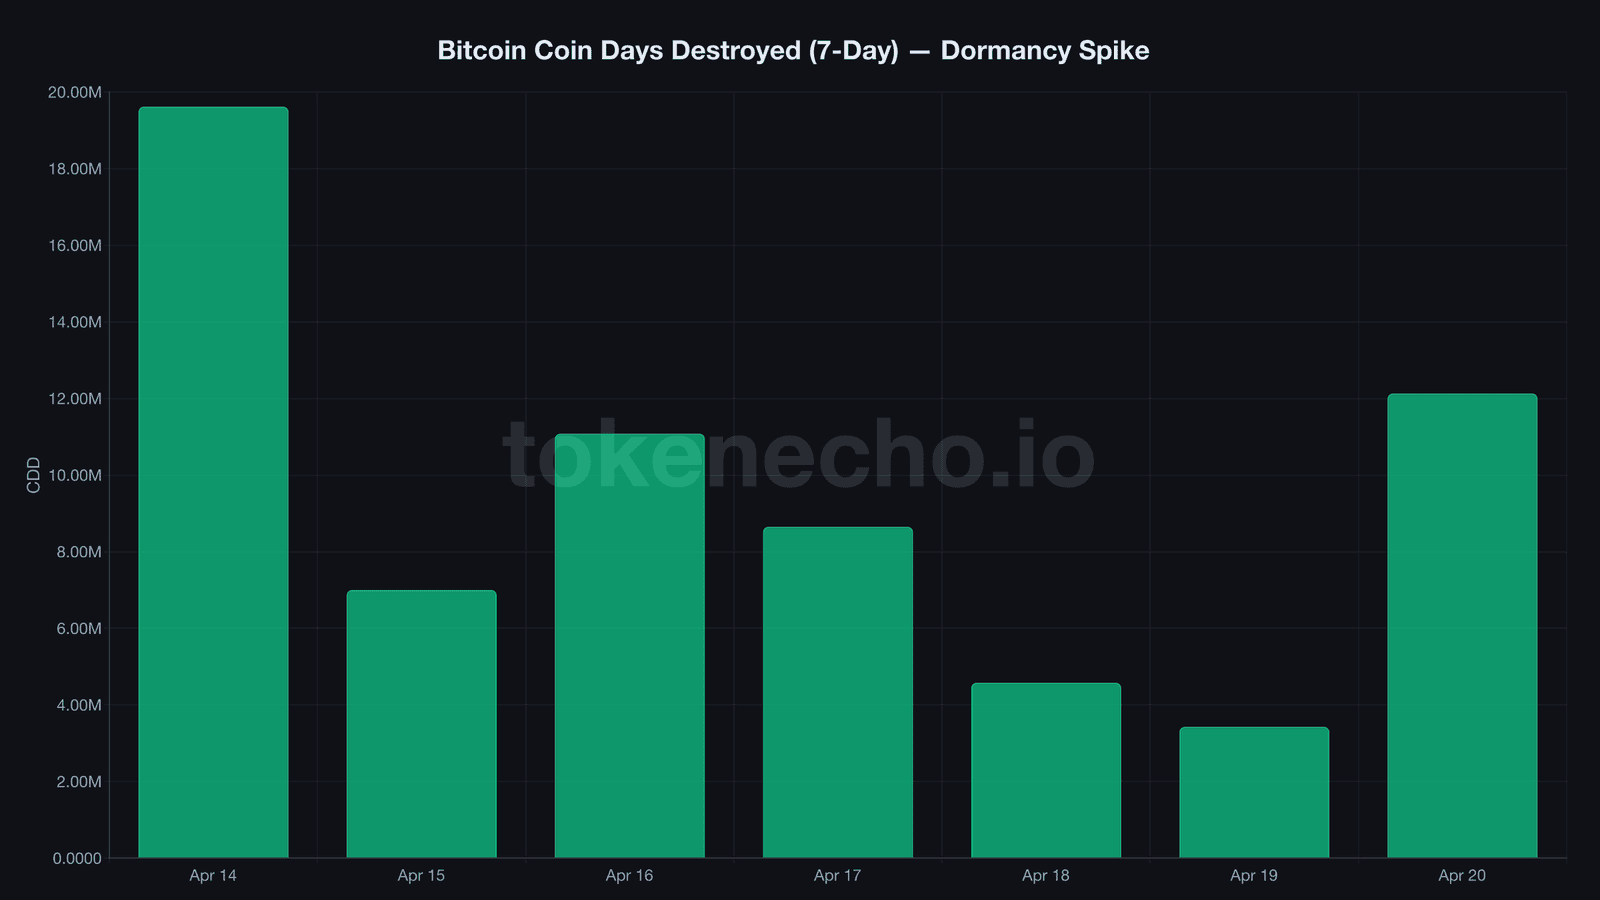
- Coin Days Destroyed spiked 3.5x to 12.13 million on April 20 – dormant BTC moved for the first time in weeks, but SOPR at 0.997 confirms they sold at a loss
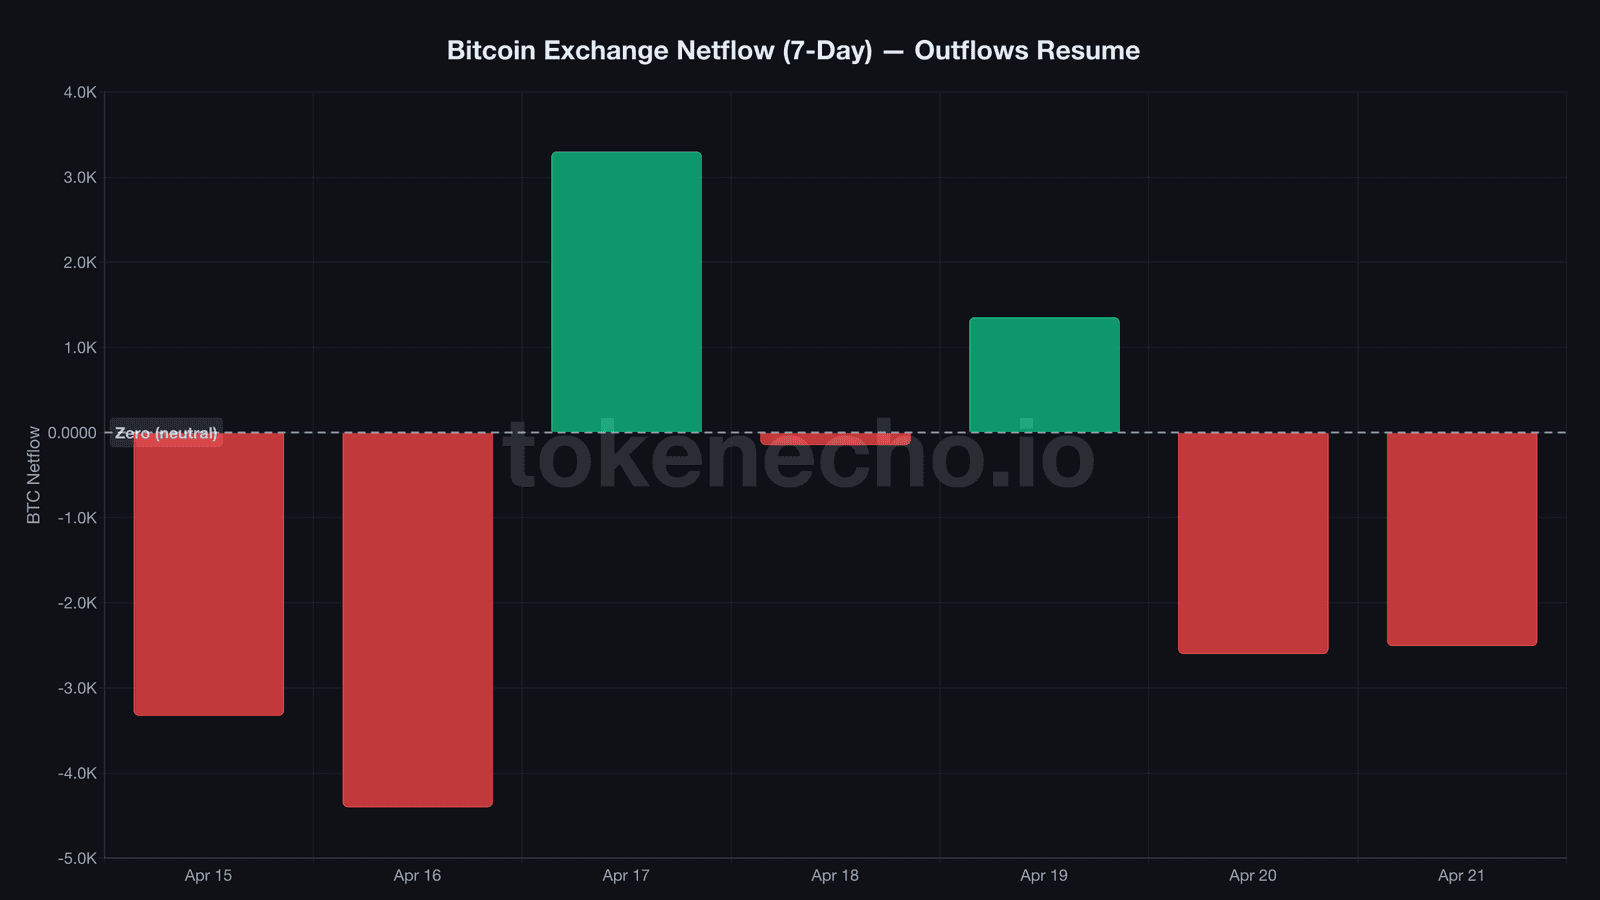
- Exchange netflows flipped to -5,112 BTC ($388 million) in 48 hours, reversing last week’s inflow trend – someone absorbed the capitulation and immediately withdrew
- Puell Multiple crashed 17.7% to 0.696 in a single day – miner revenue dropped sharply, squeezing supply from both the production and the exchange side
Dormant coins woke up – and immediately sold at a loss
12.13 million.
That’s the Coin Days Destroyed reading for April 20 – a 3.5x spike from the 3.43 million recorded just 24 hours earlier. CDD, a metric that tracks how “old” the coins are that just changed hands by multiplying BTC transacted by the days since each coin last moved, essentially works as a dormancy alarm.
When it spikes, someone who’d been holding for months – maybe years – decided today was the day.
And they sold at a loss.
SOPR, the spent output profit ratio that measures whether the average seller is profiting or bleeding on their transaction, sat at 0.997 on April 20. Below the critical 1.0 break-even line for the second straight day.
Bitcoin has rallied 15% from its March lows to $75,857 – and the average seller still can’t break even. For context, SOPR briefly touched 1.007 on April 17 during the Hormuz-driven rally to $78,240, then immediately sank back below 1.0.
We’ve tracked this dynamic before. On April 14, CDD hit 19.6 million – the cycle’s largest spike – and what followed was a push to $78,240, the highest price since early February. The current 12.13 million isn’t as dramatic. But the timing matters: it came after three straight days of declining dormancy (8.6M to 4.6M to 3.4M), meaning someone who was patiently waiting just ran out of patience.

It’s like watching an estate sale in real time. The previous owners are liquidating at prices they’d never have accepted a year ago – and a line of buyers stretches around the block, cash in hand.
$388M in BTC exits exchanges in 48 hours
So where did those coins go?
All-exchange netflows flipped sharply negative: -2,603 BTC on April 20, then -2,509 BTC on April 21. That’s 5,112 BTC – roughly $388 million – pulled into cold storage or self-custody in just two days.
‘Old whales are selling to TradFi,’ said Ki Young Ju, CEO of CryptoQuant, in a recent analysis of on-chain flow patterns.
The shoe fits. Institutional buyers – ETFs, Strategy with its 815,061 BTC treasury, and now Goldman Sachs with its pending covered-call BTC ETF – have been absorbing exactly the kind of coins that long-term holders are dumping at a loss.
Strategy alone bought $2.54 billion (34,164 BTC) in the past two weeks.
Binance tells the sharper story. The exchange shed 2,101 BTC ($159 million) over those same 48 hours.
Since early April, the drain totals over 20,000 BTC – roughly $1.5 billion pulled off the world’s largest exchange. Most traders can’t see this if they’re only watching the ticker.
But don’t mistake outflows for one-directional conviction. Just last week, +3,301 BTC flooded onto exchanges on April 17 as the $78K rally triggered profit-taking. The flow reversed in under 72 hours.
Tomorrow changes everything – or nothing. Trump’s Iran ceasefire deadline expires April 22, and the KelpDAO hack just erased $13.2 billion from DeFi in 48 hours. Capital is rotating into Bitcoin. Whether that lasts depends on what happens in the Strait of Hormuz.
Miner revenue crashes 18% while stablecoins pile up
The last time Puell Multiple hit 0.65, Bitcoin was two months away from tripling.
Puell Multiple, a ratio comparing daily miner revenue to its 365-day moving average, cratered from 0.846 to 0.696 between April 19 and April 20. An 18% single-day decline – the second-sharpest this cycle. Miners are earning barely 70% of their yearly average, which makes selling freshly mined BTC economically brutal.
Most won’t. Or can’t.
And the dry powder keeps building. SSR, the stablecoin supply ratio that measures Bitcoin’s market cap against total stablecoin supply, sits at 11.15. That’s roughly $148 billion in stablecoins parked on the sidelines – a loaded spring waiting for a trigger.
Who pulls the trigger first – the sellers running out of old coins, or the buyers waiting to deploy?
MVRV, the market value to realized value ratio showing aggregate unrealized profit, climbed to 1.399 – its highest reading in seven days.
Holders are sitting on roughly 40% unrealized gains on average, up from 22% a month ago. But that’s nowhere near the overheated 3.5+ zone that marked October 2025’s ATH.
NUPL, net unrealized profit and loss, confirms the recovery at 0.285 – firmly in the “hope” zone, well above the 0.188 capitulation flirtation we tracked in late March.
The last time this happened, BTC tripled in 90 days
A CDD spike during sustained SOPR readings below 1.0 has appeared only a handful of times this decade.
The closest rhyme: December 2022, one month after FTX collapsed and took Genesis, BlockFi, and $30 billion in customer assets with it. Long-term holders were capitulating – CDD spiked repeatedly above 15 million, SOPR stayed below 1.0 for weeks, and Puell Multiple bottomed at 0.45.
Bitcoin sat at $16,500 with the world convinced crypto was dead.
Within two months, it rallied 56%. Give it 90 days and it had nearly doubled to $25,800.
Current setup echoes that pattern – but the macro backdrop couldn’t be more different. In 2022, the contagion was crypto-native. Today it’s geopolitical (Iran, Hormuz, oil) and DeFi-structural (KelpDAO’s $292 million exploit, Aave’s $123 million bad debt exposure). The risk isn’t a bankrupt exchange. It’s a naval blockade.
On-chain scorecard (3 of 6 bullish)
- ✅ Exchange netflow: -5,112 BTC in 48h (accumulation)
- ⚠️ SOPR: 0.997 (sellers still bleeding)
- ⚠️ CDD: 12.13M spike (old coins distributing)
- ✅ NUPL: 0.285 (recovering from capitulation)
- ⚠️ Puell: 0.696 (miner revenue stress)
- ✅ SSR: 11.15 (stablecoin dry powder building)
TokenEcho Verdict
Direction: Cautiously bullish
Key level: $78,240 – the April 17 high. A sustained close above this on volume would confirm sellers are exhausted.
Risk factor: Iran ceasefire expires April 22. Rejection could trigger a risk-off wave, and the CDD spike suggests old holders still have more coins to sell.
This is an analytical assessment, not financial advice.
What to watch in the next 48-72 hours
- $78,240 breakout with 24h volume above $50B – bullish confirmation that seller exhaustion is real
- SOPR closing above 1.0 for three consecutive days – first sustained profitability since early April, a signal capitulation has run its course
- Iran ceasefire deadline April 22 – rejection plus a Hormuz re-closure scenario would test $73,854 support, Monday’s intraday low
This analysis is part of our daily Bitcoin price tracking. See all previous analyses and key metrics on our hub page.
The dormant coins are selling. The institutions are buying. Which side runs out of ammunition first defines the next leg – and we’ll know within 48 hours.
This is not financial advice. DYOR. Data as of April 21, 2026.
Sources: CoinGecko – Bitcoin | CryptoQuant – Exchange Flows | CryptoQuant – SOPR | CryptoQuant – CDD | CryptoQuant – Puell Multiple
See also: Bitcoin (BTC) Price Prediction 2026-2030
Leave a Reply