🕑 5 min read
The last time Bitcoin’s on-chain metrics looked this grim, Sam Bankman-Fried was being perp-walked out of a Bahamas courtroom. That was November 2022. BTC traded at $15,500.
Seventeen months later, it hit $73,000. A 370% rally.
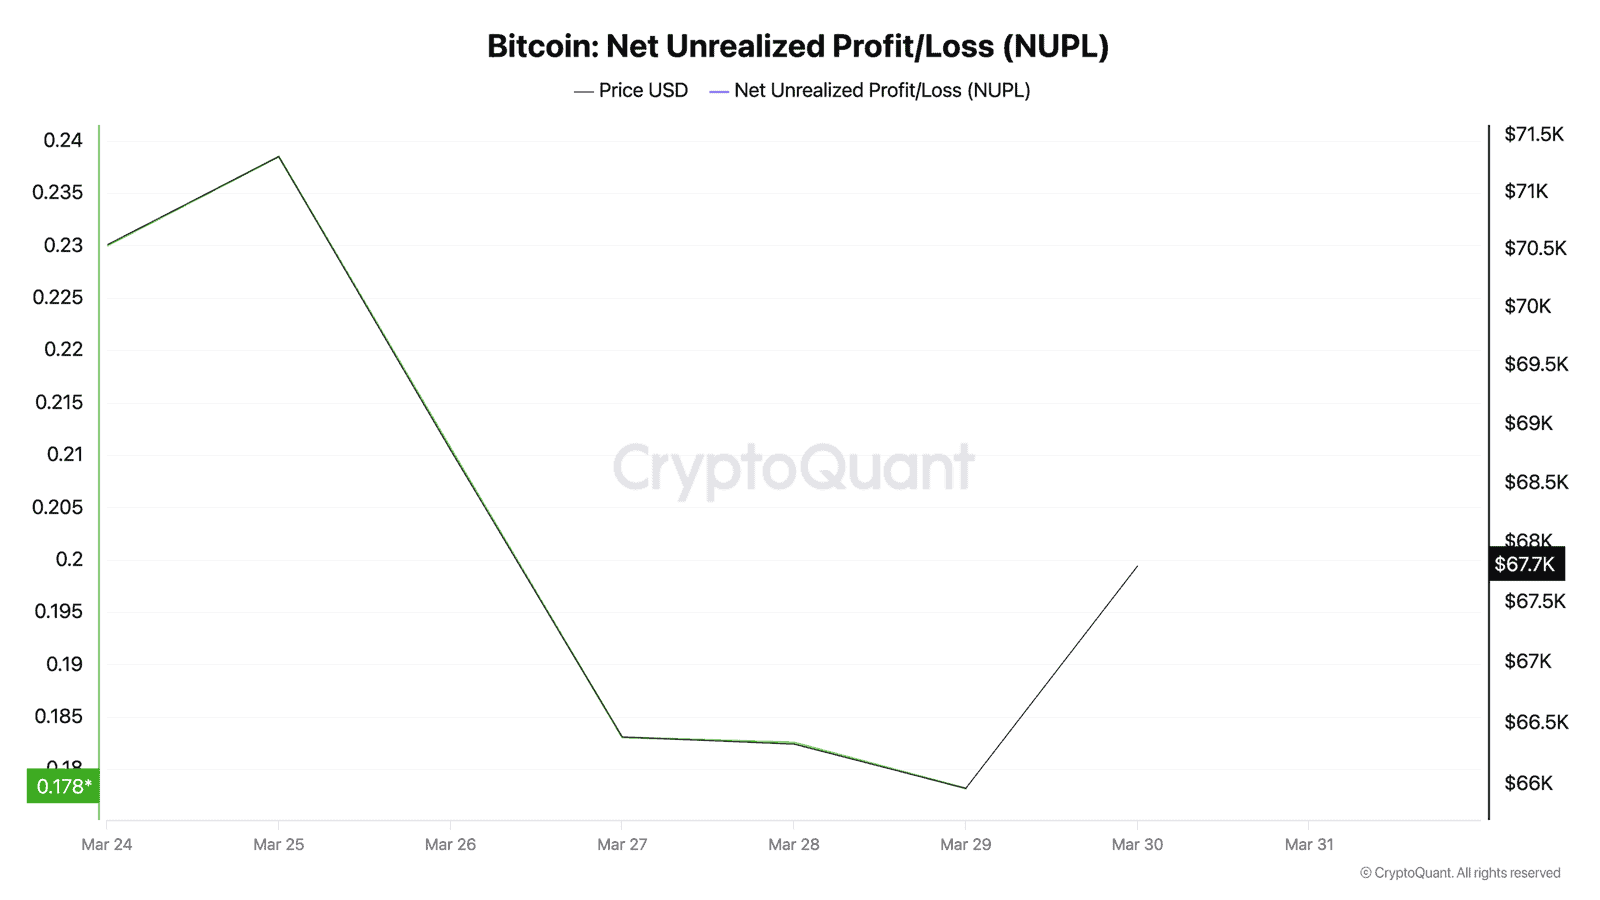
Now, in late March 2026, with Bitcoin grinding at $67,823 – down 46% from its October 2025 all-time high of $126,080 – the same capitulation signals are stacking up again. NUPL, a metric that tracks how much unrealized profit or loss exists across the entire network, just slid to 0.178. That’s the lowest since the February crash, and it’s still falling.
But the FTX comparison isn’t just about one indicator. It’s the convergence.
Forty-Six Days and Counting
Bitcoin’s Fear & Greed Index has been stuck in “Extreme Fear” for 46 consecutive days. That’s the longest unbroken streak since the FTX collapse – and it’s not even close to ending.
SOPR, the ratio measuring whether coins move at a profit or loss, has printed below 1.0 for eight straight days. Every transaction on the Bitcoin network, on average, is locking in a loss.
And long-term holders – the diamond hands who survived Luna, COVID, and the 2018 bear – recently sold at a 24% loss, crashing LTH-SOPR from 1.94 to 0.72 in just five days.
That 0.72 reading meant veterans were dumping coins they’d bought at much higher prices. The last time long-term holders capitulated this aggressively? FTX.
90% of Old Coins Stopped Moving
Something weird happened after March 22.
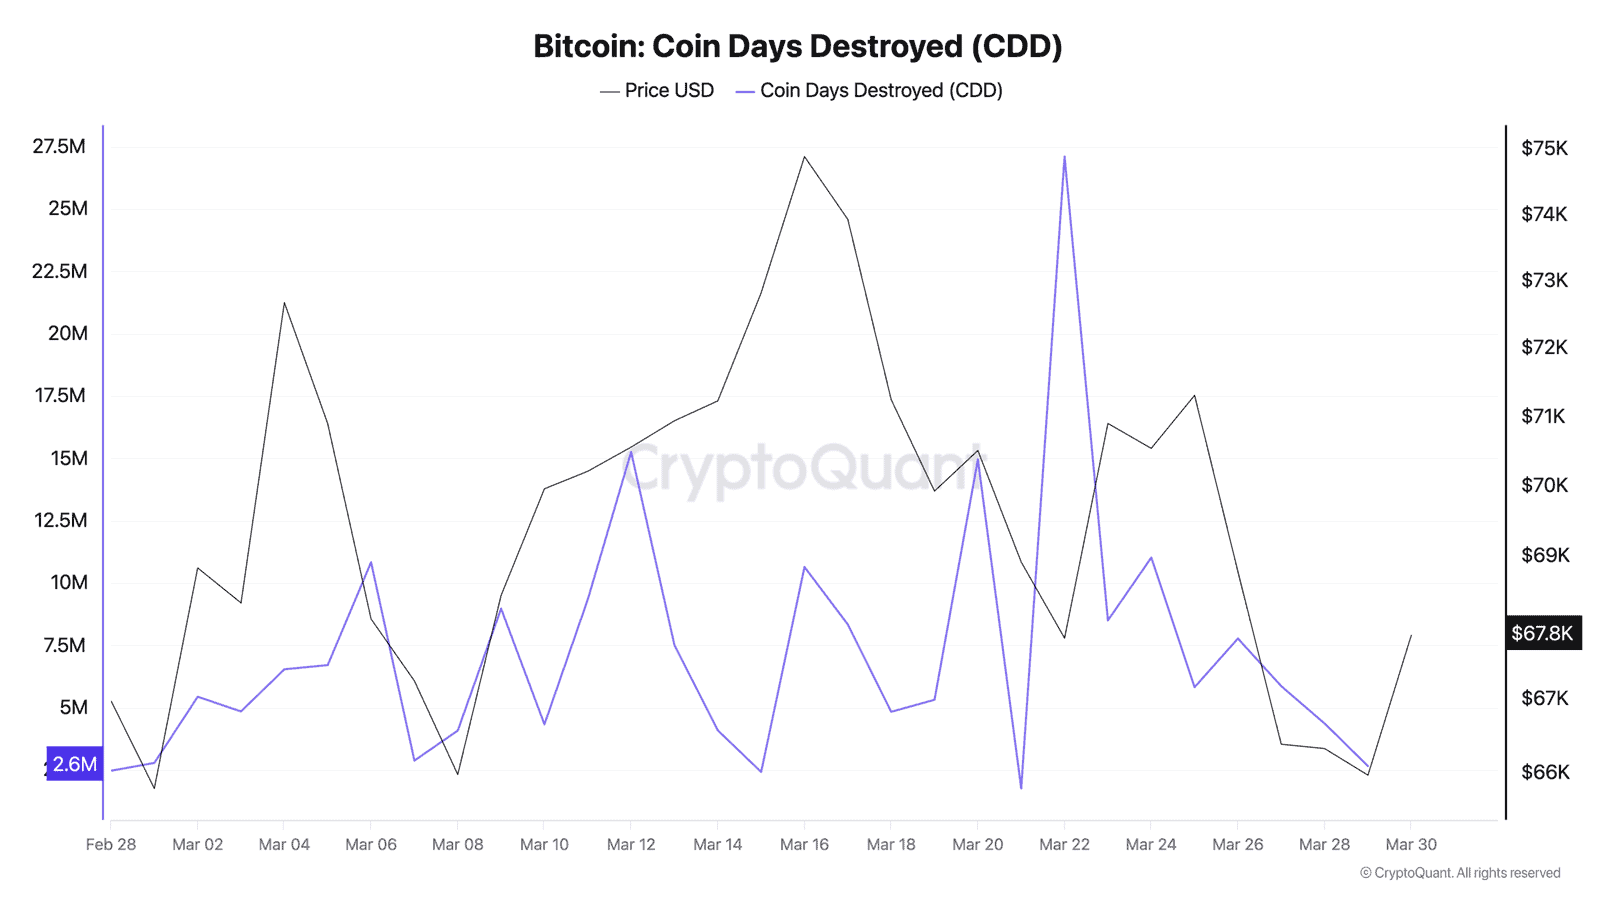
On that day, Coin Days Destroyed – a metric that spikes when long-dormant coins suddenly move – hit 27.1 million. Massive flush. Old coins that hadn’t budged in years got sold in what looked like a final panic event.
Since then? Silence.
CDD collapsed to 2.66 million by March 29. That’s a 90% drop in seven days. Binary CDD, which flags abnormal destruction events, has printed zero for seven straight days. The coins that survived the March 22 flush aren’t going anywhere.
This pattern – a CDD spike followed by rapid collapse – is the on-chain equivalent of a forest fire burning through deadwood. Everything flammable already burned. What’s left won’t catch.
Miners Were Supposed to Be Dead
Four days ago, we reported that Bitcoin miners were losing $19,000 on every coin produced. Hash price sat at all-time lows. Core Scientific dumped $175 million in BTC. MARA sold everything they mined.
The narrative was simple: miners are capitulating.
Except they stopped.
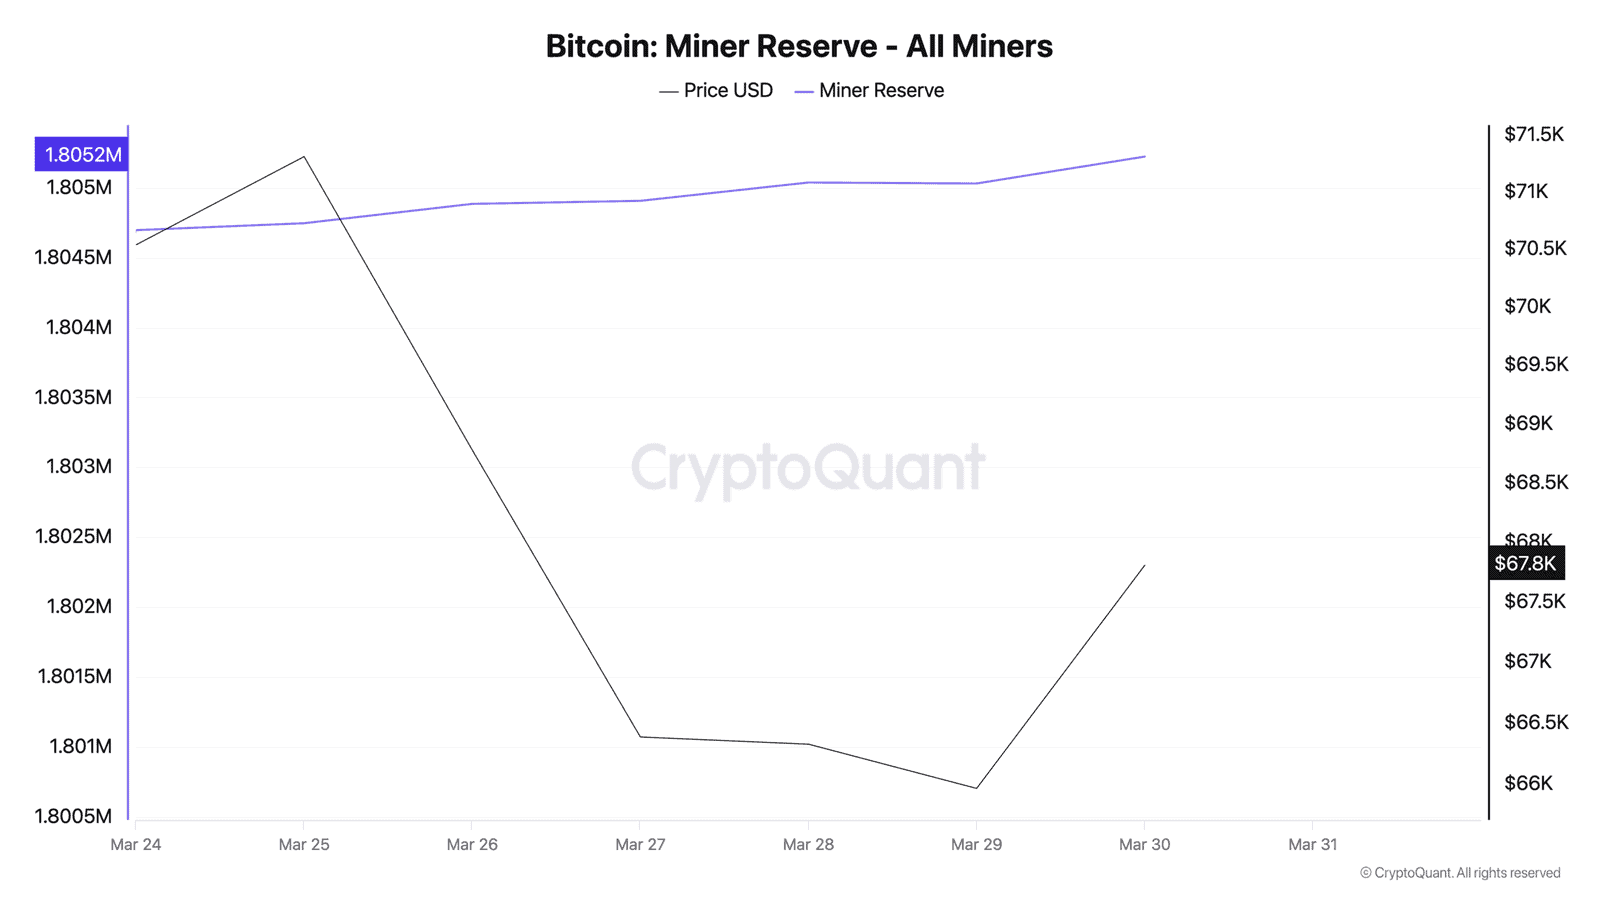
Miner reserves climbed from 1,800,701 BTC on March 23 to 1,805,031 by March 29. That’s 4,329 BTC added to miner vaults in a single week – while the market screamed about capitulation. The Puell Multiple, which compares daily miner revenue to its yearly average, reads 0.675. Below 0.5 is “deep undervaluation.” We’re knocking on the door.
“Miner capitulation is a contrarian signal that historically indicates renewed Bitcoin price momentum,” said Matthew Sigel, Head of Digital Assets Research at VanEck, in a December 2025 note that’s aging remarkably well.
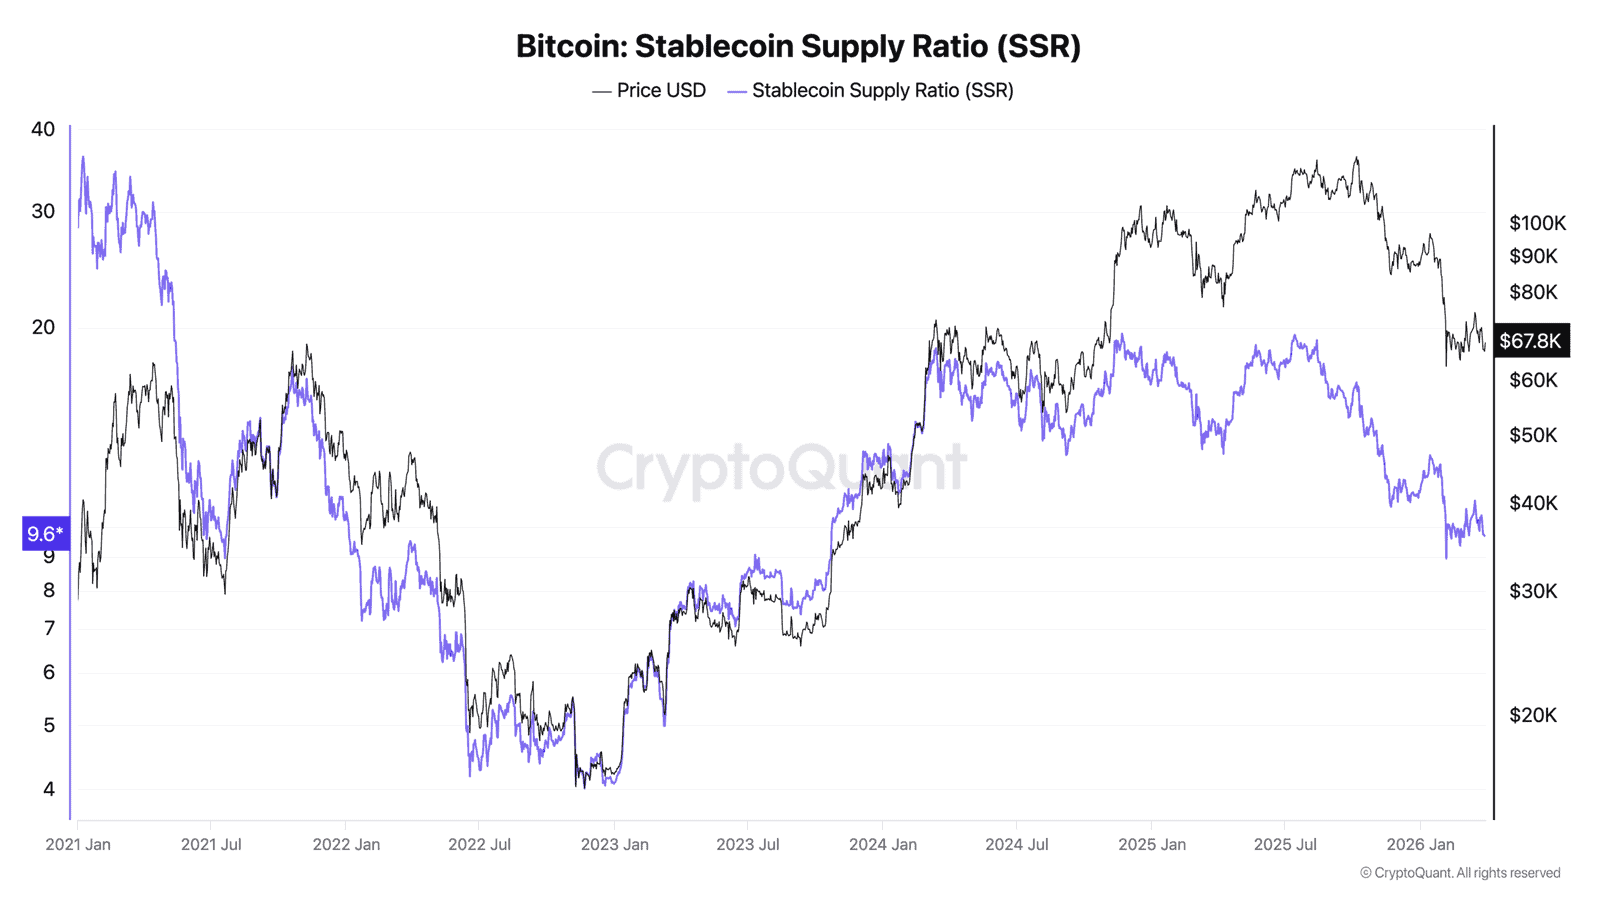
The $139 Billion Nobody’s Spending – Yet
The Stablecoin Supply Ratio just dropped to 9.68 – lowest in 14 days, down from 10.95 two weeks ago. Lower SSR means more stablecoin buying power relative to Bitcoin’s market cap.
Translated: roughly $139 billion in stablecoins is parked on exchanges and in wallets, waiting. That’s the most dry powder relative to BTC’s size in two weeks, and it’s been building steadily since mid-March.
Total crypto market cap sits at $2.42 trillion. BTC dominance hovers at 56.1%. Volume hit $78.3 billion in the past 24 hours – not exactly a ghost town.
So where’s the disconnect? Fear at extremes, everyone selling at a loss, but capital keeps accumulating on the sidelines. This is the setup Buffett would recognize: everyone running for the exits while cash piles up by the door.
The FTX Playbook
After the FTX collapse, Bitcoin’s NUPL plunged into deep negative territory. SOPR stayed below 1.0 for weeks. CDD spiked and then flatlined. Miners capitulated and then went quiet.
Sound familiar?
BTC bottomed at $15,500 in November 2022. By January 2023 – barely 30 days later – it had already reclaimed $23,000. Within 17 months, it hit $73,000.
The current MVRV ratio reads 1.217, declining toward 1.0 – effectively “book value” for the Bitcoin network. During FTX, MVRV dropped below 1.0 for the first time since March 2020. We’re not there yet. But the trajectory is unmistakable.
Nobody’s saying this is an exact replay. The macro environment is different – the Iran situation, 4.5% Treasury yields, and Bitcoin ETF outflows of 5,974 BTC last week add layers of uncertainty that didn’t exist in 2022.
What Could Derail It
Not everything in this data screams “buy.”
Exchange netflows flipped positive five days ago. Since March 26, roughly 5,866 BTC have flowed INTO exchanges – a sharp reversal from the 23,108 BTC that left between March 22-25. More coins on exchanges typically means more selling pressure ahead.
The estimated leverage ratio sits at 0.236, still elevated after a 12% surge earlier this month. High leverage in a fearful market is a liquidation cascade waiting to happen.
And ETFs aren’t helping. Fund holdings dropped to 1,318,737 BTC, shedding nearly 6,000 BTC in one week. Institutional money hasn’t panicked – but it’s definitely not buying.
The gap between on-chain accumulation signals and institutional outflows is the widest it’s been all year. Something has to give.
This is not financial advice. DYOR. Data as of March 30, 2026.
Sources
- CryptoQuant – NUPL, SOPR, CDD, exchange flows, miner reserves, SSR, leverage ratio, ETF holdings
- CoinGecko – BTC price, market cap, ATH, supply data
- VanEck Research – Miner capitulation analysis (December 2025)
Leave a Reply