
🕑 5 min read
$2.7 trillion. That’s what the crypto market is “worth” right now. The number sounds healthy.
It isn’t.
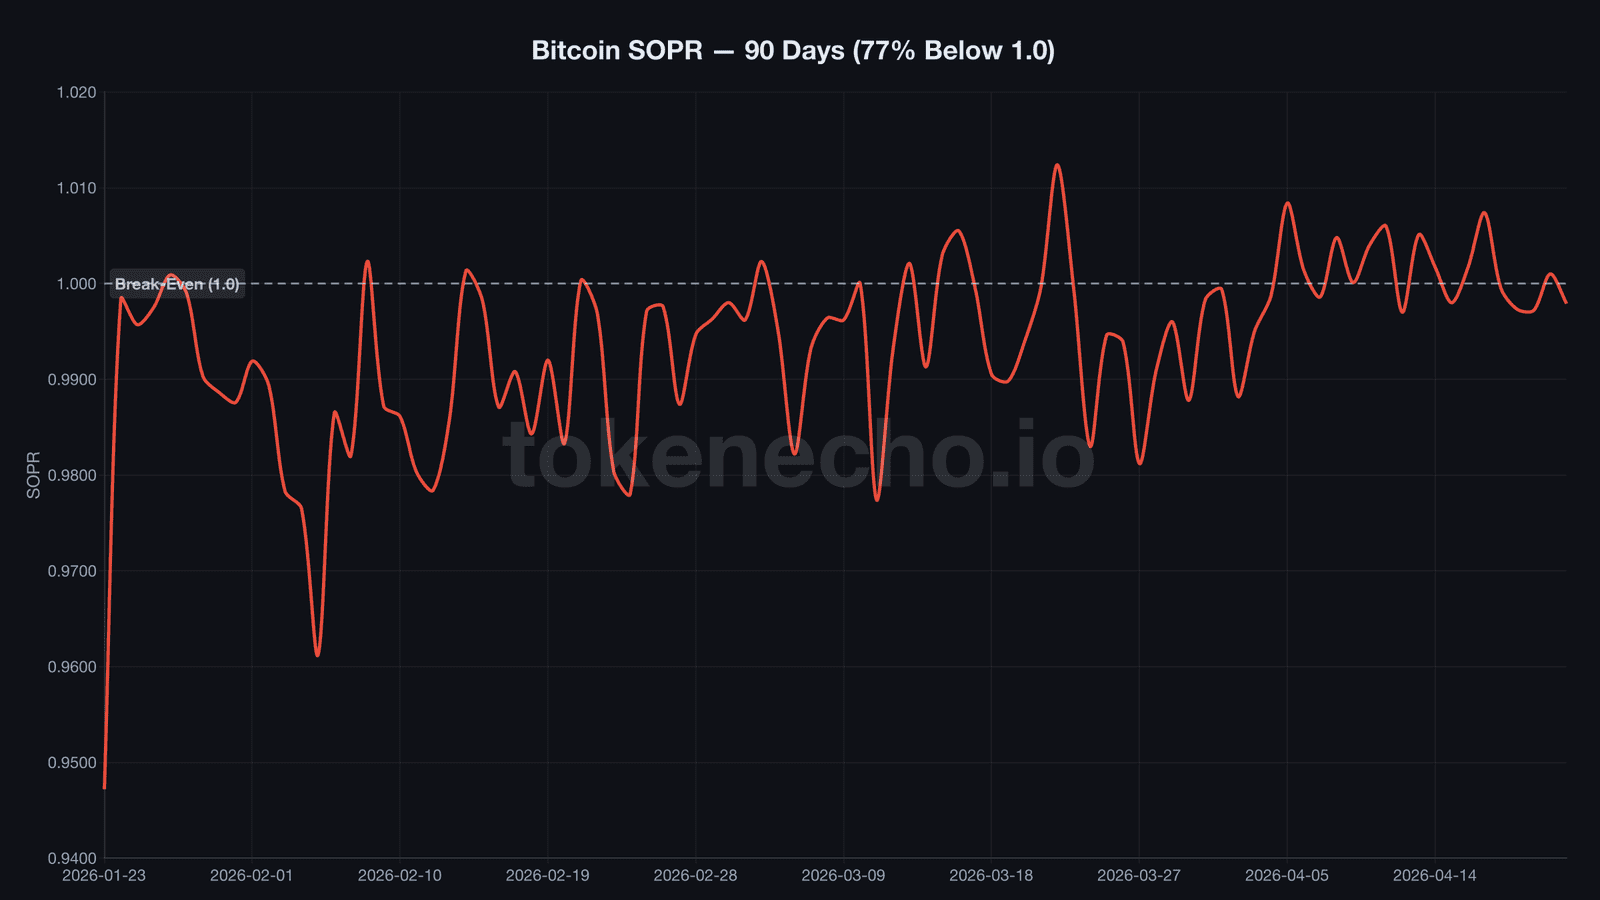
Bitcoin’s SOPR, the ratio that measures whether sellers are taking profits or losses, has spent 69 of the last 90 days below 1.0. Not a typo. Seventy-seven percent of the time, every single person who sold Bitcoin did it at a loss. The 30-day average sits at 0.9934, and the market stopped treating it as a crisis roughly six weeks ago.
NUPL, the net unrealized profit/loss metric tracking aggregate holder sentiment, tells the same story from a different angle. It spent 63 of those 90 days below 0.25 – the threshold separating hope from fear. The floor hit 0.119. We haven’t seen that number since FTX blew up.
On March 22, Coin Days Destroyed spiked to 27.1 million. Long-term holders, the cohort that famously never sells, dumped coins at a 28% loss. LTH-SOPR crashed to 0.72.
“This looks like late-cycle distribution,” said Benjamin Cowen, a quantitative crypto analyst, back in early April.
Distribution implies someone is distributing TO someone. Who was buying?
77 days of red ink – and it barely made the news
Key Takeaways:
- Bitcoin’s SOPR stayed below 1.0 for 69 of the last 90 days. That means 77% of the quarter, every seller took a loss. Average SOPR: 0.9934.
- Ten major altcoins sit 82-98% below their all-time highs. Polkadot lost 97.8%. And $278B in stablecoins isn’t “dry powder” – it’s capital that already walked out the door.
- Strategy spent $2.54B buying Bitcoin. Goldman Sachs filed its first BTC ETF. Exchange reserves hit a cycle low. Someone treated your panic as a Black Friday sale.
From Polkadot to Ethereum, the wreckage goes deeper
What does -97.8% look like in dollar terms?
If you bought $10,000 of Polkadot at its all-time high of $55, you now hold $222. That’s not a portfolio. That’s a rounding error.
And DOT isn’t the worst outlier. It’s the poster child. Cosmos lost 95.7%. Avalanche, 93.6%. NEAR, 93.2%. Uniswap, 92.8%. Cardano, 92%. These aren’t obscure microcaps – they’re top-50 projects with dedicated teams, active roadmaps, and conference keynotes that once packed ballrooms.
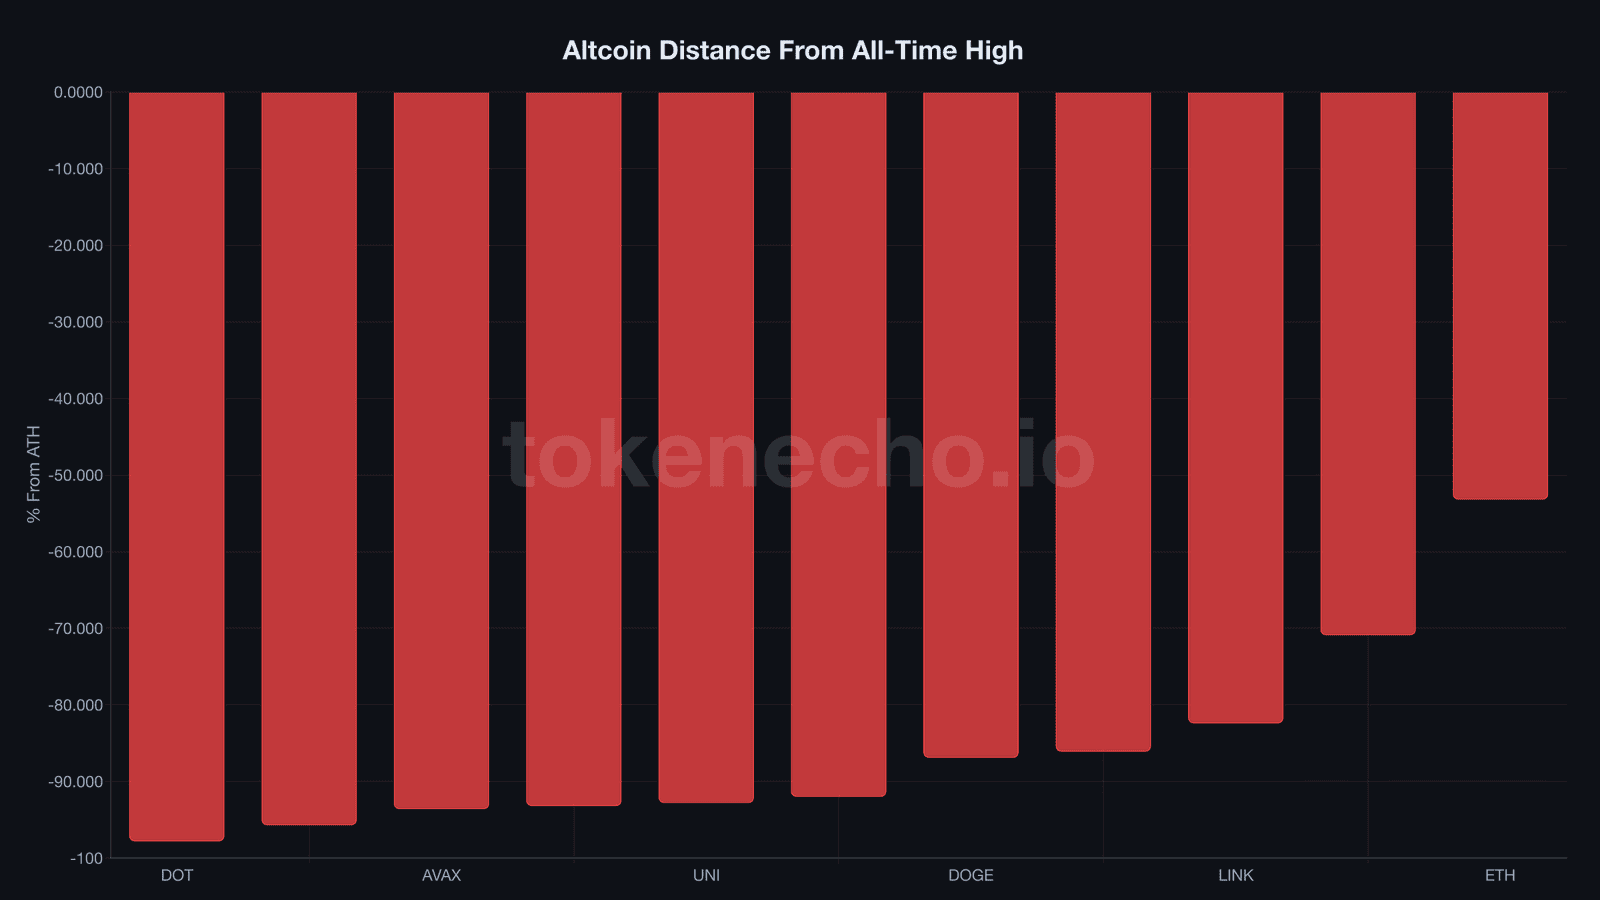
Ethereum, the second pillar of the entire industry, trades at $2,312. Down 53.2% from its August 2025 high of $4,946. ETH/BTC clings to 0.0297, a five-year low. The “flippening” crowd has gone quiet. So has most of DeFi.
Then there’s the $278 billion elephant. USDT alone holds $189 billion. USDC another $78 billion. Crypto Twitter loves calling this “dry powder waiting on the sidelines.” But capital sitting in stablecoins for three straight months isn’t gearing up for a dip buy. It already sold the dip. It’s not dry powder – it’s a white flag.
Calling $278 billion in stablecoins an “army waiting to deploy” is like calling a hotel full of evacuees a militia. They’re not preparing to fight. They already left the building.
Follow the $5 billion – the buyers who needed your panic
So who, exactly, was on the other side of all that selling?
The last time SOPR stayed below 1.0 for this long was November 2022, right after FTX collapsed. BTC sat at $16,500. Within 90 days it doubled. Within five months it tripled to $49,000. But back then, spot ETFs didn’t exist. Strategy was considered reckless. Goldman Sachs wouldn’t touch crypto with a ten-foot pole.
This time? Strategy dropped $2.54 billion on 34,164 BTC in a single purchasing spree – the largest corporate buy in its history – while SOPR was printing 0.99. They weren’t buying in spite of the fear. They were buying because of it.
Goldman Sachs filed its first-ever Bitcoin ETF in April. Morgan Stanley launched MSBT at 0.14%, undercutting BlackRock by 44%. ETF inflows hit $1.28 billion in four days during the week of April 14-17, including a single-day record of $663.9 million.
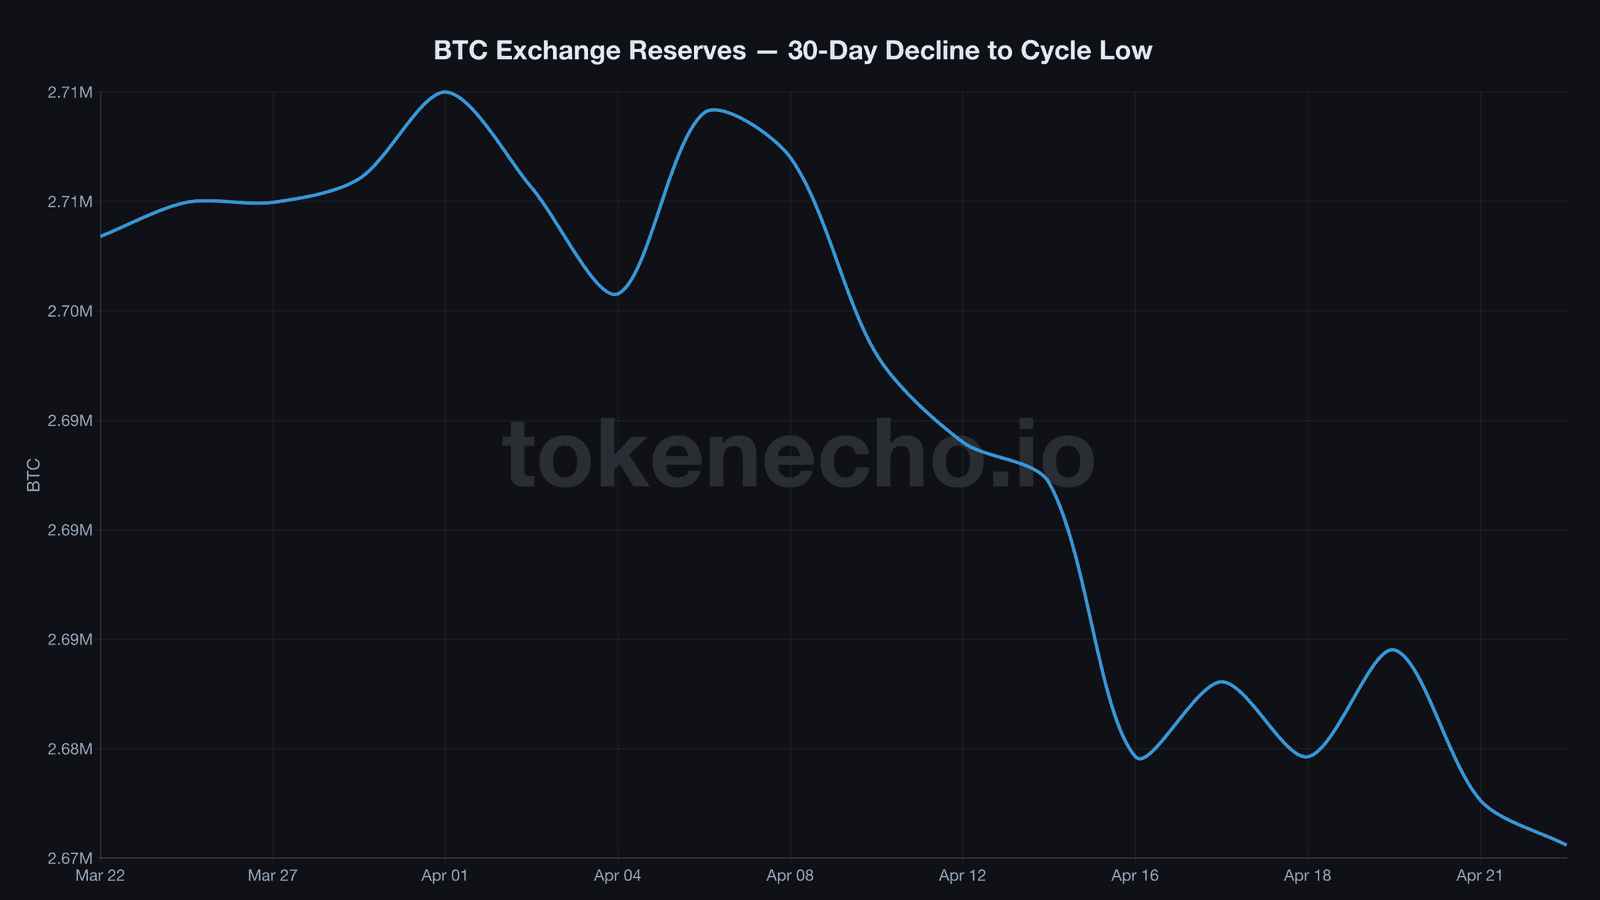
Exchange reserves dropped to 2,675,592 BTC – a cycle low. Someone pulled over $1.6 billion in BTC off Binance alone in 13 days.
“Old whales are selling to TradFi,” said Ki Young Ju, CEO of CryptoQuant. “The transfer is happening in real time.”
Read that again. The same three months where 77% of sellers lost money were the same three months where institutions bought more Bitcoin than any quarter in history. That’s not a coincidence. That’s a business model.
The FTX playbook is running again
The last time this constellation appeared – SOPR below 1.0 for weeks, NUPL near capitulation, miners bleeding with Puell under 0.70 – was the FTX bottom. BTC went from $16,500 to $49,000 in five months. A 197% return.
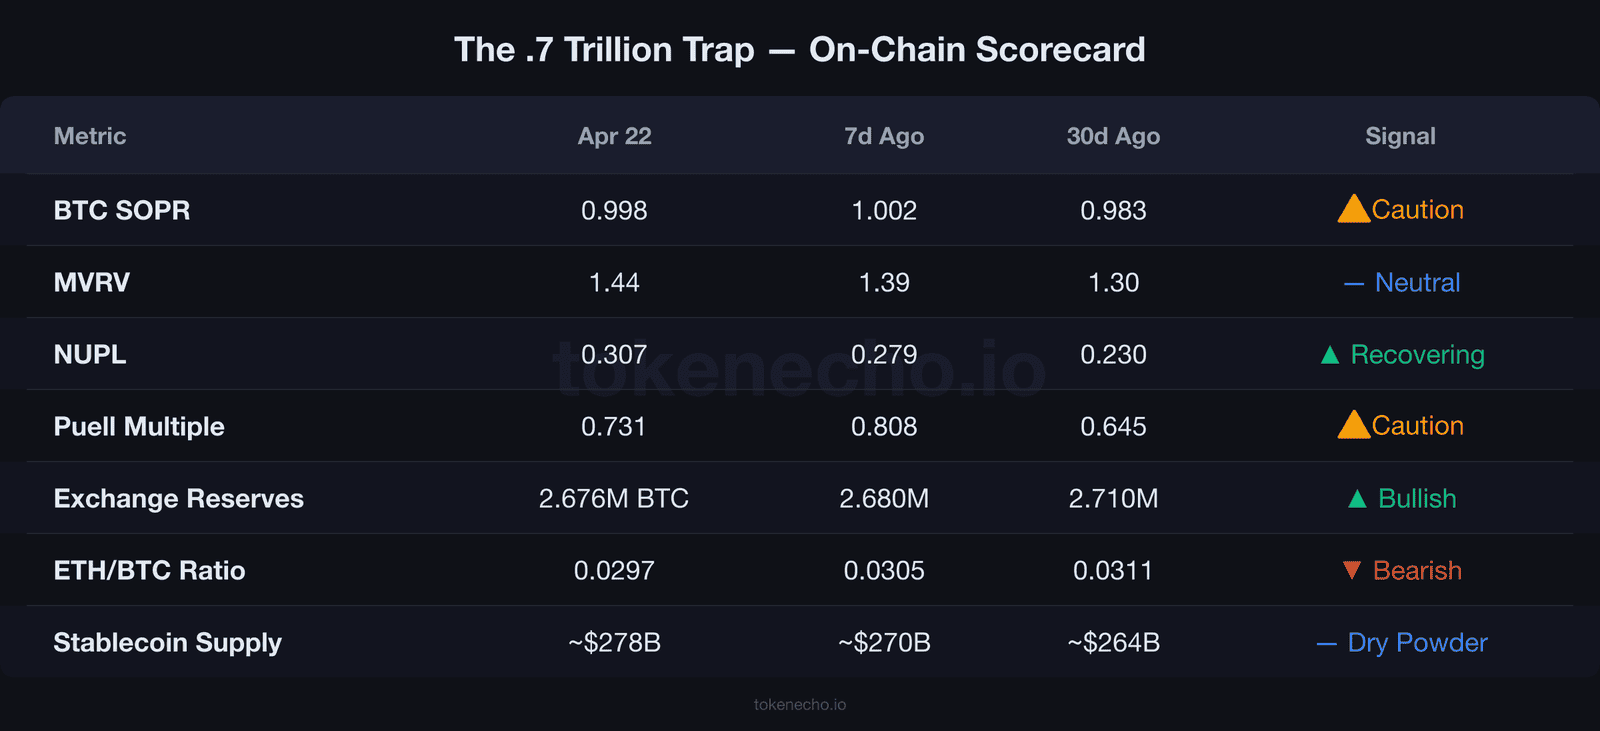
Current setup: SOPR at 0.998 (69 of 90 days below breakeven), NUPL recovering from 0.119 to 0.307, Puell at 0.731, exchange reserves at cycle lows.
The difference that should keep both bulls and bears up at night? In 2022, there were no ETFs. No Goldman Sachs filing. No Morgan Stanley competing on fees. No $278B stablecoin stockpile. The infrastructure for a supply shock didn’t exist.
It does now. Whether it fires is a different question entirely.
On-chain scorecard (2 of 6 bullish)
- ⚠️ SOPR: 0.998 – sellers still losing, approaching breakeven
- ✅ Exchange reserves: 2,675,592 BTC – cycle low, supply squeeze building
- ⚠️ NUPL: 0.307 – recovering from capitulation, still in hope/fear zone
- ⚠️ Puell Multiple: 0.731 – miners earning 27% below yearly average
- ✅ Institutional buying: Strategy $2.54B + Goldman/Morgan ETFs + $1.28B weekly inflows
- ❌ ETH/BTC: 0.0297 – 5-year low, altcoin weakness unresolved
TokenEcho Verdict: Cautiously bullish
Key level: $78,240 – April high. A break above confirms the wealth transfer is working in the buyers’ favor.
Risk factor: If institutional buying slows – ETF outflows resume, Strategy pauses purchases – the “trap” snaps shut on the trappers.
This is an analytical assessment, not financial advice.
What to watch next
- SOPR crossing above 1.0 with conviction (3+ consecutive days) would confirm sellers are finally breaking even for the first time since January
- BTC exchange reserves dipping below 2,670,000 would signal the supply squeeze is accelerating, not stalling
- ETH/BTC reclaiming 0.032 marks the first reversal of the 5-year decline – its failure confirms the altcoin carnage isn’t over
For a deeper look at how we track these signals, visit our Bitcoin price analysis hub. Related: Bitcoin hasn’t been this close to FTX-level capitulation, the $14,000 profit margin story, Bitcoin’s longest panic since FTX.
The data draws two pictures. One where the fear was real and deserved. Another where it was manufactured and consumed. Which version you believe depends entirely on which side of the $5 billion you ended up on.
This is not financial advice. DYOR. Data as of April 23, 2026.
Sources: CryptoQuant (SOPR, MVRV, NUPL, Puell Multiple, exchange reserves), CoinGecko (prices, ATH data, stablecoin supply), SEC EDGAR (Goldman Sachs ETF filing), Strategy 8-K filings.
Leave a Reply