
🕑 6 min read
Every data point this cycle has said Bitcoin sellers are exhausted. But at $78K, you’d expect at least some of them to take profit and walk.
Instead, 5,946 BTC ($464M) left exchanges on April 21. That’s the biggest single-day outflow in over a week.
And the coins that DID sell? Their owners made money for the first time in weeks.
Key Takeaways
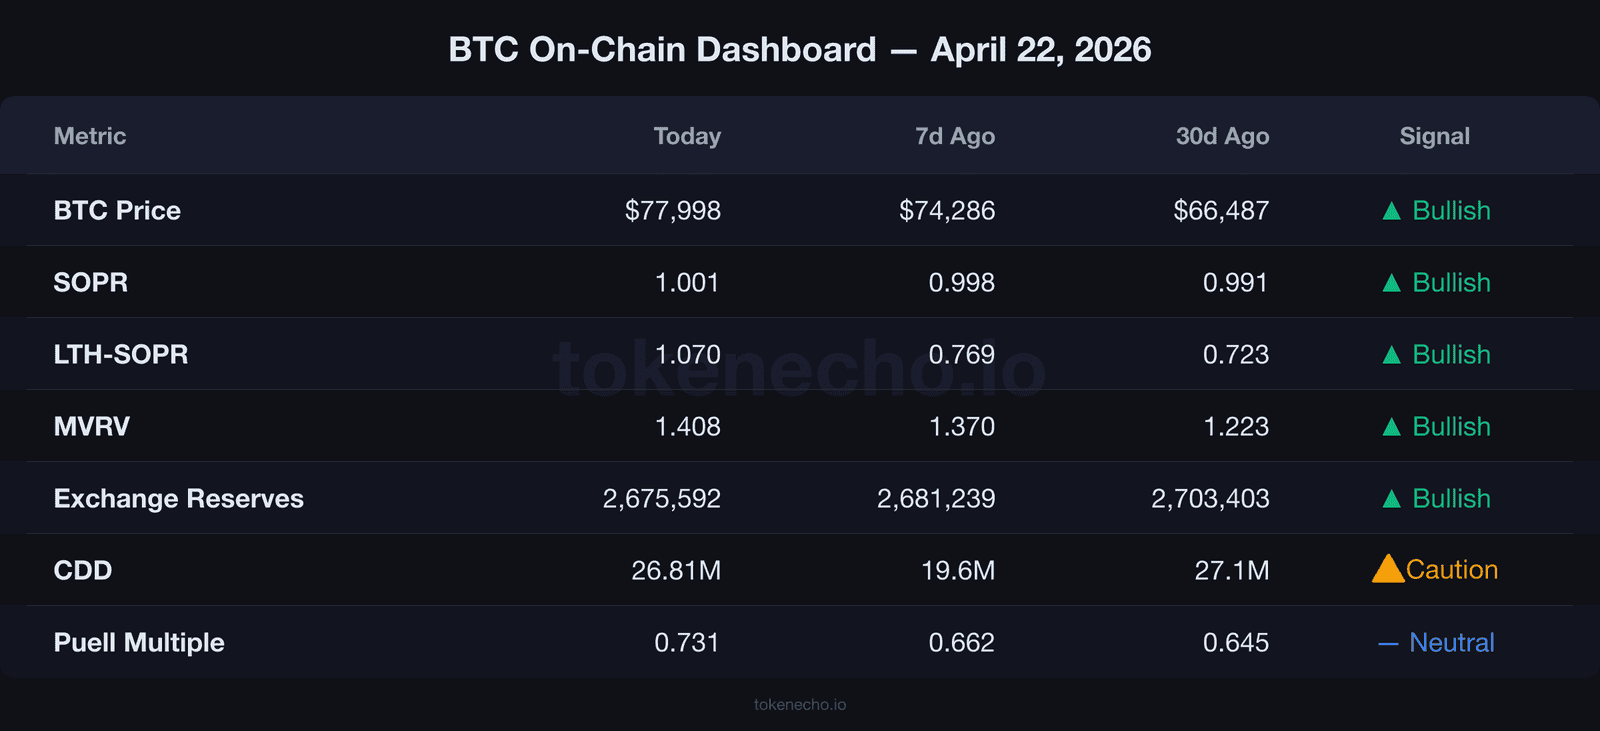
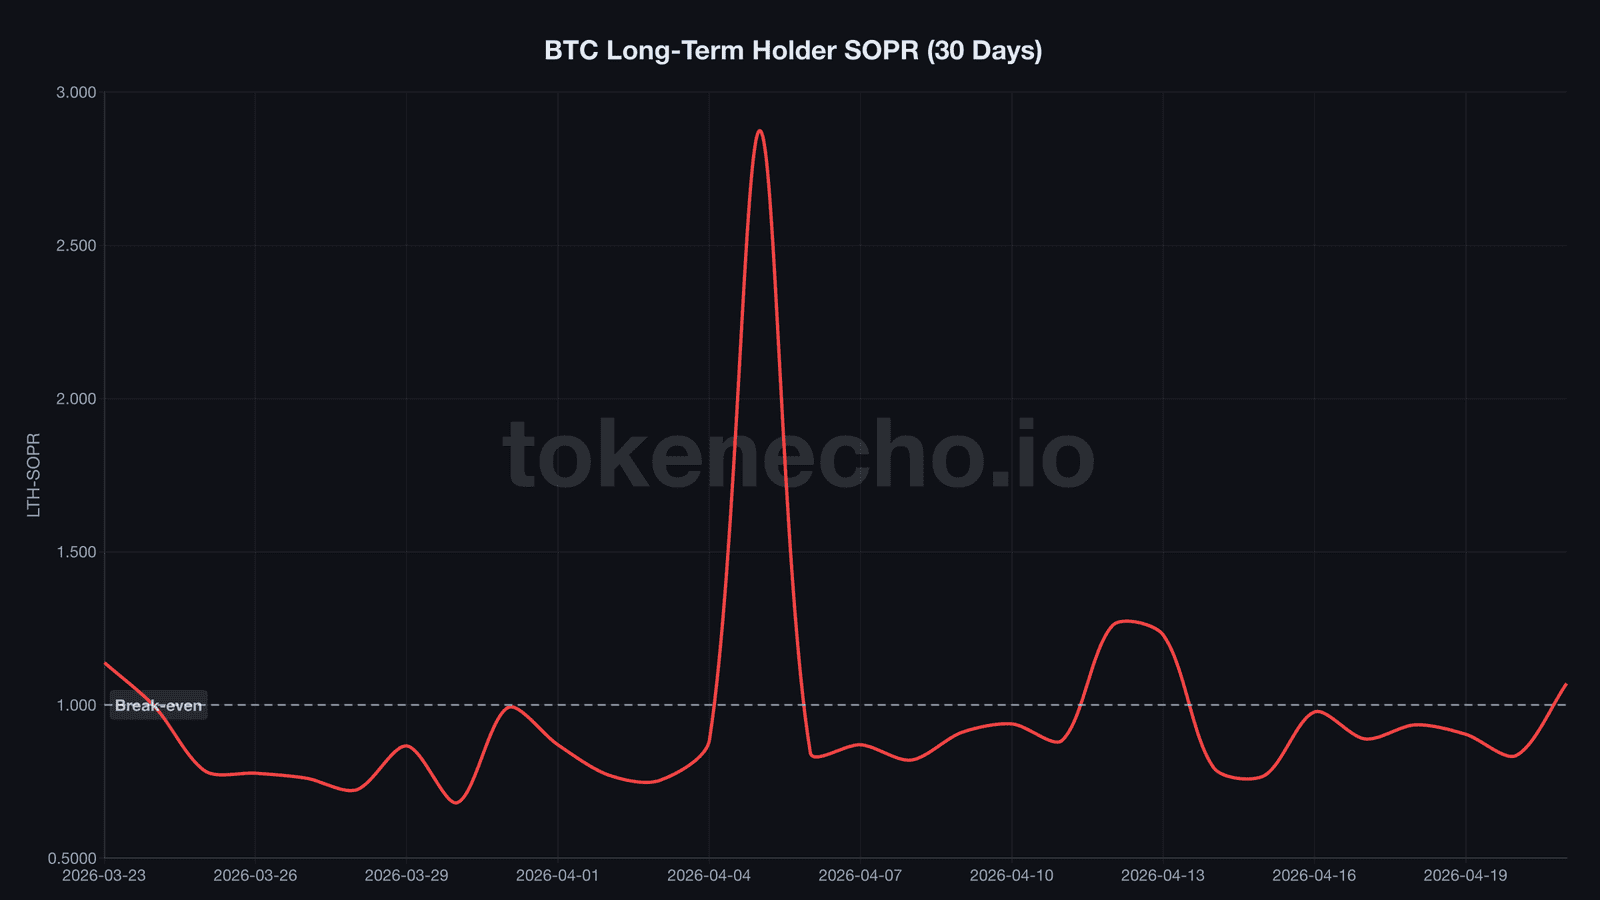
- LTH-SOPR, a metric that tracks whether long-term holders sell at a profit or loss, jumped from 0.835 to 1.070 overnight. That’s a swing from 16.5% loss to 7% profit in a single day.
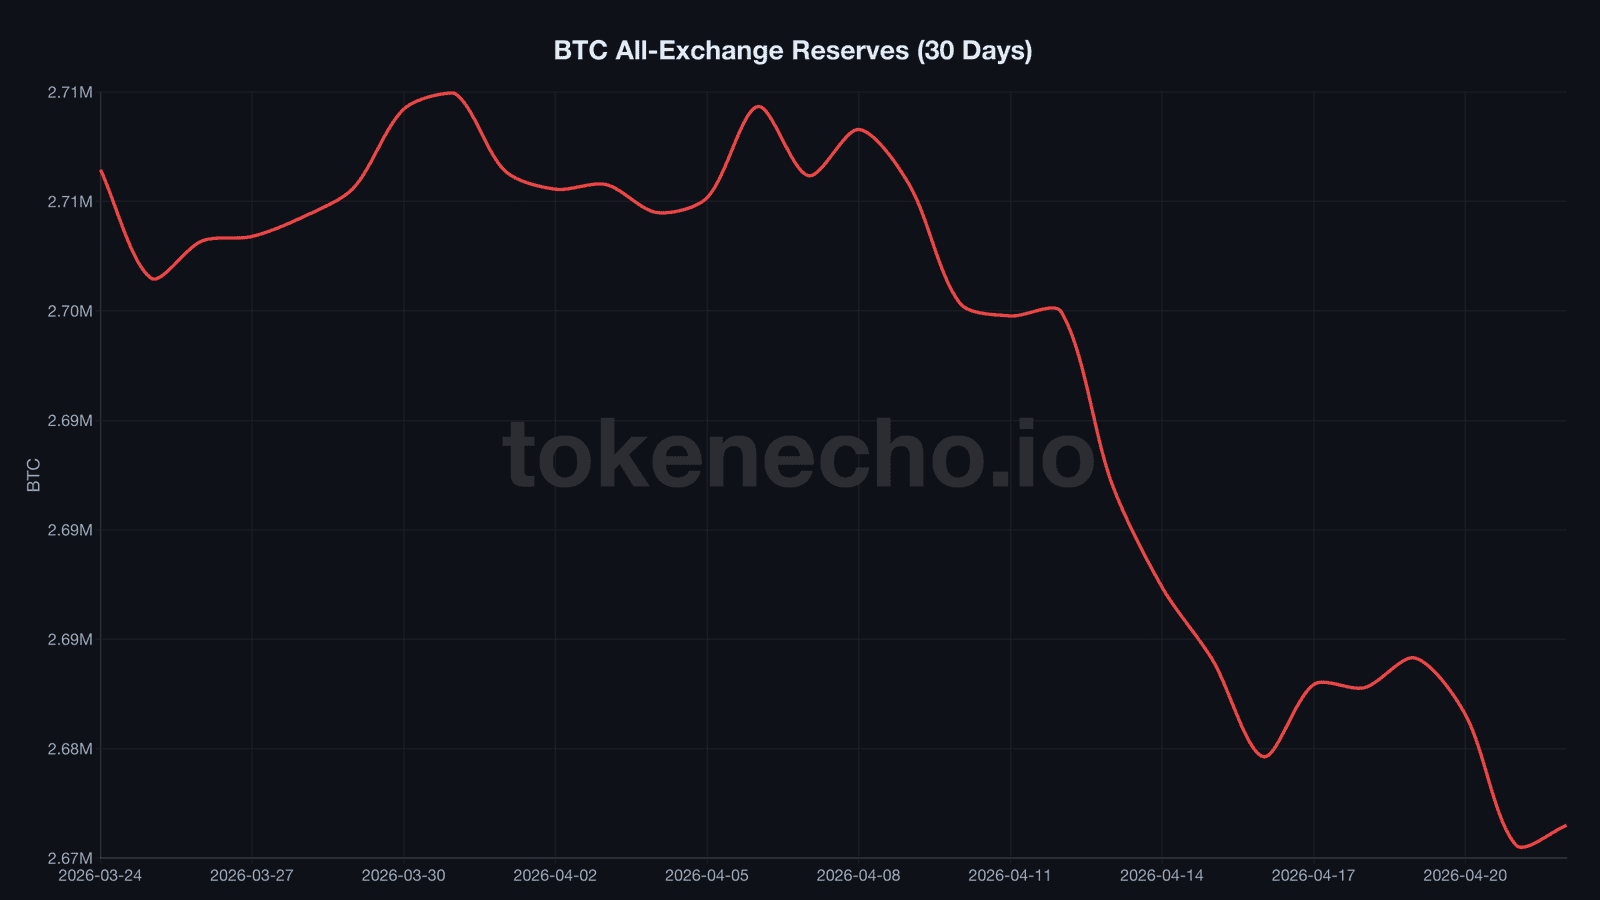
- All-exchange reserves dropped to 2,675,592 BTC, a new cycle low, as 5,946 BTC ($464M) left in 24 hours.
- Trump extended Iran’s ceasefire indefinitely on April 21, removing the market’s most immediate macro headwind. The naval blockade on Iranian ports remains.
Old coins moved at crash levels – sellers walked away profitable
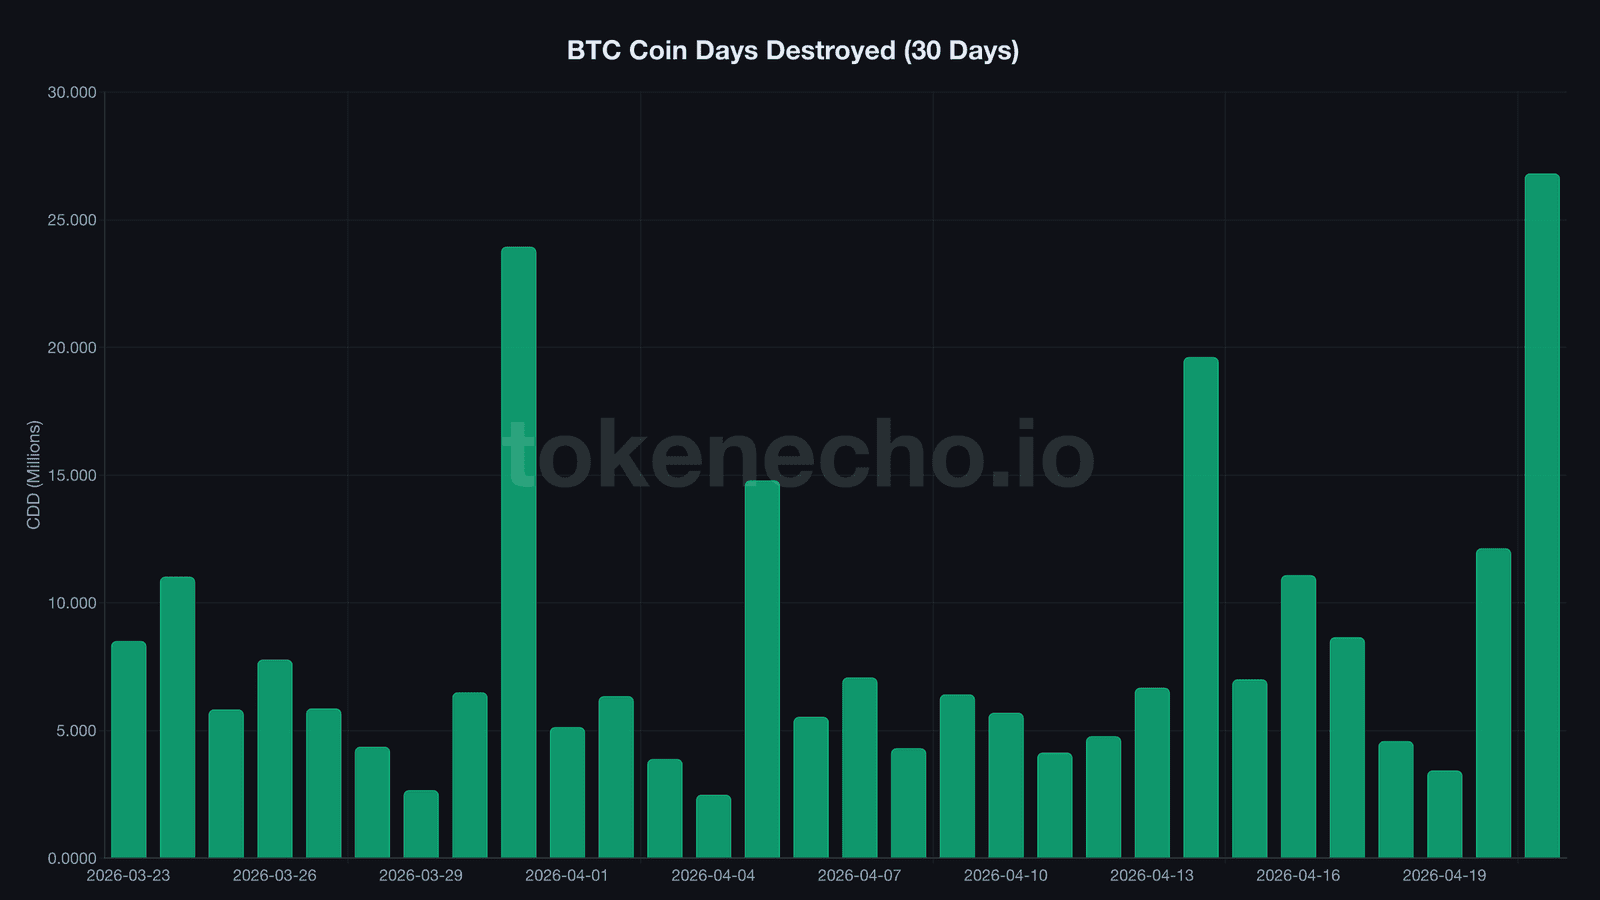
26.81 million coin-days destroyed on April 21. That’s a mouthful of jargon, so let’s unpack it: CDD, a measure of how many old coins are changing hands, just hit a level we haven’t seen since March 22.
Back then, Bitcoin sat at $66,487 and Fear & Greed read 8. Full-blown capitulation. Holders who’d survived FTX, Luna, and COVID finally gave up and sold at a loss.
This time the volume is identical. The intent is not.
LTH-SOPR jumped from 0.835 to 1.070 in a single day. We’ve tracked this metric for weeks, and it hasn’t crossed 1.0 since April 13.
On March 22, long-term holders locked in 27% losses at this same CDD level. On April 21, they booked 7% gains.
It’s the difference between watching 500 houses sell during a foreclosure crisis and watching 500 sell during a spring housing boom. Same transaction count. Completely different market.
SOPR, which measures profit or loss across all Bitcoin transactions, crossed back above 1.0 at 1.001. Sellers across the board are breaking even.
But short-term holders still aren’t there, with their SOPR stuck at 0.997.
“Old whales are selling to TradFi,” Ki Young Ju, CEO of CryptoQuant, said last week. The data backs him up. These coins leave dormant wallets but they don’t land on exchanges.
Exchange reserves crash to cycle low, Binance diverges
The supply squeeze is relentless.
All-exchange BTC reserves hit 2,675,592 on April 21, a new cycle low. The previous bottom was 2,679,635 on April 16.
Over the past 30 days, roughly 30,000 BTC have migrated off exchanges into cold storage or OTC deals. At current prices, that’s $2.3 billion.
April 21’s netflow says it plainly: -5,946 BTC.
But Binance is doing something different. While most major exchanges bled coins, Binance added 1,615 BTC on April 22, bringing its reserves to 619,389.
Over the past month, Binance held steady while competitors hemorrhaged supply.
Why? Binance is where retail and derivatives traders congregate.
Institutional holders tend to withdraw through Coinbase Prime or Kraken’s OTC desk. So the Binance inflow signals short-term repositioning, not a reversal of the broader drain.
A similar divergence appeared during last week’s $74K rally that ended the 46-day fear streak, when exchanges lost coins even as price surged. The pattern keeps holding.
When reserves decline during a rally, it means buyers are pulling coins off platforms and tucking them away. That’s confidence.
Trump killed the last bear case – now what?
What happens when the one remaining macro headwind disappears overnight?
Trump extended Iran’s ceasefire indefinitely on April 21, just hours before the original two-week deadline expired. Pakistani mediators brokered the deal.
The naval blockade remains active and Iran’s parliament called the extension “a ploy,” but the immediate risk of a full-scale military escalation, the factor that pinned Fear & Greed in the single digits for 46 straight days earlier this cycle, has been shelved.
Market sentiment already reflected the shift. Fear & Greed climbed from a low of 8 to 32 today.
Not euphoria. But no longer terror.
ETF investors have been piling in. BTC ETFs absorbed $996.4 million last week, the strongest weekly inflow since mid-January.
IBIT alone took $214 million on April 16. And while Goldman Sachs filed its first-ever Bitcoin ETF, Morgan Stanley’s MSBT has been live since April 8 at a market-low 0.14% fee.
SSR, a ratio comparing Bitcoin’s market cap to stablecoin supply, sits at 11.21. Roughly $148 billion in stablecoins is parked on the sidelines. That dry powder hasn’t fired.
And leverage? Still low at 0.235, meaning this rally runs on spot buying, not a derivatives squeeze waiting to unravel.
March had the same coin-day spike – BTC rallied 17%
The last time CDD crossed 26 million was March 22. Bitcoin traded at $66,487. LTH-SOPR was deeply negative, with long-term holders selling at 24% losses in what became the cycle’s worst capitulation event.
Over the next 30 days, BTC rallied from $66.5K to $78K, a recovery driven not by leverage or derivatives speculation but by persistent spot buying and ETF inflows that pushed holdings past 1.3 million BTC. That’s 17%.
Now the same CDD level has been reached, at $78K, with LTH-SOPR positive at 1.070. March was capitulation. This is redistribution: old holders moving coins at a profit into new hands, not dumping them into a falling market.
The parallel isn’t perfect, and honestly, no parallel ever is. In March, ETFs were bleeding capital and Iran’s war was actively escalating.
Today ETFs add $1B a week and the ceasefire got extended. Fewer headwinds this time.
On-chain scorecard (4 of 6 bullish)
- ✅ SOPR: 1.001, crossed break-even – sellers no longer losing (bullish)
- ✅ Exchange reserves: 2,675,592 BTC cycle low – supply squeeze building (bullish)
- ✅ NUPL, a gauge of network-wide unrealized profit: 0.290, recovering from 0.188 capitulation zone (bullish)
- ⚠️ CDD: 26.81M spike – redistribution, not capitulation, but watch for selling follow-through (caution)
- ⚠️ Puell Multiple, the ratio of daily miner revenue to its yearly average: 0.731 – miners earn 27% below average (caution)
- ✅ Leverage: 0.235, deleveraged and stable – rally is spot-driven (bullish)
TokenEcho verdict: cautiously bullish
- Direction: Cautiously bullish
- Key level: $78,240 (April 18 local high; a close above confirms continuation toward $80K)
- Risk factor: Today’s +909 BTC exchange inflow and Binance’s +1,615 BTC suggest early-stage distribution. If CDD stays above 20M while exchange inflows accelerate, the rally stalls.
This is an analytical assessment, not financial advice.
What to watch over the next 72 hours
- $78,240 breakout with daily volume above $50B. Bullish confirmation of a new trading range. Failure to break means BTC likely consolidates between $75K and $78K.
- Exchange netflow direction. April 22 already shows +909 BTC inflow. Two more inflow days would suggest the supply squeeze is fading.
- Iran blockade developments. Trump extended the ceasefire but the naval blockade remains. Escalation or tightening becomes the next macro catalyst.
This analysis is part of our daily Bitcoin price tracking. See all previous analyses and key metrics on our hub page.
The on-chain data says accumulation. ETFs are buying $1 billion a week. The last geopolitical risk just got punted down the road. If this isn’t enough to push BTC past $78K – what is?
This is not financial advice. DYOR. Data as of April 22, 2026.
Sources: CoinGecko BTC, CryptoQuant, CBS News – Iran ceasefire extension, BYDFi – ETF flows April 2026
Leave a Reply